Using the systematic search, we identified 2985 articles, and after excluding duplicates (1089 articles), we screened 1896 studies for relevance. We excluded animal studies, non-English articles, abstracts without text, and articles unrelated to the topics (1840). Twelve articles were excluded because using other stressor than dobutamine, other reference standards, or provided no data to calculate diagnostic accuracies. Finally, 9 full-text articles were found eligible for the analysis (Fig. 1).
Baseline characteristics
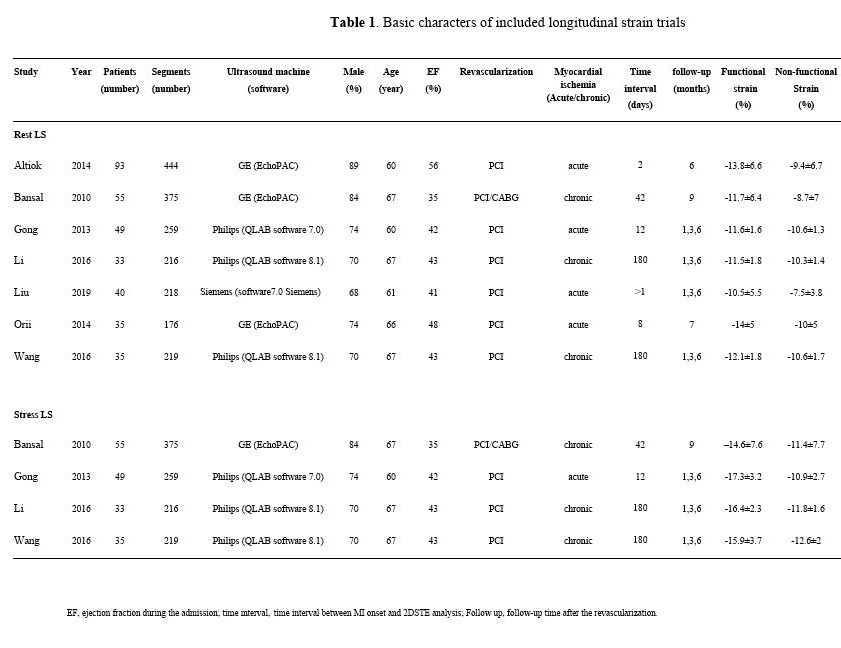
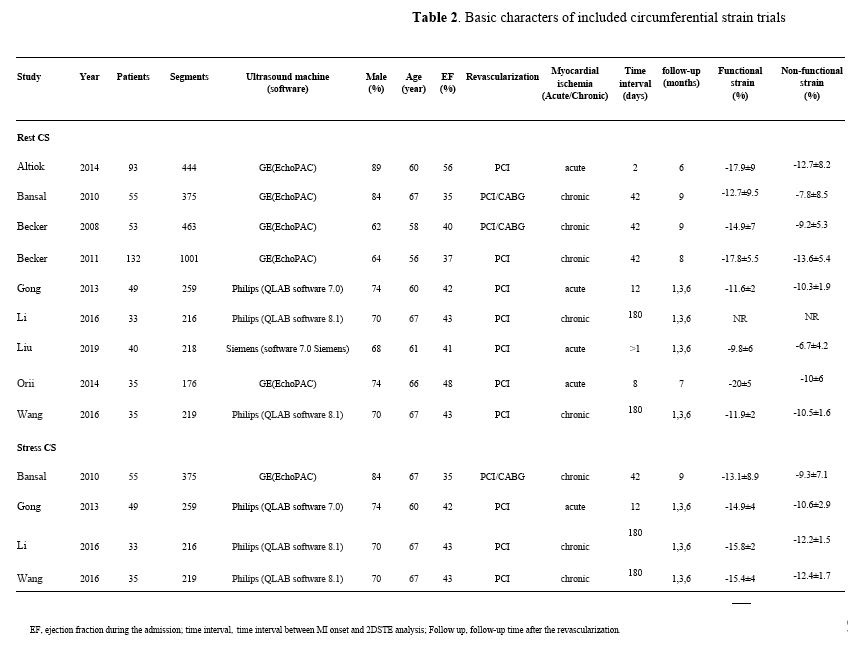
Details of studies included in the meta-analysis are summarized in Tables 1 and 2. There were 5 studies that included patients with chronic ischemic LV dysfunction and 4 studies that included patients with acute MI (2 before late revascularization and 2 after early revascularization).
At rest, LS was evaluated in 7 studies enrolling 340 patients (mean age 64years, 75.6% men; mean EF 44%) and analyzing 1907 segments, whereas CS was evaluated in 9 studies with 525 patients and 3371 segments (mean age 62.4 years, 72.7% men; mean EF 42.7%). During LDD stress, LS was evaluated in 4 studies with 172 patients and 1069 segments (mean age 65 years, 74.5% men; mean EF 40.8%), and CS in 4 studies with 172 patients and 1069 segments (mean age 65 years, 74.5% men; mean EF 40.8%). 2DSTE analysis was performed within 10 days after MI in 4 studies (2–12 days after MI), while 5 studies assessed the myocardial strain later (42–180 days after MI). The median follow-up time after the revascularization was six months. (Table 1, 2)
Diagnostic accuracy
A summary of diagnostic accuracies of strain parameters in predicting regional functional recovery by bivariate models is shown in Table 3. Forest plots and ROC curves are displayed in Figs. 3–6.
Rest LS showed mean weighted sensitivity and specificity of 67.1% (95% CI: 62.5–71.5%) and 64% (95% CI: 59.7–68.1%), respectively. LR + and LR- were 1.8 (95% CI: 1.7 to 2) and 0.5 (95% CI: 0.4 to 0.6), respectively. The mean weighted LS in segments with and without functional recovery were − 12.1% (95% CI: -12.7 to-11.5%) vs.-9.7% (95% CI: -10.4 to-9.0%), MD -2.0% (95% CI: -2.7 to -1.3%), P < 0.001, respectively (Supplemental appendix 1: Fig. 1,2, and 3).
LS during LDD stress was evaluated using dobutamine dose of 10 µg/kg/min in three studies and both 5 and 10 µg/kg/min in one study. The mean weighted sensitivity and specificity of LS during LDD were 81.5% (95% CI: 63.7 to 91.7) and 81.3% (CI: 65.3–90.9%,) respectively. The LR + was 4.3 (95% CI: 1.6 to 12.1) and LR- 0.2 (95% CI: 0.1 to 0.6). The mean weighted LS during LDD in segments with and without functional recovery were − 16.2% (95% CI: -16.9 to -15.4%) vs.-11.7% (95% CI: -12.5 to -10.9%), MD -4.4% (95% CI: -5.8 to -3.0%), P < 0.001, respectively (Supplemental appendix 1: Fig. 4,5, and 6).
Rest CS showed mean weighted sensitivity of 68.7% (95% CI: 63.9–73.1%) and specificity of 65.7% (95% CI: 60–71%). LR + and LR- were 2 (95% CI: 1.7 to 2.4) and 0.5 (95% CI: 0.4 to 0.6), respectively. The mean weighted rest CS strain values in segments with and without functional recovery were − 14.7% (95% CI: -17.1 to-12.4) vs.-10.2 (95% CI: -11.7 to-8.6), MD -4.5% (95% CI: -5.9 to -3.1), P < 0.001, respectively (Supplemental appendix 1: Fig. 7,8, and 9).
CS during LDD stress was evaluated using dobutamine dose of 10 µg/kg/min in 3 studies and both 5 and 10 µg/kg/min in one study. The mean weighted sensitivity and specificity of CS during LDD were 81.5% (CI: 66.2 to 90.8) and 81.4% (CI: 69–89.6%). LR + and LR- were 4.3 (95% CI: 1.6 to 11.3) and 0.2 (95% CI: 0.1 to 0.4), respectively. The mean weighted CS during LDD in segments with and without functional recovery were − 14.9% (95% CI: -15.9 to-13.9%) vs.-11.2% (95% CI: -12.2 to-10.2%), MD -3.7% (95% CI: -4.3 to-3.2), P < 0.001, respectively (Supplemental appendix 1: Fig. 10,11, and 12).
Compared with rest, LS during LDD showed higher sensitivity (p < 0.0001) and specificity (p < 0.0001) for predicting functional recovery. Furthermore, the sensitivity and specificity of CS during LDD stress were superior when compared CS at rest (< 0.0001and p = 0.0008, respectively).
In a sub-analysis, we focused on four studies that performed a head-to-head comparison of rest and LDD strain in the same 172 patients and 1069 segments[10], [12]–[14]. Sensitivity and specificity of LS was higher during LDD stress than at rest (81.5%; 95% CI: 63.7 to 91.7 vs. 65.1%; CI: 61.2–68.8%, p < 0.0001, and 81.3%; CI: 65.3–90.9% vs. 65.9%; CI: 61.4–70.1%, p = 0.005, respectively). Similarly, these studies demonstrated the superiority of sensitivity and specificity of CS during LDD stress when compared CS at rest (81.5%; CI: 66.2 to 90.8 vs. 63.8%; CI: 54.3–72.4%, p < 0.0001, and 81.4%; CI: 69–89.6% vs. 61.9%; CI: 56- 67.5%, p < 0.0001, respectively).
Considering the substantial degree of heterogeneity observed in the summary estimates, we performed a further sensitivity analysis by excluding the outlier studies. After exclusion of three studies evaluating CS at rest[13–14, 20]and one study evaluating LS and CS during LDD stress[10], the diagnostic accuracy of CS at rest as well as CS and LS during LDD stress were slightly improved. (Supplemental appendix 2: Table 1)