3.1 Characterization of Cu2(OH)3Cl
Figure 1 displayed a X-ray diffraction (XRD) pattern of Cu2(OH)3Cl, and obvious diffraction peaks were observed at 16.5°, 31.2°, 32.8°, 38.7°, 40°, 50.3° and 53.9°. They were totally indexed to (011), (-121), (013), (202), (023), (033) and (040) lattice planes of paratacamite Cu2(OH)3Cl (γ-Cu2(OH)3Cl, JCPDS 86-1391). Notably, no typical peaks belonging to atacamite Cu2(OH)3Cl were observed (α-Cu2(OH)3Cl, JCPDS 25–0269) (Wang et al. 2021a), indicative of successful single phase fabrication via this method. Generally, more alkaline condition was in favor of the recrystallization from α-Cu2(OH)3Cl to γ-Cu2(OH)3Cl (Pollard et al. 1989). Compared with α-Cu2(OH)3Cl, the Cu(I) content in γ-Cu2(OH)3Cl increased remarkably and exhibited advanced POD activity via Fenton reaction (Wang et al. 2021a). The morphology and microstructure of the Cu2(OH)3Cl were further investigated by scanning electron microscopy (SEM) and transmission electron microscopy (TEM). SEM image (Fig. 2a) showed a hierarchical structure of Cu2(OH)3Cl sheets with an overall diameter of 20–30 µm. HRTEM image (Fig. 2b) displayed two lattice fringes with spacing of 0.24 nm and 0.22 nm, corresponding to (202) and (023) planes of γ-Cu2(OH)3Cl. The elemental mappings (Fig. 2c-f) revealed that Cu, O and Cl were homogenously distributed on the surface of γ-Cu2(OH)3Cl (Fig,2d) and the atomic ratio of O to Cl reached 2.6ะ1. Lower oxygen composition in Cu2(OH)3Cl was possible due to existence of oxygen vacancies (OV), which was generally common in oxides and hydroxides (Ye et al. 2019; Al-Hashem et al. 2019).
XPS analysis were performed to investigate the chemical composition and oxidation states presented in the Cu2(OH)3Cl. The whole XPS spectrum (Fig. 3a) confirmed the presence of Cu, O and Cl without any impurities. Their atomic percentages obtained were 35.54% (Cu), 45.02% (O) and 19.44% (Cl) respectively. This result was almost consistent with the EDS measurements, further indicative of oxygen deficient in this Cu2(OH)3Cl. As depicted in Fig. 3b, the binding energies of Cu 2p3/2 and Cu 2p1/2 were maxima at 934.7 eV and 954.7 eV respectively. Obviously, Cu2+ and Cu+ were coexisted in Cu2(OH)3Cl since the weak stability in lattices (Lu et al. 2021). Besides, the O 1s XPS spectrum was fitted into three peaks (Fig. 3c), and they were individually assigned to lattice oxygen (OL)/ hydroxyl (OOH) at 530.7 eV, the oxygen atoms in the vicinity of an oxygen vacancy (OV) at 531.4 eV and chemisorbed water (OW) at 532.1 eV (Tang et al. 2020). Being an effective tool for determination of unpaired electrons in materials, Electron paramagnetic resonance (EPR) was further employed to evidence the OV in Cu2(OH)3Cl (Zhang et al. 2016; Hao et al. 2018) (Fig. 3d). The obtained Cu2(OH)3Cl represented an obvious EPR signal arising from the electrons trapped on oxygen vacancies. Basically, the peroxidase-like and oxidase-like activities of nanozyme were strongly related with amounts of OV in the material (Lu et al. 2020; Wang et al. 2022). They were served as active sites for adsorption and activation of O2 and H2O2 (Wang et al. 2021b).
The FTIR spectrum of Cu2(OH)3Cl (Fig.S1) displayed three typical peaks at 3309 cm− 1 3359 cm− 1 and 3447 cm− 1, corresponding to typical O-H stretches with different atomic distances (d O–H) and hydrogen bond angles (θ O–H⋅⋅⋅Cl) (Wang et al. 2021a). And the absorption peak located at 1634 cm− 1 should be attributed to O-H bending vibration. These results demonstrated that the obtained Cu2(OH)3Cl was functionalized by amounts of hydroxyl groups. In fingerprint region, besides, the peak was clearly observed at 912 cm− 1, attributable to Cu-O-H of copper hydroxychlorides (Zhao et al. 2020). Besides, Fig S2 depicts TG and DTG curves. The decomposition of Cu2(OH)3Cl basically displayed two major steps: Initially, 13% mass loss was observed in the range of 187 ℃ to 330 ℃ accompanied with an endothermal peak centered at 263 ℃. This step was caused by dehydration process. The second step was displayed between 330 ℃ and 604 ℃ with an endothermal peak at 542 ℃. It was possibly attributed to the loss of halogen and the formation of CuO, indicative of its strong thermo stability (Bhatta et al. 2021).
3.2 Analysis of POD activity
A typical chromogenic substrate (TMB), was selected to validate the POD activity of Cu2(OH)3Cl. As shown in Fig. 4a, the TMB, H2O2 and Cu2(OH)3Cl were mixed together, which represented three absorption peaks located at about 370 nm, 450 nm and 652 nm respectively. Whereas, negligible absorbance was acquired in the absence of the Cu2(OH)3Cl or H2O2, indicative of superior peroxidase-like property for the Cu2(OH)3Cl rather than an oxidase-like activity (Fig. 4a). As illustrated in Fig.S3, there were two kinds of charge-transfer species during the whole peroxidation of TMB, namely single-electron reducing product (TMB-TMB++) and double-electrons reducing product (TMB diamine). The TMB-TMB++ represented blue color with the absorbance at 370 nm and 652 nm, and TMB diimine showed yellow color with a peak located at 450 nm (Huang et al. 2018). However, this phenomenon has always been neglected in the previous studies, and investigations were mainly focused on the peak variations at 652 nm (Jiang et al. 2017). As depicted in Fig. 4a, the Cu2(OH)3Cl-catalyzied product should be a mixture containing above two species. Additionally, some other chromogenic substrates were used to evaluate its catalytic capability, such as 2,2’-azino-bis (3-ethylbenzthiazoline-6-sulfonic acid) (ABTS) and o-phenylenediamine (OPD). Interesting, these two indicators exhibited no responses in the presence of H2O2 and Cu2(OH)3Cl.
In term of catalytic mechanism, the reaction pathways of POD were generally based on the principles of hydroxyl radicals and/or electron transfer (Zheng et al. 2016). To interpret the principle, we first used terephthalic acid (TA) as a fluorescence indicator to study if hydroxyl radicals were produced during the Cu2(OH)3Cl-catalyzied POD process. Figure 4b showed that there was a weak fluorescence emission at 440 nm (indicative of radical reaction) in the mixture of TA, H2O2 and Cu2(OH)3Cl. However, there were no obvious changes in POD activity when the reaction system was mixed with isopropanol (IPA, a hydroxyl radical quencher) (Fig. 4c). The contradictory results indicated that hydroxyl radicals were indeed generated but they were not the core factor to drive the catalytic process. Besides, Fig. 4d displayed the cyclic voltammograms of Cu2(OH)3Cl with and without H2O2, of which a remarkable reduction response occurred in the presence of H2O2. Obviously, a distinct electron transfer has been triggered during the POD reaction of TMB, which was accelerated by Cu2(OH)3Cl as a mediator.
3.3 Ratiometric sensor for determination of phenols
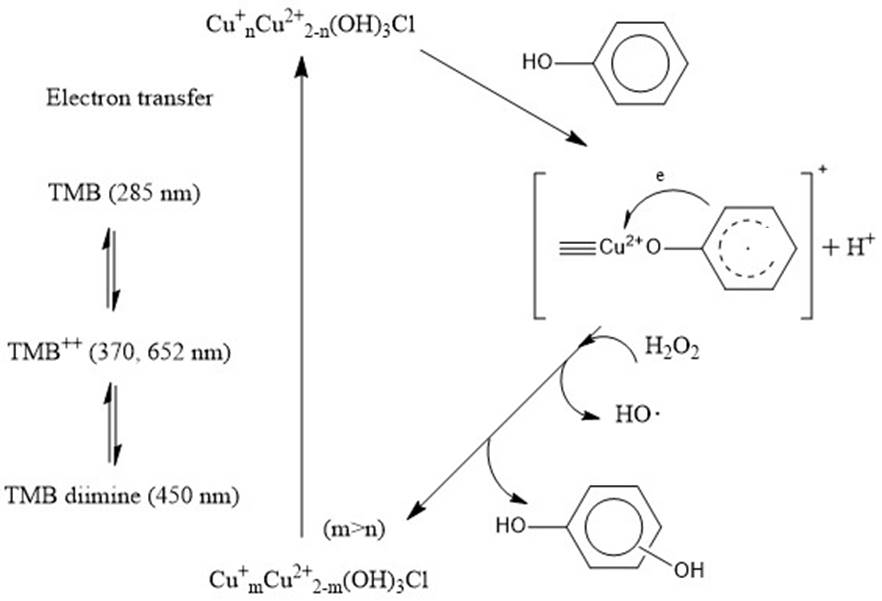
Varied regulations of different phenols on dual-absorbance of TMBox mixture were discovered in Fig. 5. Inspired by the previous works (Wang et al. 2021a), we speculated the interaction between Cu2(OH)3Cl and phenols are as follow (Scheme 1): (1) a σ-Cu-ligand complex was formed in which the surface Cu2+ of Cu2(OH)3Cl combined with the hydroxyls of phenols. (2) Electrons of the phenols were transferred to Cu2+ through the complex. (3) In the presence of H2O2, the σ-Cu-ligand complex would be cleaved resulting in both the reduction of Cu2+ to Cu+ and the hydroxylation of aromatic ring, as well as producing hydroxyl radicals during reaction. Integrating with the interaction principles among Cu2(OH)3Cl, TMBox and phenols, it was reasonable to speculate that electron transfer might be occurred across these three compounds via redox process (Scheme 1).
As depicted in Fig.S4, compared with previous mixture of Cu2(OH)3Cl, H2O2 and TMB, a new oxidation peak was obviously seen in the cyclic voltammograms after addition of o-THB. Further, the oxidation peak for o-THB was significantly stronger than that of m-DHB (Fig.S5). It’s indicated that electron transfer was triggered among Cu2(OH)3Cl, phenols and TMBox species. In addition, because of varied steric hindrances and reducing ability, different electron transfer pathways occurred for each phenol, resulting in distinguished composition of TMBox species and colorimetric signal outputs. The difference of electrochemical features between o-THB and m-DHB confirmed this speculation. With this consideration, the POD-like Cu2(OH)3Cl could be employed as a receptor element in the colorimetric sensor array for discrimination of various phenols.
Figure 5a-5d showed the absorption titration measurements to investigate feasibility of Cu2(OH)3Cl-based sensing system for m-DHB, p-DHB, o-THB and phenol. Upon gradual addition of each target, the absorption peaks at 450 nm and 652 nm displayed different changes in intensity. In the presence of m-DHB, for example, the typical peak of TMB-TMB++ at 652 nm deceased sharply, and that of TMB diimine at 450 nm remained unchanged (Fig. 5a). Figure 6a showed that the I652/I450 deceased linearly with the increased levels of m-DHB ranging from 20 to 1000 µM (I652/I450 = 6.303-0.0036C, R2 = 0.98). Interestingly, the I652/I450 feature for o-THB showed resemblance with that of m-DHB (Fig. 5b), but the linear range was from 0 to20 µM (Fig. 6b). As for p-DHB, both absorption peak at 652 nm and 450 nm were decreased linearly in the level of 0–20 µM (Fig. 5c and Fig. 6c). As shown in Fig. 5d, the sensing system was obvious insensitive to phenol where both of absorbance were almost unchanged. Consequently, the LODs of m-DHB, p-DHB and o-THB were 12.25, 0.0124 and 0.004 µM, respectively. The favorable performance should be arising from the dual-signal outputs of our colorimetric assay. Although the LOD was still inferior to that of mass spectrometry and Western blot, and the current analytical system would be improved if increasing POD activity of Cu2(OH)3Cl.
3.4 Colorimetric sensor array for discrimination of phenols
Since different impacts of each phenols on I652/I450, it was available to design an effective colorimetric sensor array based on Cu2(OH)3Cl to discriminate them. In this regard, four phenols (i.e., m-DHB, p-DHB, o-THB and phenol) were selected as the analytes to testify feasibility of this sensor array. Fig.S6 showed varied time-dependent plots of I652/I450 among these phenols, providing a necessity to realize their discrimination. According to data of Fig.S6, the fingerprints have been extracted from the absorbance ratio (I652/I450) at a series of time points ranging from 10 to 60 min (Fig. 7a). After three parallel measurements, a two-dimensional PCA pattern was studied according to the data from fingerprints (6 time points × 4 analytes×3 replicates). As shown in Fig. 7b, four isolated groups were distinctly classified with no overlaps. In addition, similar PCA patterns were explored in varied concentrations of phenols. As shown in Fig. 7c and 7d, well-defined classifications were also observed in each pattern. These indicated that the sensor array displayed excellent reliability in a broad of concentration level. To explore the robustness of sensing strategy, we randomly tested 6 unknown samples (Table S1). The whole measurements were performed by comparing with the PCA pattern in Fig. 7. Obviously, all the unknown samples have been identified correctly, further confirming its availability in real applications.