3.1 Phagocytosis regulators regulate macrophage phagocytosis in tumor development
Figure 1A depicts the study’s flowchart, whereas Fig. 1B depicts the evolution of TAM in the tumor microenvironment and its mechanism of action schematically. We identified 271 phagocytosis regulatory factors in the linked literature, 260 of which included information on their expression. Then we calculated the Pearson correlation coefficients and P-values for the 260 phagocytosis regulators and macrophage enrichment scores (Supplementary Table 2), and we used the top six to generate scatter plots. The correlations between the genes shown in the plots and macrophages were larger than 0.8 and P < 0.01 (Fig. 2A-F). We further classified the top six genes into high and low expression groups based on their median expression levels, and the results indicated that the macrophage enrichment scores for all genes in the high expression group were significantly higher than those in the low expression group, which was consistent with the correlation results (Fig. 2G-L).
Then, we ran a functional enrichment analysis on genes controlled by phagocytosis. Among these, the examination of GO enrichment was subdivided into three sections: biological process (BP), cellular component (CC), and molecular function (MF). The pathways enriched by BP are primarily immune response-activating cell surface receptor signaling pathways, the pathways enriched by CC are primarily mitochondrial inner membrane pathways, the pathways enriched by MF are primarily transcription coactivator activity pathways, and the pathways enriched by KEGG are primarily thermogenesis pathways, among others (Fig. 2M-P).
To further investigate the aberrant phagocytosis in tumors, we examined the functional enrichment of age grouping (> 60 vs. ≤60) and stage (III-IV vs. I-II) of cancer samples in the set of 34 phagocytosis-related genes. The results showed that we enriched 5 gene sets in the > 60 groupings for the age grouping, and then we enriched 29 gene sets in the ≤ 60 groupings, but none reached significant levels. While for the stage grouping, we enriched 22 gene sets in III-IV, which reached significant levels with three pathways (Fig. 2Q-S).
3.2 Phagocytosis regulators genes and transcriptional alterations in tumors
We then evaluated differences in the expression of phagocytosis regulatory variables between age, gender, pathologic M, pathologic N, pathologic T, tumor stage, Breslow depth, and Clark level subgroups in cancer samples. The findings revealed that 41 genes were differentially expressed in the age grouping, 19 genes in the gender grouping, 6 genes in the pathologic M grouping, 25 genes in the pathologic N grouping, 109 genes in the pathologic T grouping, 104 genes in the tumor stage subgroup, 131 genes in the Breslow depth subgroup, and 63 genes in the Clark level subgroup (Fig. 3A-H). Due to many phagocytosis regulators, the significant results were tabulated, and we included the details in Supplementary Table 3.
We mapped the mutation profiles of phagocytosis regulators based on the MAF files for TCGA-SKCM mutations. Due to the large number of genes, only the top 20 were displayed, and the results indicated that the mutation rate of the top 20 phagocytosis regulating factors was 66.17% in SKCM samples, with ZDBF2 having the greatest mutation rate, followed by HDAC9 (Fig. 3I). We calculated the copy number changes of phagocytosis regulators using the TCGA-SKCM gene-level copy number data. The top 30 genes were displayed since there were more genes, among which RRAGA had the greatest frequency of deletion and PTEN had the second highest (Fig. 3J). Additionally, we determined the frequency of copy number alterations in the top 30 phagocytosis regulators (Fig. 3K) and plotted the locations of all phagocytosis regulators on each chromosome (Fig. 3L).
We examined the influence of phagocytosis regulators’ expression on survival using OS data. Due to a large number of genes, we first used univariate Cox regression to identify those significantly associated with survival. The results indicated that the expression of 84 of 260 phagocytosis regulators was significantly associated with prognosis, with 13 genes having HR > 1 and the remaining 71 genes having HR < 1, as shown in Supplementary Table 4. Then the nine genes with the lowest P-value are listed. And then, we presented the KM curves of these nine genes (Fig. 4A-I). We used OS data to investigate the influence of phagocytosis regulator mutations on survival. Due to many genes, we first screened for genes associated with survival using univariate Cox regression. The results indicated that 126 genes had mutations in at least five samples, of which 7 genes had mutations associated with prognosis, with 4 genes having HR > 1 and the remaining 3 genes having HR < 1, as shown in Supplementary Table 5. Following that, we created the KM curves for these seven genes (Fig. 4J-P).
3.3 Different modes of phagocytosis regulation in tumors
We performed unsupervised clustering on phagocytosis regulators’ expression matrix samples (Fig. 5A-C) and identified two subtypes with significantly different KM curves (Fig. 5D). The survival curves of cluster 1 samples decreased significantly faster than those of cluster 2, while PCA scatter plots revealed a clear distinction between the two subtypes (Fig. 5E). Additionally, there were significant differences in the expression of phagocytosis regulators between the two subtypes (Fig. 5F).
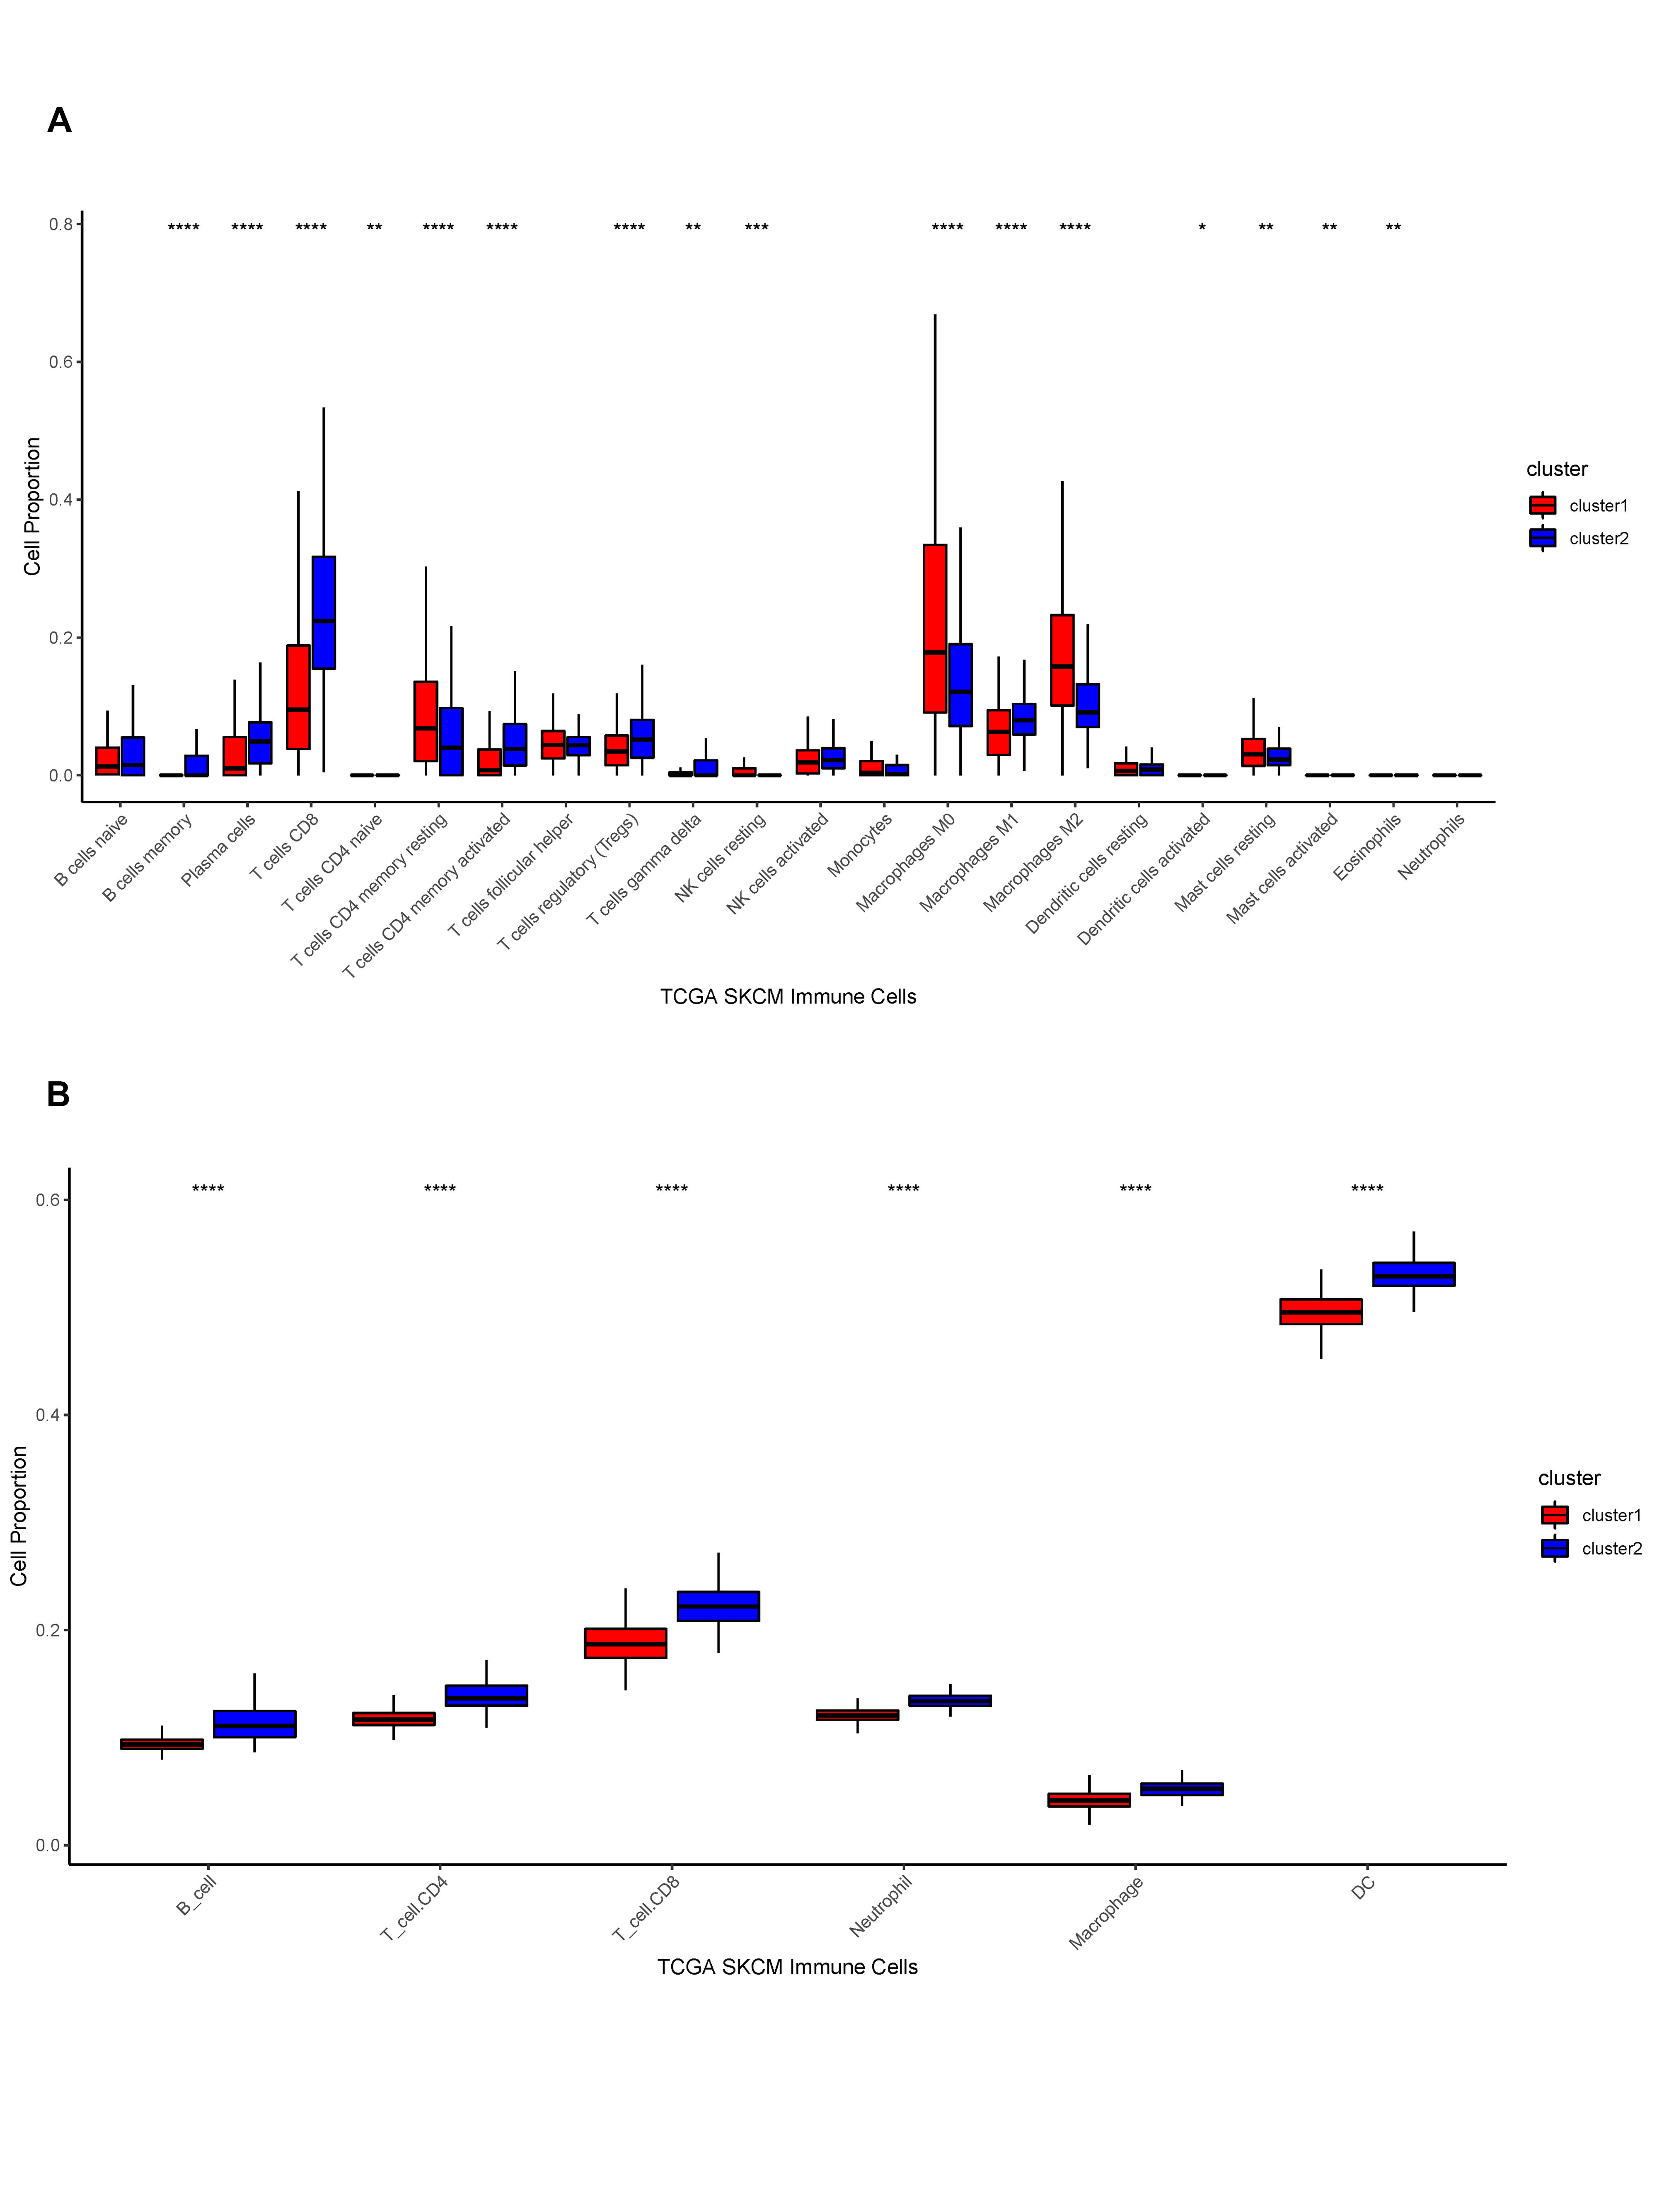
We then etched the TME between distinct phagocytosis subtypes. We first performed an enrichment analysis of hallmark pathways within samples between subtypes using the MSigDB database and found that 37 out of 50 pathways had significant differences, including HALLMARK_TNFA_SIGNALING_VIA_NFKB and HALLMARK_TGF_BETA_SIGN ALING, which were all significantly different between the two subtypes (Fig. 5G). Additionally, we generated the StromalScore, ImmuneScore, ESTIMATEScore, and TumorPurity scores for cancer samples and quantified the differences in sample-related scores between subtypes. StromalScore, ImmuneScore, and ESTIMATEScore scores were considerably higher in cluster 2 samples than in cluster 1, although TumorPurity scores were significantly higher in cluster 1 samples than in cluster 2 (Fig. 5H-K). The enrichment scores of 28 immune infiltrating cells in cancer samples were then calculated. The results indicated that all immune infiltrating cells were considerably different between the two subtypes, with activated B cells, activated CD4+ T cells, and activated CD8+ T cells scoring significantly higher in cluster 2 than in cluster 1 (Fig. 5L). Additionally, we determined the fraction of immune cells in cancer samples using the R package CIBERSORT and the online TIMER database. We demonstrated the corresponding box plots in Supplementary Fig. 1A-B. Moreover, we compared the expression of immunological checkpoints between subtypes; the results demonstrated that 43 of 45 immune checkpoints exhibit differential expression, with CD274, CTLA4, PDCD1, and LAG3 being considerably overexpressed in cluster 2 (Fig. 5M).
Then, we validated the regulatory mechanisms underlying distinct phagocytosis isoforms. Furthermore, we utilized all protein-coding genes and screened for DEGs between isoforms, then identified 661 DEGs based on threshold values. On DEGs, we performed functional enrichment analysis. The GO enrichment analysis was divided into three sections: BP enrichment pathways were primarily concerned with T cell activation, CC enrichment pathways were primarily concerned with the external side of the plasma membrane, MF enrichment pathways were primarily concerned with cytokine receptor binding, and KEGG enrichment pathways were primarily concerned with cytokine-cytokine receptor interaction (Fig. 6A-D). We then performed unsupervised clustering on the samples using the DEGs’ expression matrix. We obtained two isoforms with significant differences in the KM curves of the samples between the isoforms and significant differences in the expression of the DEGs between the two isoforms (Fig. 6E-F). The expression of phagocytosis regulators was then compared between differential subtypes, and the results indicated that the expression of several phagocytosis regulators varied between differential gene expression subtypes (Fig. 6G).
3.4 Phagocytosis regulators related system (PRRS)
We first performed the construction of PRRS. We screened 582 survival-related DEGs using univariate Cox regression based on DEGs in TCGA data, then performed PCA on these 582 genes to obtain PC1 and PC2 for summation, attained PRRS scores, and then divided them into high and low PRRS groups with the median. The difference in KM curves between the two groups was significant. And then, we used the sample risk score as the model prediction result and combined it with the survival data to calculate the AUC of the model. The AUCs of 1, 3, and 5 years were greater than 0.6, indicating good model efficacy (Fig. 7A-E). We validated the model’s efficacy in GSE54467. Then we performed PCA based on the expression matrix of survival-related DEGs in GSE54467, attaining PC1 and PC2 and calculating their sum to obtain the PRRS. We utilized the median as the division to obtain the high and low PRRS groups, respectively. The KM curves of the two groups were significantly different, and the AUC values based on the time ROC curves were all greater than 0.6 (Fig. 7F-J).
We further examined the independent prognostic effect of PRRS subgroups using TCGA data. The results showed that the PRRS subgroup, age subgroup, and stage subgroup had better prognostic efficacy and were independent of each other (Fig. 8A-B). Similarly, we combined the age, gender, and stage to verify whether the PRRS score subgroup was an independent prognostic factor in the GSE54467 data. The results demonstrated that the PRRS score subgroups had better prognostic efficacy and were relatively independent (Fig. 8C-D).
Then, we further counted the PRRS differences in age, gender, pathologic M, pathologic N, pathologic T, tumor stage, Breslow depth, Clark level, and molecular subtype groupings. The results demonstrated that the PRRS score of pathologic T gradually decreased with increasing grade; the PRRS score of patients with Clark level of IV-V was significantly lower, and the PRRS score of patients with tumor stage of stage II was significantly lower than that of stage I; the PRRS score of patients with cluster 2 in subtype classification was higher (Fig. 8E).
3.5 Analysis of the molecular mechanisms of different PRRS
We further examined the correlation between PRRS and cancer hallmarks enrichment scores, and the results showed that most pathways were significantly correlated with PRRS, especially HALLMARK TNFA SIGNALING VIA NFKB, HALLMARK APOPTOSIS were significantly positively correlated with PRRS, while HALLMARK DNA REPAIR, HALLMARK MYC TARGETS V2 were significantly and negatively correlated with PRRS (Fig. 9A).
Then, we further performed GESA-based GO and KEGG enrichment analysis based on PRRS grouping. For GO enrichment results, the main enrichment pathways were activation of innate immune response, adaptive immune response, and so on. Additionally, for KEGG enrichment results, the main enrichment pathways are cytokine-cytokine receptor interaction, endocytosis, and so on (Fig. 9B-C).
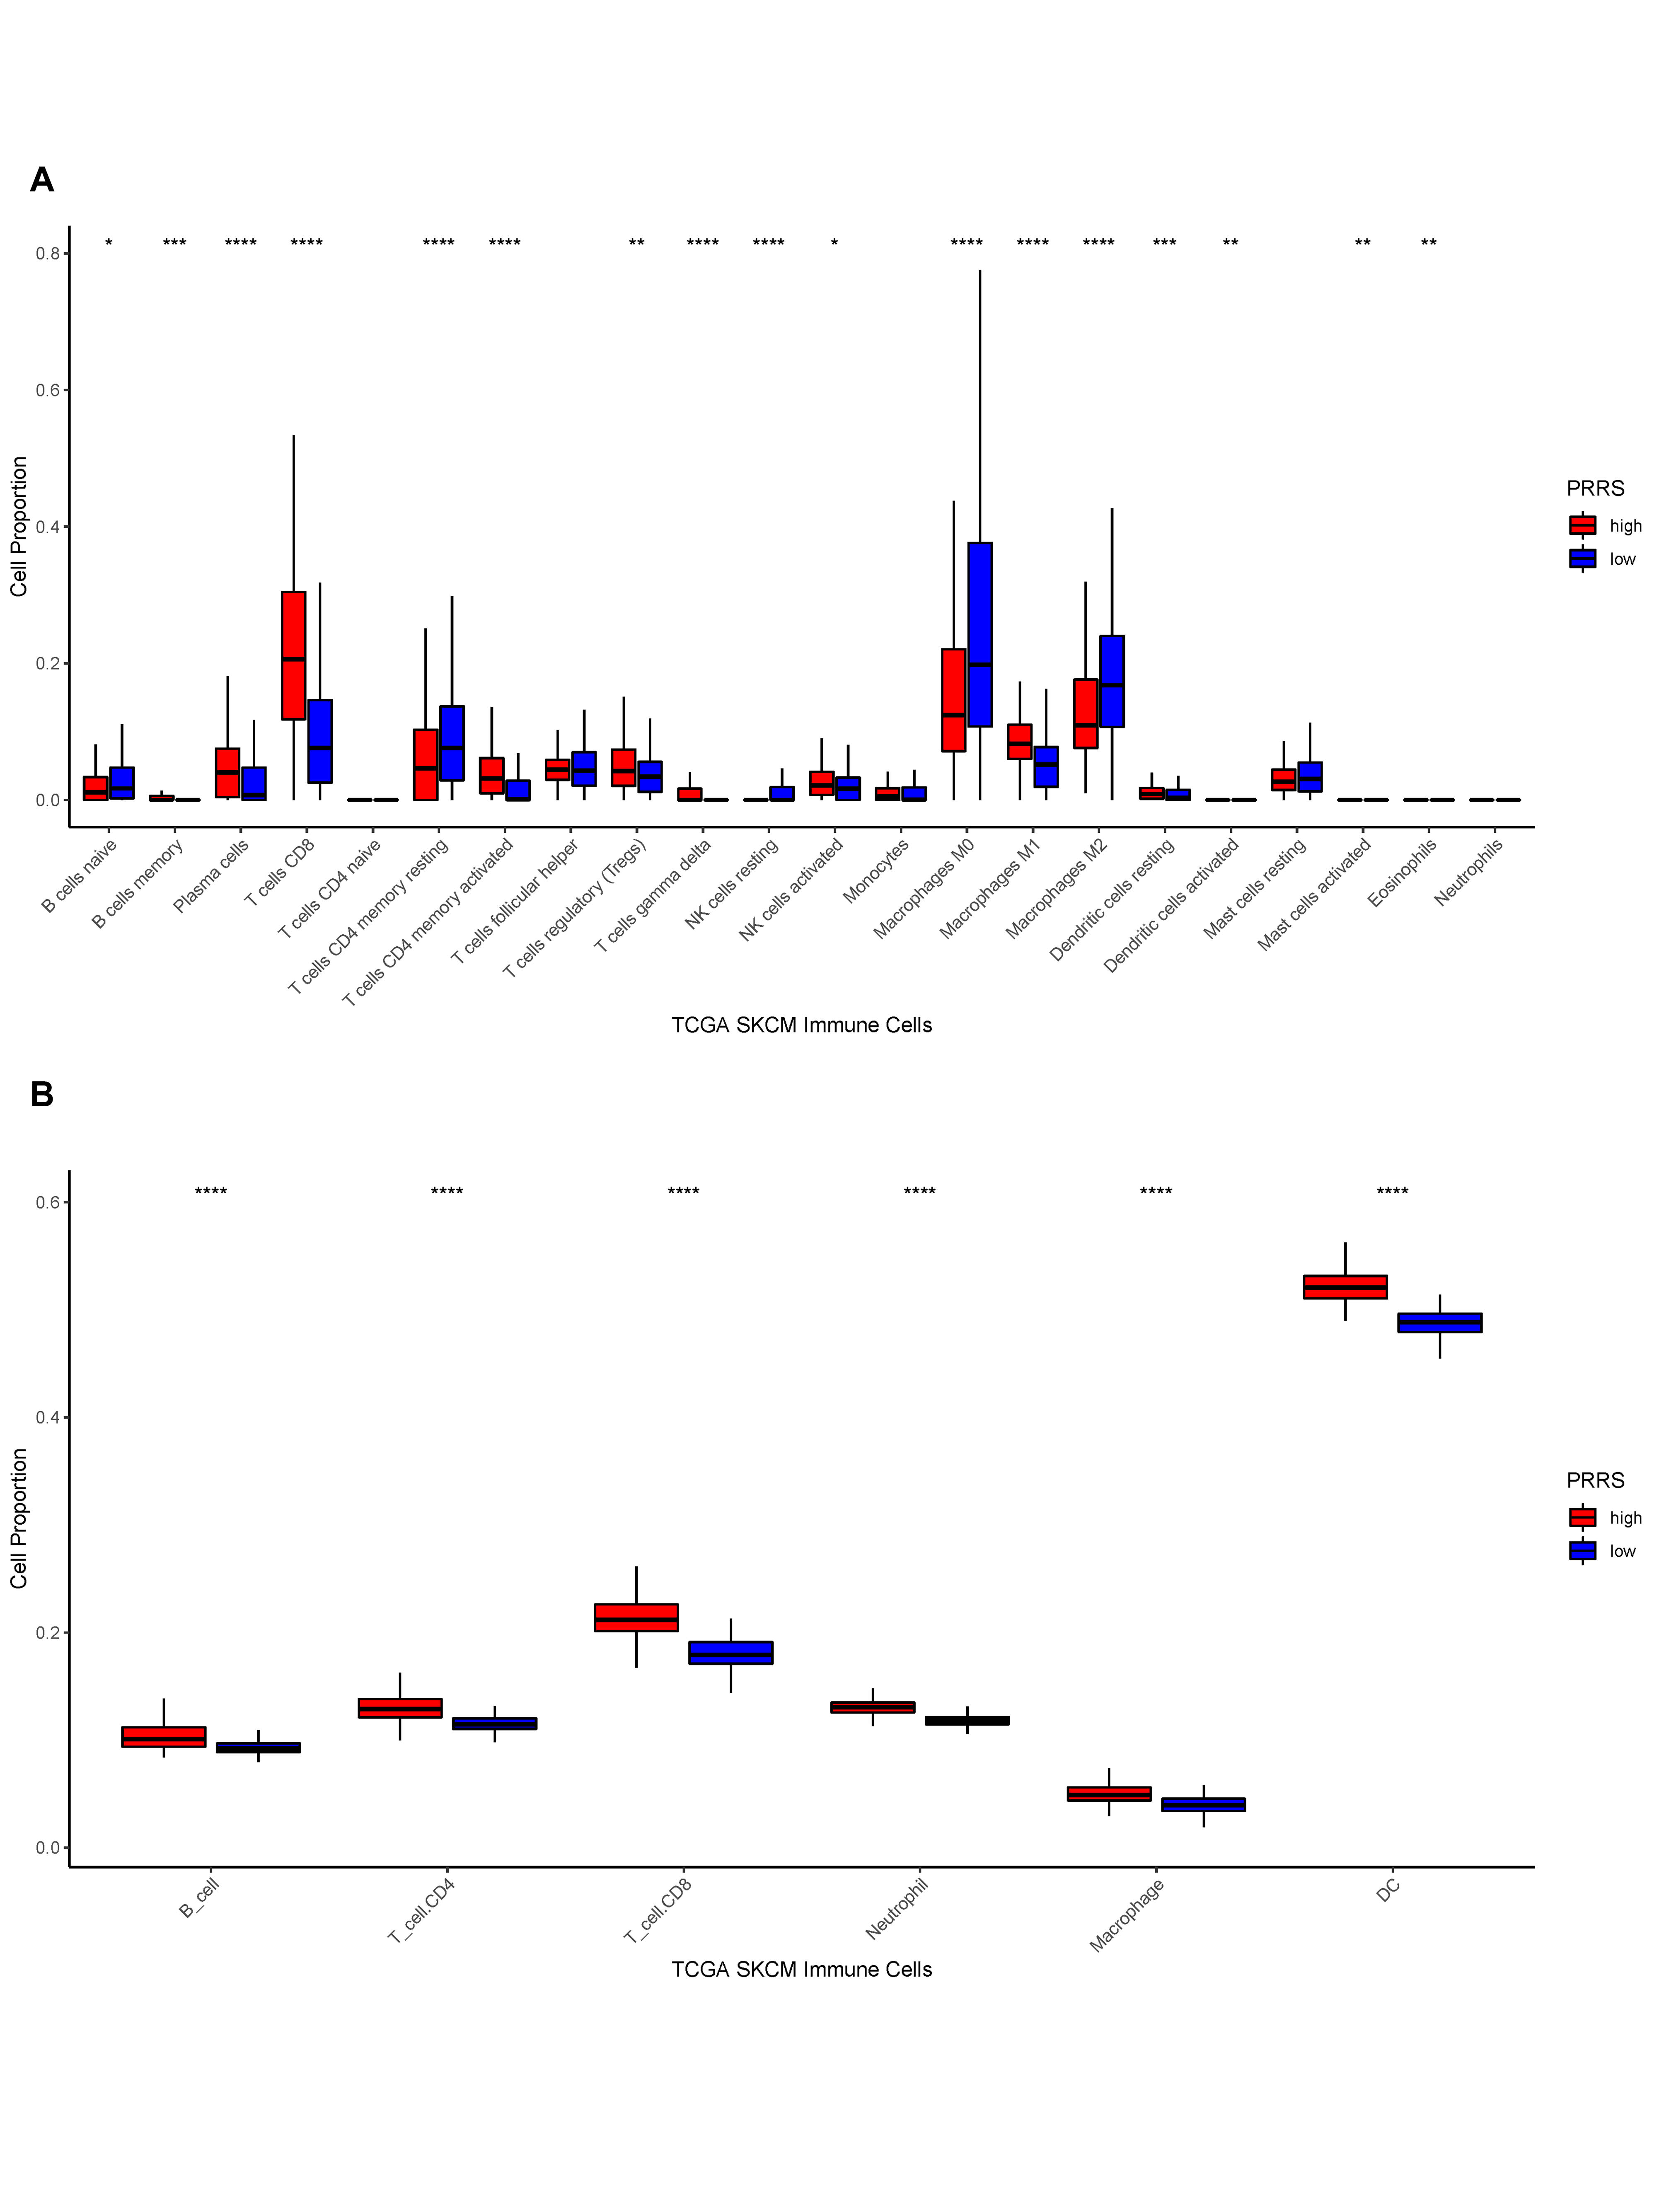
Following that, we inscribed the TME for the different PRRS groupings. The results indicated that StromalScore, ImmuneScore, and ESTIMATEScore were significantly higher in samples with a high PRRS than in samples with a low PRRS. However, TumorPurity was the inverse (Fig. 9D-G). And then, we counted the enrichment scores of 28 immune infiltrating cells between different PRRS groups. The results indicated a statistically significant difference in the number of immune infiltrating cells in the different PRRS groups. We concluded that all immune infiltrating cell enrichment scores were significantly greater in high PRRS samples than in low PRRS samples (Fig. 9H). Additionally, we evaluated the differences in immune infiltrating cell proportions between high and low PRRS subgroups using CIBERSORT and online TIMER data. We demonstrated the corresponding box plots in the Supplementary Fig. 2A-B.
Furthermore, we investigated the differences in genomic changes between PRRS subgroups. We calculated the frequency of CNV changes between PRRS subgroups and found that CNV changes were considerably lower in high PRRS samples than in low PRRS samples (Fig. 9I-K). Additionally, we counted the differences in CNV between genes in the PRRS subgroups and found 5202 genes with substantial CNV differences between the two groups. We also evaluated gene mutations between PRRS groupings and found that the mutation rate was slightly greater in high PRRS samples than in low PRRS samples (Fig. 9L-M). We further counted the genes that had significantly different mutations between the two groups of samples. The findings indicated that 325 genes had significantly different mutations between the two groups, as shown in Supplementary Table 5.
3.6 Potential treatment strategies for PRRS
We predicted the reaction of samples in the high and low PRRS groups to 138 medications (Supplementary Table 6). We then displayed box plots to demonstrate the six with both substantial differences and common medications. The results indicated that the high PRRS samples were more medication resistant (Fig. 10A-F).
Additionally, we collected IMvigor210 bladder cancer data and generated sample PRRS scores based on gene expression data within the model. The KM curves indicated no significant differences between the high and low PRRS groups. However, PRRS scores were considerably higher in complete response (CR) samples than in partial response (PR) or progressive disease (PD) samples, implying that PRRS scores may be related with immunotherapy response (Fig. 10G-K). Moreover, the endogenous processes of SKCM and their influence on the antitumor immune response are summarized in Fig. 10L.
3.7 Validation of expression-based regulators of survival significantly associated with phagocytosis
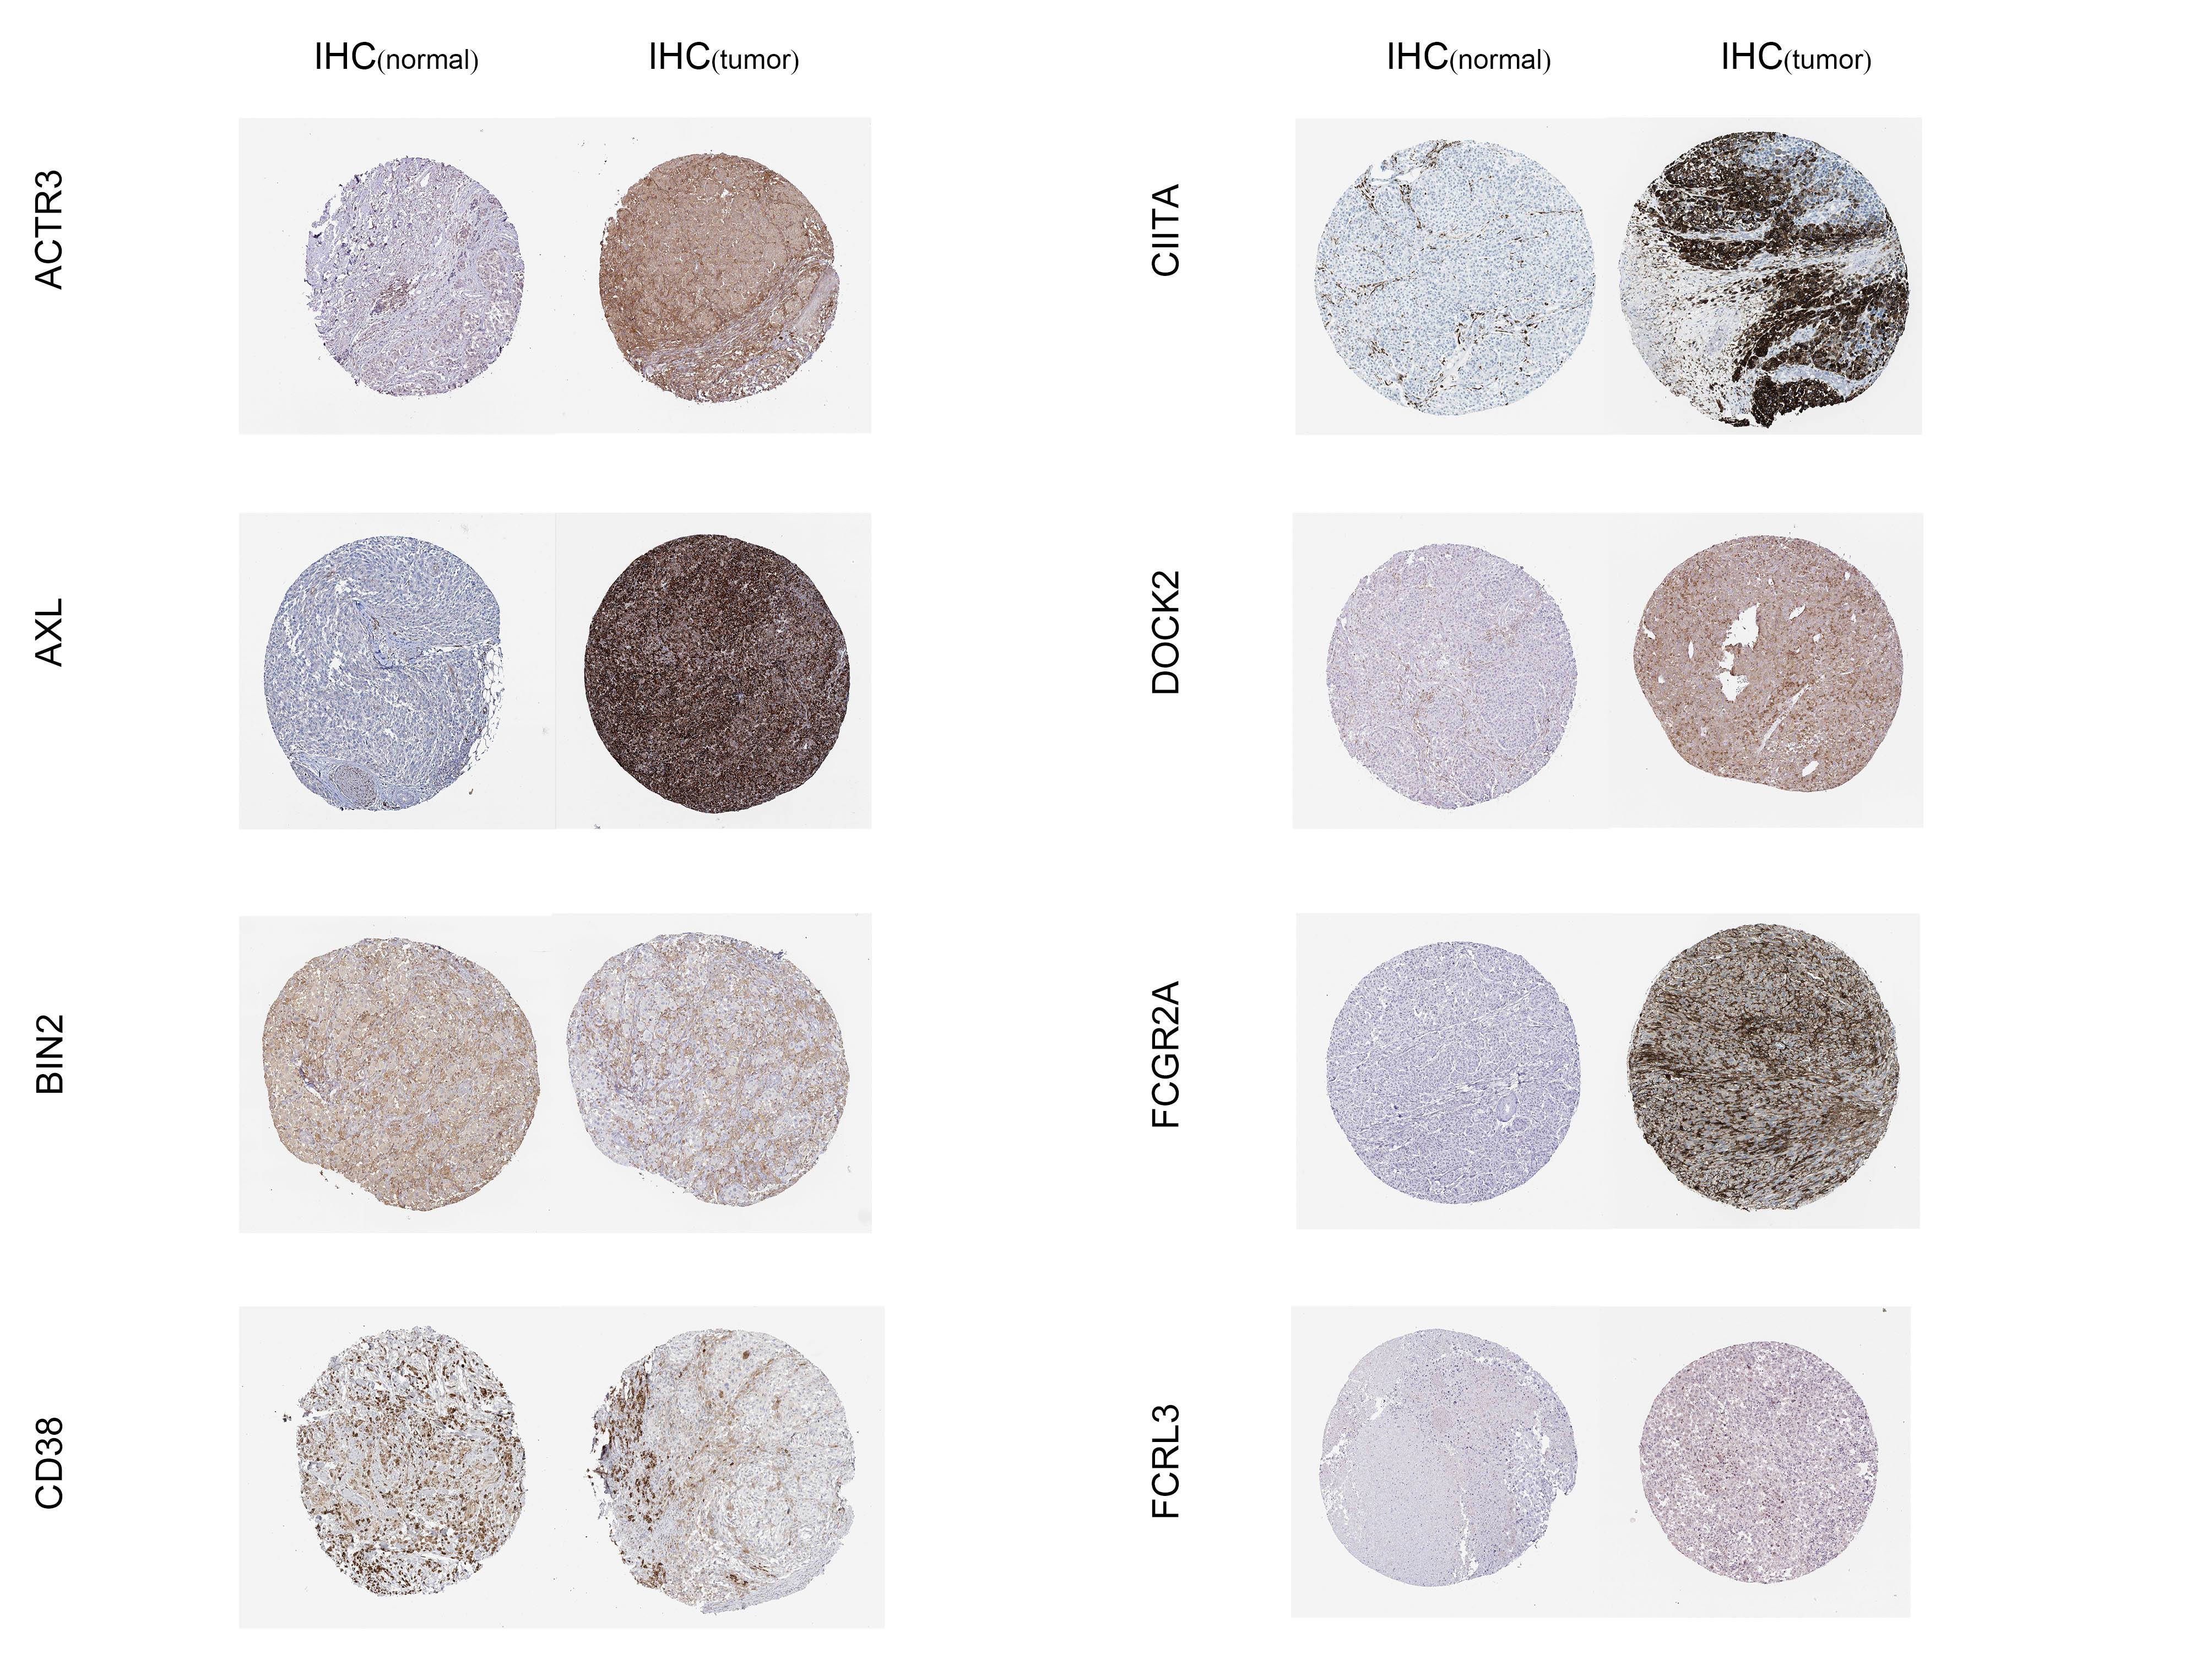
We downloaded immunohistochemical images of phagocytosis regulators based on the expression of significant survival-related (ACTR3, AXL, BIN2, CD38, CIITA, DOCK2, FCGR2A, FCRL3) from the Human Protein Atlas database. The expression levels of these proteins in normal skin and SKCM were confirmed by semi-quantitative analysis. We organized the immunohistochemical maps of the complete field of view in Supplementary Fig. 3. We then validated the expression levels of these 9 significantly related phagocytosis regulators based on expression by qRT-PCR in human tissues and cell lines. The primer sequences we used are shown in Supplementary Table 7. The results showed that ACTR3, AXL, CIITA, DOCK2, FCGR2A, FCRL3 were up-regulated in SKCM, and BIN2, CD38, FCGR1B were down-regulated in SKCM (Fig. 11A-I)