A new chemosensor H2L has been designed and synthesized based on an Azo-Schiff base ligand for the selective and sensitive sensing of Co2+ and Al3+ ions. The H2L as fluorescence chemosensor exhibits a linear response toward Al3+ ions in the concentration range of 1.91 × 10− 8 M to 4.8 × 10− 6 M with a limit of detection of 1.91 × 10− 8 M. The chemosensor also displayed high colorimetric sensitivity for Co2+. Fluorescence switch based on the control of EDTA and Al3+ proved H2L could act as a reversible chemosensor. The molecular structure of [NiL] complex has been determined by X-ray crystallography.
Research Article
A new Azo-Schiff base dual-mode chemosensor: Colorimetric detection of cobalt ions and fluorometric detection of aluminum ions in aqueous ethanol solution
https://doi.org/10.21203/rs.3.rs-1624254/v1
This work is licensed under a CC BY 4.0 License
You are reading this latest preprint version
Al3+
Azo-Schiff base receptor
X-ray crystal
Turn-on fluorescence chemosensor
In recent decades, the field of chemosensing has become an interdisciplinary field that consists of researchers from a variety of different backgrounds, including: Inorganic chemistry, analytical chemistry, synthetic organic chemistry, photochemistry, biosciences, physical and materials sciences [1]. Chemosensors have been widely applied for sensing and detection of environmentally and/or biologically important anions, cations, small neutral molecules and biomacromolecules, due to operational simplicity, high sensitivity and selectivity.
Fluorescent and colorimetric chemosensors that detect metal ions have attracted considerable attention due to their wide area of applications [1–4]. Aluminum is the third most abundant of all elements after oxygen and silicon and it is the most abundant metallic element in the earth’s crust (8.1% by weight). Human exposure to aluminium because of widespread use of aluminum in modern society, such as food additives, production of light alloy and medicines. However, exposure to high levels of Al3+ ions can cause serious health problems such as Parkinson’s disease [5] and Alzheimer’s disease [6]. Furthermore, nearly forty percent of the world’s acid soils are exposed by the effects of aluminum toxicity that is the significant factor for hampering plant growth on the acid soils [7, 8]. Co2+ is an essential trace element for human body with significant impact on the processes of haematopoiesis—stimulation of erythropoietin production and haemoglobin synthesis [9]. On the other hand, higher concentrations of cobalt result in toxicological effects, such as cardiomyopathy, vasodilatation and flushing [10, 11].
Therefore, detection of Al3+ and Co2+ is very significant to monitor the concentration level in the environment their direct impact on human health. There are several different types of chemosensors developed for Al3+ and Co2+ detection [12–34] but the chemosensors which can both detect Al3+ and Co2+ are scarcely reported. In this work, an Azo-Schiff base-type Al3+ and Co2+ chemosensor (H2L) was prepared and then its photophysical properties were studied. The studies showed that H2L can be used as a turn-on fluorescence chemosensor for Al3+ and a colorimetric chemosensor for Co2+ in aqueous ethanol solution.
2.1. Synthesis
2.1.1. Methyl-2-{N-(2-aminoethane)}-amino-1-cyclopentenedithiocarboxylate (Hcden)
Hcden was synthesized by literature procedure [35].
2.1.2. (E)-5-((4-chlorophenyl)diazenyl)-2-hydroxy-3-methoxybenzaldehyde
(E)-5-((4-chlorophenyl)diazenyl)-2-hydroxy-3-methoxybenzaldehyde was prepared according to the literature method [35]. A mixture of water (16 mL) and 4-chloroaniline (10 mmol) in hydrochloric acid (36 mL) has been heated. The solution was dropped into an ice-water mixture, and was diazotized with sodium nitrite (10 mmol) dissolved in water (5 mL) between 0 - 5 ˚C. The cold solution of diazo was poured to a solution of 2-hydroxy-3-methoxybenzaldehyde (10 mmol) in water (20 mL) containing sodium carbonate (40 mmol) and sodium hydroxide (10 mmol) during the period of 30 min at 0 ˚C. The product was filtered and washed with solution of NaCl (100 mL, 10% aq.) under vacuum. Finally, the product was dried and the purity of the compound was controlled by TLC (n-hexane:ethylacetate/60:40).
Yield: 73%. m.p 184 ˚C. IR (KBr, cm-1): 3090 ν(O-H)٫ 1666 ν(C=O)٫ 1607 ν(C=C)٫ 1486 and 1590 ν(-N=N-, trans and cis)٫ 1263 ν(C-O)٫ 1123, 1090, 839, 719. 1H NMR δ (500MHz; CDCl3): 11.49 (OH, s), 10.06 (s, CHO), 7.91 (d, 2H, J=7.7300 Hz), 7.50 (d, 2H, J=7.83 Hz), 7.19 (s, 1H), 7.12 (s, 1H), 4.05 (s, -OCH3), Anal. Calc. for C14H11ClN2O3: C, 57.84; H, 3.81; N, 9.64. Found: C, 57.24; H, 3.47; N, 9.51%.
2.1.3 Synthesis of methyl 2-((2-((E)-(5-((E)-(4-chlorophenyl)diazenyl)-2-hydroxy-3-methoxy benzylidene)amino)ethyl)amino)cyclopent-1-enecarbodithioate (H2L)
Azo-Schiff base compound of H2L was prepared by addition of a methanolic solution of Hcden (1 mmol) to (E)-5-((4-chlorophenyl)diazenyl)-2-hydroxy-3-methoxybenzaldehyde (1 mmol) in methanol (20 mL). The solution was stirred for about 20 min The solution stirred for about 20 min and kept at room temperature for about 24 h. The powder was recrystallized from methanol /chloroform (1:1) v/v solution. Yield: 57%. m.p: 197 ˚C. IR (KBr, cm-1): 1640 ν(C=N), 1553 ν(N=N), 1478 (Phenol ring), 1299 ν(C-O), 1129, 873, 853. 1H NMR δ (500 MHz; CDCl3): 14.15 (s, 1H, OH), 12.28 (s, 1H, NH), 8.38 (s, 1H, CH=N), 7.73-7.26 (Phenol ring), 3.39 (s, -OCH3), 3.88 (t, 2H,), 3.82 (t, 2H), 2.63 (m, 6H), 2.46 (s, -SCH3). Anal. Calc. for C23H25ClN4O2S2: C, 56.49; H, 5.15; N, 11.46. Found: C, 56.01; H, 4.87; N, 11.33 %.
2.1.4. synthesis of [NiL] complex
To a solution H2L ligand (1×10⁻⁴ mol) in methanol/ choloform (1:2 v/v) (15 mL), was added a solution of nickel(II) chloride hexahydrate (1×10⁻⁴ mol) in methanol (15 mL). The solution was stirred for 30 min and then was kept at room temperature for 24 h. The resulting product was recrystallized in methanol /chloroform (1:1 v/v) solution. Yield: 50%. IR (KBr, cm-1): 1627 ν(C=N), 1465 ν(Phenol ring), 1284 ν(C-O), 494-564 ν(Ni-N), 438 ν(Ni-O). 1H NMR δ (500 MHz; CDCl3): 7.68 (s, 1H, CH=N), 7-8.46 (Phenol ring), 3.41 (s, -OCH3), 3.79 (t, 2H), 3.65 (t, 2H,), 2.64 (m, 6H), 2.37 (s, -SCH3). Anal. Calc. for C23H23ClN4O2S2Ni: C, 50.62; H, 4.25; N, 10.27. Found: C, 51.12; H, 4.31; N, 10.15%.
2.2. X-ray Crystallography
X-ray data for [NiL] complex were collected at room temperature with a Bruker APEX II CCD area-detector diffractometer using Mo Ka x-ray radiation (k = 0.71073 Å). Other crystallographic data are summarized in Table 1.
|
Table 1. Crystal and structure data for [NiL] |
|
|
Formula |
C23 H23 Cl N4 Ni O2 S2 |
|
Formula weight |
545.73 |
|
Temperature /K |
291(2) |
|
Wavelength λ /Å |
0.71073 |
|
Crystal system |
Monoclinic |
|
Space Group |
P21/c |
|
Crystal size /mm3 |
0.22 x 0.11 x 0.11 |
|
a /Å |
14.206(3) |
|
b /Å |
15.651(3) |
|
c /Å |
19.497(2) |
|
a /° b /° g /° |
90 113.87(3) 90 |
|
Volume / Å3 |
2337.7(8) |
|
Z |
4 |
|
Density (calc.) /g cm-1 |
1.551 |
|
θ ranges for data collection |
2.04-25.50°.. |
|
F(000) |
1128 |
|
Absorption coefficient |
Semi-empirical from equivalents |
|
Index ranges |
-17 ≤ h ≤ 17 |
|
|
-18 ≤ k ≤ 17 |
|
|
-13 ≤ l ≤ 13 |
|
Data collected |
10843 |
|
Unique data (Rint) |
4341, (0.0979) |
|
Parameters, restrains |
300 |
|
Final R1, wR2a (Obs. data) |
0.0695, 0.0647 |
|
Final R1, wR2a (All data) |
0.1805, 0.0830 |
|
Goodness of fit on F2 (S) |
0.947 |
|
Largest diff peak and hole /e.Å-3 |
0.441, -0.387 |
3.1. Synthesis
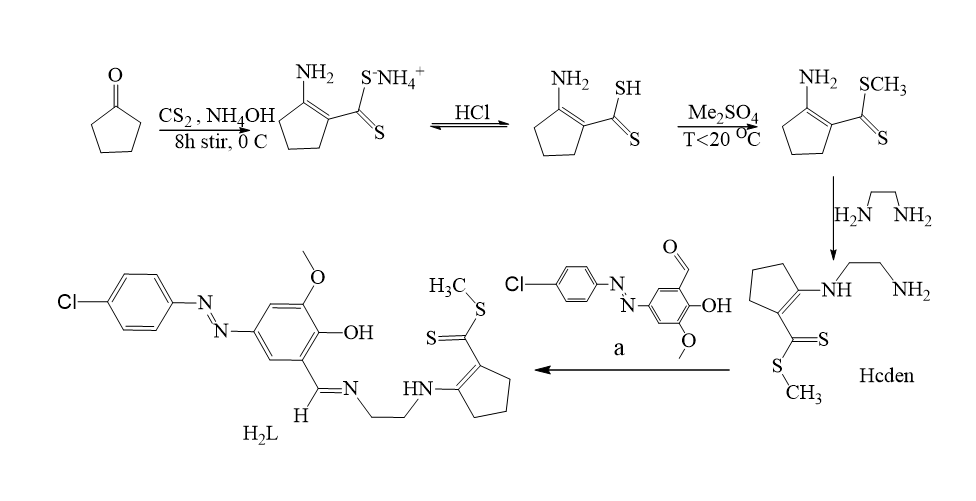
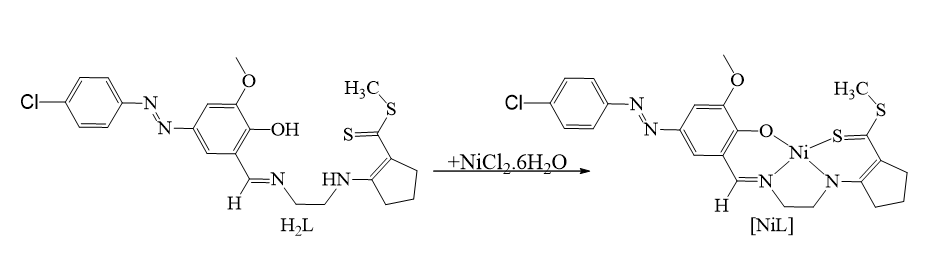
As shown in Scheme 1, The Azo-Schiff base ligand (H2L) can be facilely synthesized according to the literature method [35]. The IR spectrum of H2L shows the imine stretching vibration at 1640 cm-1 as a strong band, while there are no bands that can be attributed to the primary amine and carbonyl groups, indicating that reaction of the aldehyde with the amine has completely occurred. The O-H stretching frequency was not observed due to its involvement in hydrogen bonding (Intra-ligand hydrogen bond) with imine nitrogen atom (O-H…...N). The nickel complex was synthesized by direct reaction between nickel(II) chloride hexahydrate with Azo-Schiff base ligand. The stretching frequency of (C–O) bond shifted to lower frequency (14 cm−1) compared to free ligand. This indicates that the phenolic oxygen atom participates in coordination with nickel ions after losing its proton. The (C=N) stretching frequency in the complex shifted to lower frequency (10 cm−1) compared to the free ligand. This evidence also confirms the participation of imine group in coordination with nickel ions. New vibration bands of 564 and 433 cm−1 assigned to υ(M–O) and υ(M–N) respectively, have been appeared in the spectrum of [NiL].
In the 1H NMR spectrum of H2L, the peak related to imine proton was observed at 8.38 ppm. The related peaks to other groups are matched with the structure of the ligand.
3.2. Structure of [NiL]
Unfortunately, we were not able to obtain the suitable single crystals for the related Al3+ complex. Instead, we obtained suitable crystals for Ni2+ ions. A representation of molecular structure of The [NiL] complex as determined by x-ray diffraction is shown in Fig. 1. Selected angles and bond length are listed in Table 2. The nickel atom is surrounded by two nitrogen atoms, a phenolic oxygen atom and a sulfur atom from the methyl dithiocarboxylate residue. The delocalization of the p-electron density through the six member rings was observed by analysis of the bond length within the metallocyclic part of the complex. A high delocalization of the p-electron density in the cyclopentene fragment were also observed. the mean value for the S1–C15 bond length is 1.693(6) Å and which is considerably lower than what is usually observed for a single S–Csp3 bond, 1.808(10) Å, and similar to the 1.712(17) Å attributed to the S–Csp2 bond in thiophene [33]. Furthermore, in the cyclopentene fragment, the bond length observed between the C10-C14 carbon atoms has a mean value 1.421(7) Å, that is similar to the mean value for the Csp2–Csp2 bond in conjugated systems [36]. Finally, the similarity of the N1-C7 and N2-C10 bond length values is indicative that this fragment coordinates in a Schiff base mode (1.276(7) and 1.309(7), respectively). The complex is tetracoordinated and in a square planar geometry. The degree of the distortion will be quantified by measuring the dihedral angle between planes formed by the N1/Ni/O and N2/Ni/S atoms of the two semi-coordination spheres shows the degree of the distortion that for The complex presents is 0.00°. The plane containing S1, N1, N2, O1 has r.m.s. values of 0.002 Å and the sum of the angles subtended by the donor atoms at Ni(II) for [NiL] is 360°. The nickel atom for [NiL] is close to co-planarity, being only 0.001 Å out of the plane containing S1, N1, N2, O1.
Table 2. Selected bond distance (Å) and bond angles (˚) for [NiL] and related complexes.
|
bond distance |
(Å) |
bond angles |
(˚) |
|
Ni1-O1 |
1.870(4) |
O1-Ni1-S1 |
82.51(12) |
|
Ni1-S1 |
2.1653(17) |
N2-Ni1-S1 |
97.43(16) |
|
Ni1-N1 |
1.867(5) |
N1-Ni1-N2 |
87.3(2) |
|
Ni1-N2 |
1.869(4) |
O1-Ni1-N1 |
92.75(19) |
|
N1-C7 |
1.276(7) |
O1-Ni1-N2 |
179.9(3) |
|
N2-C10 |
1.309(7) |
S1-Ni1-N1 |
175.26(16) |
|
O1-C1 |
1.275(6) |
|
|
|
S1-C15 |
1.693(6) |
|
|
3.3. Spectral properties of fluorescent H2L
It is known that Schiff base ligands are good compounds for fluorescence studies and used to develop the field of chemosensing. The ligand of H2L (10 μM) exhibits a fluorescence emission peak at 419 nm when excited at 252 nm. The fluorophore of the chemosensor consists of a conjugated system and receptor composed of a N2OS donors. The chemosensing ability of H2L was evaluated towards various metal nitrates (K+, Mg2+, Al3+, Sn2+, Hg2+, Cr3+, Fe2+, Fe3+, Mn2+, Co2+, Ni2+, Cu2+, Zn2+, Cd2+ and Pb2+) by fluorescence spectroscopies. The EtOH/H2O (9/1, v/v) mixture was selected as solvent for the titration experiments. The changes in the fluorescence spectra of H2L in the presence of the various metal cations is shown in figure 2.
As shown in Fig. 2, the fluorescence emission intensity of H2L is only increased in the presence of Al3+ ions. the fluorescence emission is completely quenched in the presence of other tested metal ions (K+, Mg2+, Sn2+, Hg2+, Cr3+, Fe2+, Fe3+, Mn2+, Co2+, Ni2+, Cu2+, Zn2+, Cd2+ and Pb2+ ions.
The highest FEF (fluorescence enhancement Factor) for H2L was observed in the presence of Al3+ ions (Fig. 3). The FEF was calculated by using FEF= (Ix- IH2L)/IH2L that IH2L and Ix are the fluorescence intensities of H2L before and after addition of metal ions at 419 nm, respectively. The FEF values of H2L related to different metal ions seen in Fig. 3.
To investigate practical applicability of H2L as a selective fluorescence chemosensor for Al3+ ions, the competition experiments were also performed in the presence of other metal cations (Fig. 4). The results show that the fluorescence emission of [AlL]+ (complex of H2L with Al3+) do not significantly change in the presence of K+, Mg2+, Al3+, Sn2+, Hg2+, Cr3+, Fe2+, Mn2+, Co2+, Ni2+, Zn2+, Cd2+ and Pb2+ + with a concentration up to 100 mM. In the presence of Cu2+and Fe3+ ions had a disturbance under their much excess.
The fluorescence titration of receptor H2L with Al3+ was performed by mixing a constant concentration of H2L with various amounts of Al3+ ions. Figure 5 shows changes of the fluorescence intensity of H2L after the addition of various concentrations of Al3+ ions. The fluorescence emission intensity at 419 nm enhanced gradually along with the increase of concentration of Al3+. It reaches to maximum value when the concentration of Al3+ achieved to 1 equiv, indicating the 1:1 binding of H2L to Al3+ (Fig. 5).
The binding stoichiometry of H2L and Al3+ was studied by the job plot method. The molar ratio was selected by [Al3+]/([ Al3+] + [H2L]) and measured from 0 to 0.9. The entire concentrations were kept at 10 µM. The maximum value was observed when the molar ratio was 0.5 (Fig.6). This means that there is a 1:1 molar ratio for H2L– Al3+ complex in the binding stoichiometry. The fluorescence quantum yields (fc) for the ligand and H2L– Al3+ complex were measured using the ratio method. The values of fc were 0.03013 and 0.14428 for H2L and Al-H2L complex, respectively.
H2L shows a weak fluorescence emission because of existence the PET (photoinduced electron transfer) mechanism and the C=N isomerization. When H2L is exposed in the presence of Al3+ the coordination bonds were formed and PET process and C=N isomerization were stopped, resulting in a significant fluorescence emission.
3.4. Limit of detection and response time
The limit of detection of H2L was calculated using the fluorescence titrations. limit of detection was obtained based on the equation of 3σ/s that s is the slope of the calibration curve and σ is the standard deviation of the blank solution. As shown in figure 7, H2L has a detection limit of 1.91 × 10⁻⁸ M for Al3+. As is well known, the response time is an important matter to obtain an excellent chemical sensor. The response time of the chemosensor was studied by the kinetics of fluorescence enhancement at 419 nm. The experimental results showed that the recognition interaction was completed within 7 s after addition of Al3+. Thus, our fluorescent sensor might be used for the real-time monitoring of Al3+ in practical analysis.
3.5. Binding Constants Measurements
The Benesi–Hildebrand plot was used to calculate the association constant (Ka) for H2L with Al3+at room temperature. The fluorescence titration spectra of H2L (10 µM) were performed in the presence of the various concentrations of Al3+ (0–1.2µM). The emission intensity of fluorescence was gradually increased when various concentrations of Al3+ ions were increased (Fig. 8). As seen in Fig. 8, at concentrations of more than 10µM of Al3+, the fluorescence emission reached to the constant value.

I and I0 represent the fluorescence intensity of H2L in the presence and absence of Al3+ ions, respectively, Imax is the fluorescence emission of H2L in the presence of the excess amount of Al3+.
A linear relationship was observed when emission intensity [1/(I − I0)] was drawn versus a function of 1/[ Al3+] (R2= 0.99). The resulting Benesi–Hildebrand plot, shown in Fig. 8, had a Ka of 1.76 × 10⁶ M−1. The Ka obtained illustrates a strong binding ability of Al3+ with the H2L.
3.6. The chemical reversibility behavior
The chemical reversibility behavior of the binding of H2L and Al3+ was studied. It could be expected that the addition of EDTA will liberate Al3+ from the [AlL]+ complex, releasing H2L, because of the high stability of the EDTA-Al3+ complex. Therefore, excess of EDTA was added to the [AlL]+ complex in buffered solution, which shows a remarkable decrease of fluorescence signal at 418 nm, whereas readdition of excess Al3+ could recover the fluorescence signal (Fig. 9).
These finding show that binding of Al3+ with H2L is chemically reversible, which can be used for the dynamic monitoring of Al3+ in various samples.
The reported LOD values for Al3+ in some of literatures and in the present work have been listed and compared (table 3). As seen in Fig. 3, H2L has suitable situation among the other chemosensors in terms of low LOD value [12-21].
Table 3. The reported LOD values for Al3+ in some of literatures and in the present work
|
Probe |
Medium |
LOD (M) |
Reference |
|
salicylaldehyde hydrazide |
H2O/DMSO |
6.7 ×10⁻⁸ |
12 |
|
Schiff base compounds |
- |
1.1 × 10⁻⁹ |
13 |
|
A tridentate Schiff base |
ethanol |
2.56 × 10⁻⁸ |
14 |
|
2,2’-bipyridyl-3,3’-bis-(N,N’-disalicylidene)-formyhydrazone |
Aqueous solution |
1.7 × 10⁻⁷ |
15 |
|
4-(N,N-Diethylamino)salicylaldehyde moiety |
DMF |
1.2 × 10⁻⁶ |
16 |
|
4-methyl-2,6-bis-(pyrimidin-2-ylimino)methyl)phenol |
aqueous DMSO |
1.27 × 10⁻⁹ |
17 |
|
3–hydroxy-N’-(quinolin-8- ylmethylene)naphthalene-2-carbohydrazide |
aqueous DMSO |
1.22 × 10⁻⁸ |
18 |
|
MOF |
Aqueous solution |
9.52 × 10⁻⁸ |
19 |
|
A Schiff-base molecule (HMPM) |
aqueous DMSO |
1.27× 10⁻⁶ |
20 |
|
N,N′-(1,4-phenylenedimethylidyne) bis-1,4-benzenediamine |
aqueous solution |
2.0 × 10⁻⁶ |
21 |
|
Quinoline-2-carboxylic acid hydrazide |
aqueous solution |
7.6 × 10⁻⁹ |
22 |
|
H2L |
aqueous ethanol |
1.91 × 10⁻⁸ |
Present work |
3.7. Infrared studies
The IR spectrum of H2L shows a band at 1640 cm-1 related to stretching vibration of imine group (Fig. 10). As seen in Fig.10, the imine band of H2L has been shifted to lower frequency 1637 cm-1 in the aluminum complex. This shift can be associated to the coordination of imine nitrogen atom to the metal atom. The coordinate covalent is formed between nitrogen and aluminum by the donation of electrons from C=N bonding orbital to the aluminum atom.
3.8. Molar conductivity measurements
The molar conductivities (Ʌm) of the AL(III) complex in DMF solution at 25 C were found to be in the range 94-105 Ω-1cm2 mol-1. The Ʌm value is in the range reported for 1:1 electrolytes. The [H2L] is coordinated to the Al3+ ions as a doubly negatively charged anions. Therefore, it seems two phenolic OH have been deprotonated and bonded to the aluminums ions.
3.9. colorimetric sensing for Co2+
The colorimetric sensing ability of H2L was investigated in EtOH/H2O (9:1, v/v) upon the addition of a variety of metal ions such as K+, Mg2+, Al3+, Sn2+, Hg2+, Cr3+, Fe2+, Fe3+, Mn2+, Co2+, Ni2+, Cu2+, Zn2+, Cd2+ and Pb2+. The changes in the UV–Vis spectra of H2L in the presence of the various metal cations is shown in Fig. 11. The prominent band appearing at around 350 nm is because of electron migration along the entire conjugate system of the ligand. The entire conjugate system is consist of both azo group and the aryl rings. For azomethine or azo dyes that a hydroxyl group is in opposition to the N-N or C-N bond on the aromatic ring the intramolecular CT band is generally broadness [37]. The band observed at around 470 nm can be assigned to an n-π* electronic transition of azo-aromatic chromophore [37,38]. When Co2+ was added, the major absorption peak at 350 was red shifted to 390 nm and a new peak at 530 nm was generated in the visible region (Fig.12). However, no such change for H2L in the presence of other test metal cations was observed (Fig. 11). Consistent with the spectral changes, the color of H2L solution changed from intense yellow to pale yellow on addition of Co2+. The noteworthy visible color change indicated that the compound H2L could serve as a potential candidate of a “naked-eye” chemosensor for Co2+.
3.10. Application
H2L can be used as a fluorescence probe for measuring of Al3+ concentration in drinking water.
As seen in table 4, the results were agreeing and satisfactory with AAS (atomic absorption spectroscopic) method. The relative errors were less than 6.6%.
Table 4. Determination of Al3+ concentration in drinking water samples.
|
Drinking waters |
AAS method (mg/L) |
Proposed method (mg/L) |
Relative error (%) |
|
Mineral water |
5 ± 0.08 |
5.2 ± 0.08 |
4.0 |
|
Tap water |
3 ± 0.11 |
3.2 ± 0.11 |
6.6 |
3.11. Logic gate operation
H2L molecule can be perform as a molecular logic gate switch based on fluorescence emission as output and metal ions as input. The inputs were selected as Al3+ ions (input1) and Cu2+ ions (input 2) and the fluorescence emission intensity at 419 nm was selected as the output. When H2L was exposed to Al3+ (input 1), The fluorescence emission intensity was increased at 419 nm. The fluorescence emission intensity was completely quenched, upon addition of Cu2+ (input 2, in the presence of Al3+. The fluorescence band of H2L was also disappeared when titration was carried out with Cu2+ alone. As discussed above, the fluorescence emission intensity is high enough (output 1= 1) only under the addition of Al3+ (input 1 = 1 and input 2 = 0). According to the truth table of Fig. 13, the fluorescence responses of H2L satisfy the INHIBIT type logic gate function at the molecular level with the two chemical inputs Al3+ and Cu2+.
In conclusion, a new fluorescent turn-on chemosensor was added into the library of Al(III) selective chemosensors. This Azo-Schiff base receptor detects Al(III) in the aqueous ethanolic medium by giving significant fluorescent enhancement at 419 nm due to the photo-induced electron transfer (PET) and the C = N isomerization mechanism. The association constant of the [H2L-Al3+] complex is 1.76 × 10⁶ M− 1. The lower detection limit of Al3+ is 1.91 × 10− 8 M and indicate on suitable situation of H2L among the other chemosensors in terms of low LOD value. The chemosensor also displayed high colorimetric sensitivity for Co2+ ions. Molecular logic gates INHIBIT is proposed using Al3+ and Cu2+ as inputs.
5. Supplementary data
CCDC 831282 contains the supplementary crystallographic data for [NiL] complex. These data can be obtained free of charge via http://www.ccdc.cam.ac.uk/conts/retrieving.html, or from the Cambridge Crystallographic Data Centre, 12 Union Road, Cambridge CB2 1EZ, UK; fax: (+44) 1223-336-033; or e-mail: [email protected].
Acknowledgment
The authors gratefully acknowledge the Facultyof Chemistry of Bu-Ali SinaUniversity and Ministry of Science Research and Technology.
Author Declarations
Author Contributions Reza Azadbakht and Mostafa Koolivand performed collection of absorption/emission spectra, data analysis, and writing original draft. Naemeh Chidan developed the methodology for synthesis. Saeid Menati synthesized the compounds.
Conflict of Interest All authors, including Reza Azadbakht, Naemeh Chidan, Saeid Menat and Mostafa Koolivand, declare no conflict of interest.
Funding No funding was received for this study.
Ethical Approval This article does not contain any studies with human or animal subjects.
Consent to Participate Not applicable.
Consent for publication Not applicable.
Data Availability All data generated or analyzed during this study are included in this published article.
- A.P. de Silva, H.Q.N. Gunaratne, T. Gunnlaugsson, A.J.M. Huxley, C.P. McCoy, J.T. Rademacher, T.E. Rice, Chem. Rev. 97 (1997) 1515.
- B. Valeur, I. Leray, Coord. Chem. Rev. 205 (2000) 3.
- S.H. Kim, H.S. Choi, J. Kim, S.J. Lee, D.T. Quang, J.S. Kim, Org. Lett. 12 (2010) 560.
- Y.C. Hsieh, J.L. Chir, H.H. Wu, C.Q. Guo, A.T. Wu, Tetrahedron Lett. 51 (2009) 109.
- D.P. Perl, D.C. Gajdusek, R.M. Garruto, R.T. Yanagihara, C.J. Gibbs., Science 217 (1982) 1053-5.
- D.P. Perl, A.R. Brody,Science, 208 (1980) 297-9.
- E. Álvarez, ML. Fernández-Marcos, C. Monterroso, Ecol. Manag. 211 (2005) 227-39.
- J. Barceló, C. Poschenrieder, Environ Exp Bot, 48(2002) 75-92.
- P. Maxwell, K. Salnikow, Cancer Biology and Therapy. 3(2004) 29–35,
- H. Tavallali, G.D. Rad, A. Parhami, S.Z. Mousavi, J. Photochem. Photobiol. B 125 (2013) 121–130.
- K. Jomovaa, M. Valko, Toxicology 283 (2011) 65–87
- D. Xiu, J. Shi, M. Deng, H. Song, Z. Hao, Q. Feng, H. Yu, J. Mol. Struct., 1243 (2021) 130761.
- Y-Y. Huang, F-X. Wang, S-Y. Mu, X. Sun, Q-Z. Li, C-Z. Xie, H-B. Li, Spectrochim. Acta A Mol. Biomol. Spectrosc., 243 (2020) 118754.
- N. Kshirsagar, R. Sonawanea,, P. Patil, J. Nandreb, P. Sultan, S. Sehlangia, C. P. Pradeep, Y. Wang, L. Chen, S.K. Sahoo, Inorganica Chim. Acta 511 (2020) 119805.
- Y-Y. Guo, L-Z. Yang, J-X. Ru, X. Yao, J. Wu, W. Dou, W-W. Qin, G-L. Zhang, X-L. Tang, W-S. Liu, Dyes Pigm., 99 (2013) 693-698.
- M. Kumar, A. Kumar, S. Kishor, S. Kumar, A. Kumar, N. Manave, A.K. Bhagi, S. Kumar, R. P. John, J. Mol. Struct., 1247 (2022) 131257.
- A, Hazra, P, Roy, Inorg. Chem. Commun., 130 (2021) 108694.
- Y. Ding, C. Zhao, P. Zhang, Y.Chen, W. Song, G.Liu, Z. Liu, L. Yun, R. Han, J. Mol. Struct. 1231 (2021) 129965.
- S. Bhowal, A. Ghosh, RSC Adv., 2021, 11, 27787-27800.
- A. Hazra, P. Roy, Inorg. Chem. Commun., 130, 2021, 108694.
- J-Q.Wang, L. Huang, L.Gao, J. H. Zhu, Y. Wang, X. Fan, Z. Zou, Inorg. Chem. Commun., 11 (2008) 203-206.
- R. Purkait, C. jitPatra, A. D. Mahapatra, D. Chattopadhyay, C. Sinha, Sens. Actuators B Chem., 257 (2018) 545-552.
- K. Rout, A. K. Manna, M. Sahu, G. K. Patra, Inorg. Chim. Acta, 486 (2019) 733-741.
- M. S.Kim, T. GeunJo, M. Yang, J. Han, M. H. Lim, C. Kim, Spectrochim. Acta. A Mol. Biomol. Spectrosc. 211 (2019) 34-43.
- V.Raju , R. Selva Kumar, Y. Tharakeswar, S. K. Ashok Kumar, Inorg. Chim. Acta, 493 (2019) 49-56.
- R. Azadbakht, M. Koolivand, J. Khanabadi, Anal. Methods, 9 (2017) 4688-4694.
- L.K. Kumawat, N. Mergu, M. Asif, V.K. Gupta, Sens. Actuators B chem, 231 (2016) 847-859.
- R.D. Beremenn, M.R. Churchill, G. Shields, Inorg. Chem. 18 (1979) 3117.
- R.D. Beremenn, J.R. Dorfmann, J. Bordener, D.P. Rillema, P. McCarthy, G.D. Shilds, J. Inorg. Biochem. 16 (1982) 47.
- A.D. Garnovskii, A.L. Nivorozhkin, V.I. Minkin, Coord. Chem. Rev. 126 (1993) l-69.
- S, K. Sahoo, Dalton Trans., 50 (2021) 11681-11700.
- S, K. Sahoo, New J. Chem., 45 (2021) 8874-8897
- T. Anand, S.K. A. Kumar, S. K. Sahoo, Spectrochimica Acta A, 204 (2018) 105-111.
- V. Bhardwaj, S. Bothra, Y. Upadhyay, S. K. Sahoo. ACS Applied Nano Materials, 4 (2021) 6231-6238.
- S. Menati, A. Azadbakht, R. Azadbakht, A. Taeb, A. Kakanejadifard, Dyes and Pigments 98 (2013) 499-506.
- F.H. Allen, O. Kennard, D.G. Watson, G. Orpen, L. Brammer, R. Taylor, J. Chem. Soc., Perkin Trans. 2 (1987) S1.
- A.M. Khedr, M. Gaber, R.M. Issa, H. Erten, Dyes Pigm. 67 (2005) 117-26.
- X. Chen, J. Zhang, H. Zhang, Z. Jiang, G. Shi, Y. Li, Dyes Pigm. 77 (2008) 223-8.
Scheme 1-2 are available in Supplementary Files section.
No competing interests reported.
- checkcif1.pdf
- scheme1.png
Scheme 1. Synthesis route for the azo-dye ligand H2L
- scheme2.png
Scheme 2. Procedure for syntheses of [NiL]