Patients
Contralateral primary breast tumor and adjacent normal breast tissues of 285 breast cancer patients receiving surgical resection were acquired from Changhua Show Chwan Memorial Hospital from March 2011 to January 2017. Computed tomography (CT) was applied for the diagnosis in the 285 breast cancer patients prior to surgery. The diagnosis parameters and clinical outcomes were recruited until patient death or loss to follow-up. In the study, donor records were obtained from the Cancer Registry of Changhua Show Chwan Memorial Hospital. All personal identification information had been deleted and anonymized before we accessed the records, and personal privacy was under protection against using these data. The age of all patients was between 29 and 95 years old (mean ± SD: 54.88 ± 12.32 years). Clinical parameters and survival data were recorded from the cancer registry system of Changhua Show Chwan Memorial Hospital, which is anonymously linked to the Taiwan Cancer Registry (http://www.iacr.com.fr/). The variables included age, gender, tumor size, N (lymph nodes), m (metastasis), stage, ER, PR, HER2 status, Ki67, date of operation, diagnosis, death, etc. Survival data was annotated to be the time from the date of primary surgery to the date of death. During this survey, 29 patients died and 52 patients exhibited tumor metastasis. The metastasis sites included the skin, abdomen, pleura, bone, lung, liver, chest wall, breast, and lymph node. The median overall survival time of all breast cancer patients was 1440 days. This project was approved by the Ethics Committee of the Institutional Review Board of Show Chwan Memorial Hospital (IRB No. 1060407).
Immunohistochemistry and scoring
For each patient, representative tissue cores of the breast tumor section, as well the adjacent normal section, were carefully collected and made into tissue microarrays. Immunohistochemistry (IHC) staining was used to evaluate IL-6 and DNMT1 protein expression. The IL-6 antibody (GenTex GTX110527) and DNMT1 antibody (GenTex GTX116011) was purchased from GenTex (Alton Pkwy Irvine, CA 92606 USA). IHC evaluation and protocol used to obtain score have been descripted previously [8, 24]. The average signals of the scores were evaluated independently by two pathologists that were blinded when judging the slides. Immunostaining scores were defined as the cell staining intensity (0 = none, 1 = weak, 2 = moderate, and 3 = strong) multiplied by the percentage of labeled cells (0% to 100%), leading to scores from 0 to 300. The IHC staining median score was used as the cut-off point for the dichotomization of IL-6 and DNMT1. A score more than the median was recognized as “high” immunostaining, whereas a score less than or equal to the median was recognized as “low”.
Web Server Survival Analysis
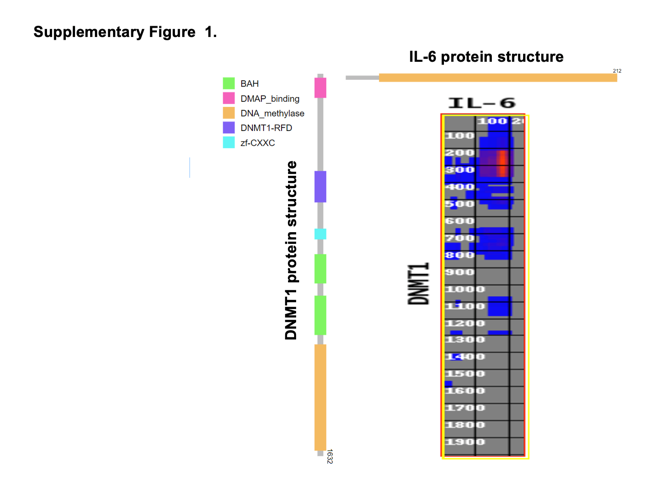
The correlation of expression of IL-6 and DNMT1 mRNA in breast cancer patients was calculated using Pearson’s correlation using data at GEPIA at http://gepia2.cancer-pku.cn/#index. The association between DNMT1, IL-6 and tumor immune microenvironment were explored via the Tumor Immune Single-cell Hub (TISCH), a single cell RNA sequencing
(scRNA-seq) database focusing on tumor microenvironment. TISCH provides detailed cell-type annotation at the single-cell level, enabling the exploration of TME across different cancer types at http://tisch.comp-genomics.org.
Cell culture
The human breast cancer cells, MDA-MB-453 and SKRB3 (ATCC, Gaithersburg, MD, USA), were cultured in Dulbecco's modified Eagle's medium (DMEM) supplemented with 10% FBS (HyClone, Logan, UT, USA) and maintained in a humidified incubator with 5% CO2 at 37°C.
Western blot analysis
After cells were harvested, protein was quantified using a BCA assay kit (Pierce, Rockford, IL, USA, Winnebago). The cells were harvested using a curet and centrifuged at 1,000 × g for 10 min at 4°C and then lysed in ice-cold radioimmunoprecipitation assay (RIPA) lysis buffer (Thermo Scientific company, USA) with 100 µL protease inhibitor cock-tail (Roche, San Francisco, USA). Equal amounts of protein (30 µg) were separated by SDS-PAGE (10% gel) and subsequently transferred to a polyvinylidene difluoride mem-brane [19]. Subsequent to blocking with 5% skimmed milk at room temperature for 1 h, the membranes were incubated at 4°C overnight with primary antibodies, including anti-IL-6 (1:1,000, GTX110527, GeneTex), anti-GAPDH (1:5000, GTX100118, GeneTex), anti-DNMT1 (1:1,000, GTX116011, GeneTex), followed by incubation at room temperature for 2 h with HRP-conjugated polyclonal secondary antibody (1:5,000, GTX213110-01/GTX213111-01, GeneTex) [55]. All western blots were visualized using the enhanced plus chemiluminescence assay kit (EMD Millipore, Billerica, MA, USA), ac-cording to the manufacturer's protocol. Protein expression levels in cells were quantified by ImageJ software (https://imagej.nih.gov/ij/).
Transwell invasion assay
For invasion assay, cells were treated with 10 ng/mL human recombinant IL-6 or 10 µg/mL anti-IL-6 monoclonal antibody, the referenced concentration as previous described [10]. Cell invasion was determined using Matrigel invasion chambers with a pore size of 8 μm (Costar, Corning Life Sciences, Cambridge, MA, USA). Briefly, MDA-MB-453 and SKRB3 (4×10⁴ cells per chamber) in serum-free medium were seeded in the upper chamber, and 10% fetal bovine serum (Gibco, Thermo Fisher Scientific, Inc.) was used as a chemoattractant in the bottom well. After incubation for 24 h at 37°C, the non-invasive cells on the upper surface of the membrane were removed with a cotton swab, and the invasive cells on the bottom side were fixed in 100% methanol at room temperature for 5 min, stained with 1% crystal violet at room temperature for 10 min and counted using a microscope (Nikon Eclipse 80i, Nikon Corporation Tokyo, Japan) under ×200 magnification with five fields of view per cells [23].
Statistical analysis
The association between IL-6 and DNMT1 protein expression and the clinical and pathological parameters was calculated using a Chi-squared test, and Pearson’s correlation was used for the association between IL-6 and DNMT1 protein expression. Survival curves were plotted using the Kaplan-Meier model and compared using a log–rank test. Additionally, Cox’s proportional hazards regression model was used to analyze the associations between age, stage, ER, PR, Ki67, IL-6 and DNMT1, and survival data, and p < 0.05 was considered to indicate a statistically significant difference. SPSS 18.0 software (SPSS, Inc., Chicago, IL, USA) was used for all statistical analyses.