RNA‑seq and DEG analysis of A192-1, YL-1 and YF-2 petals
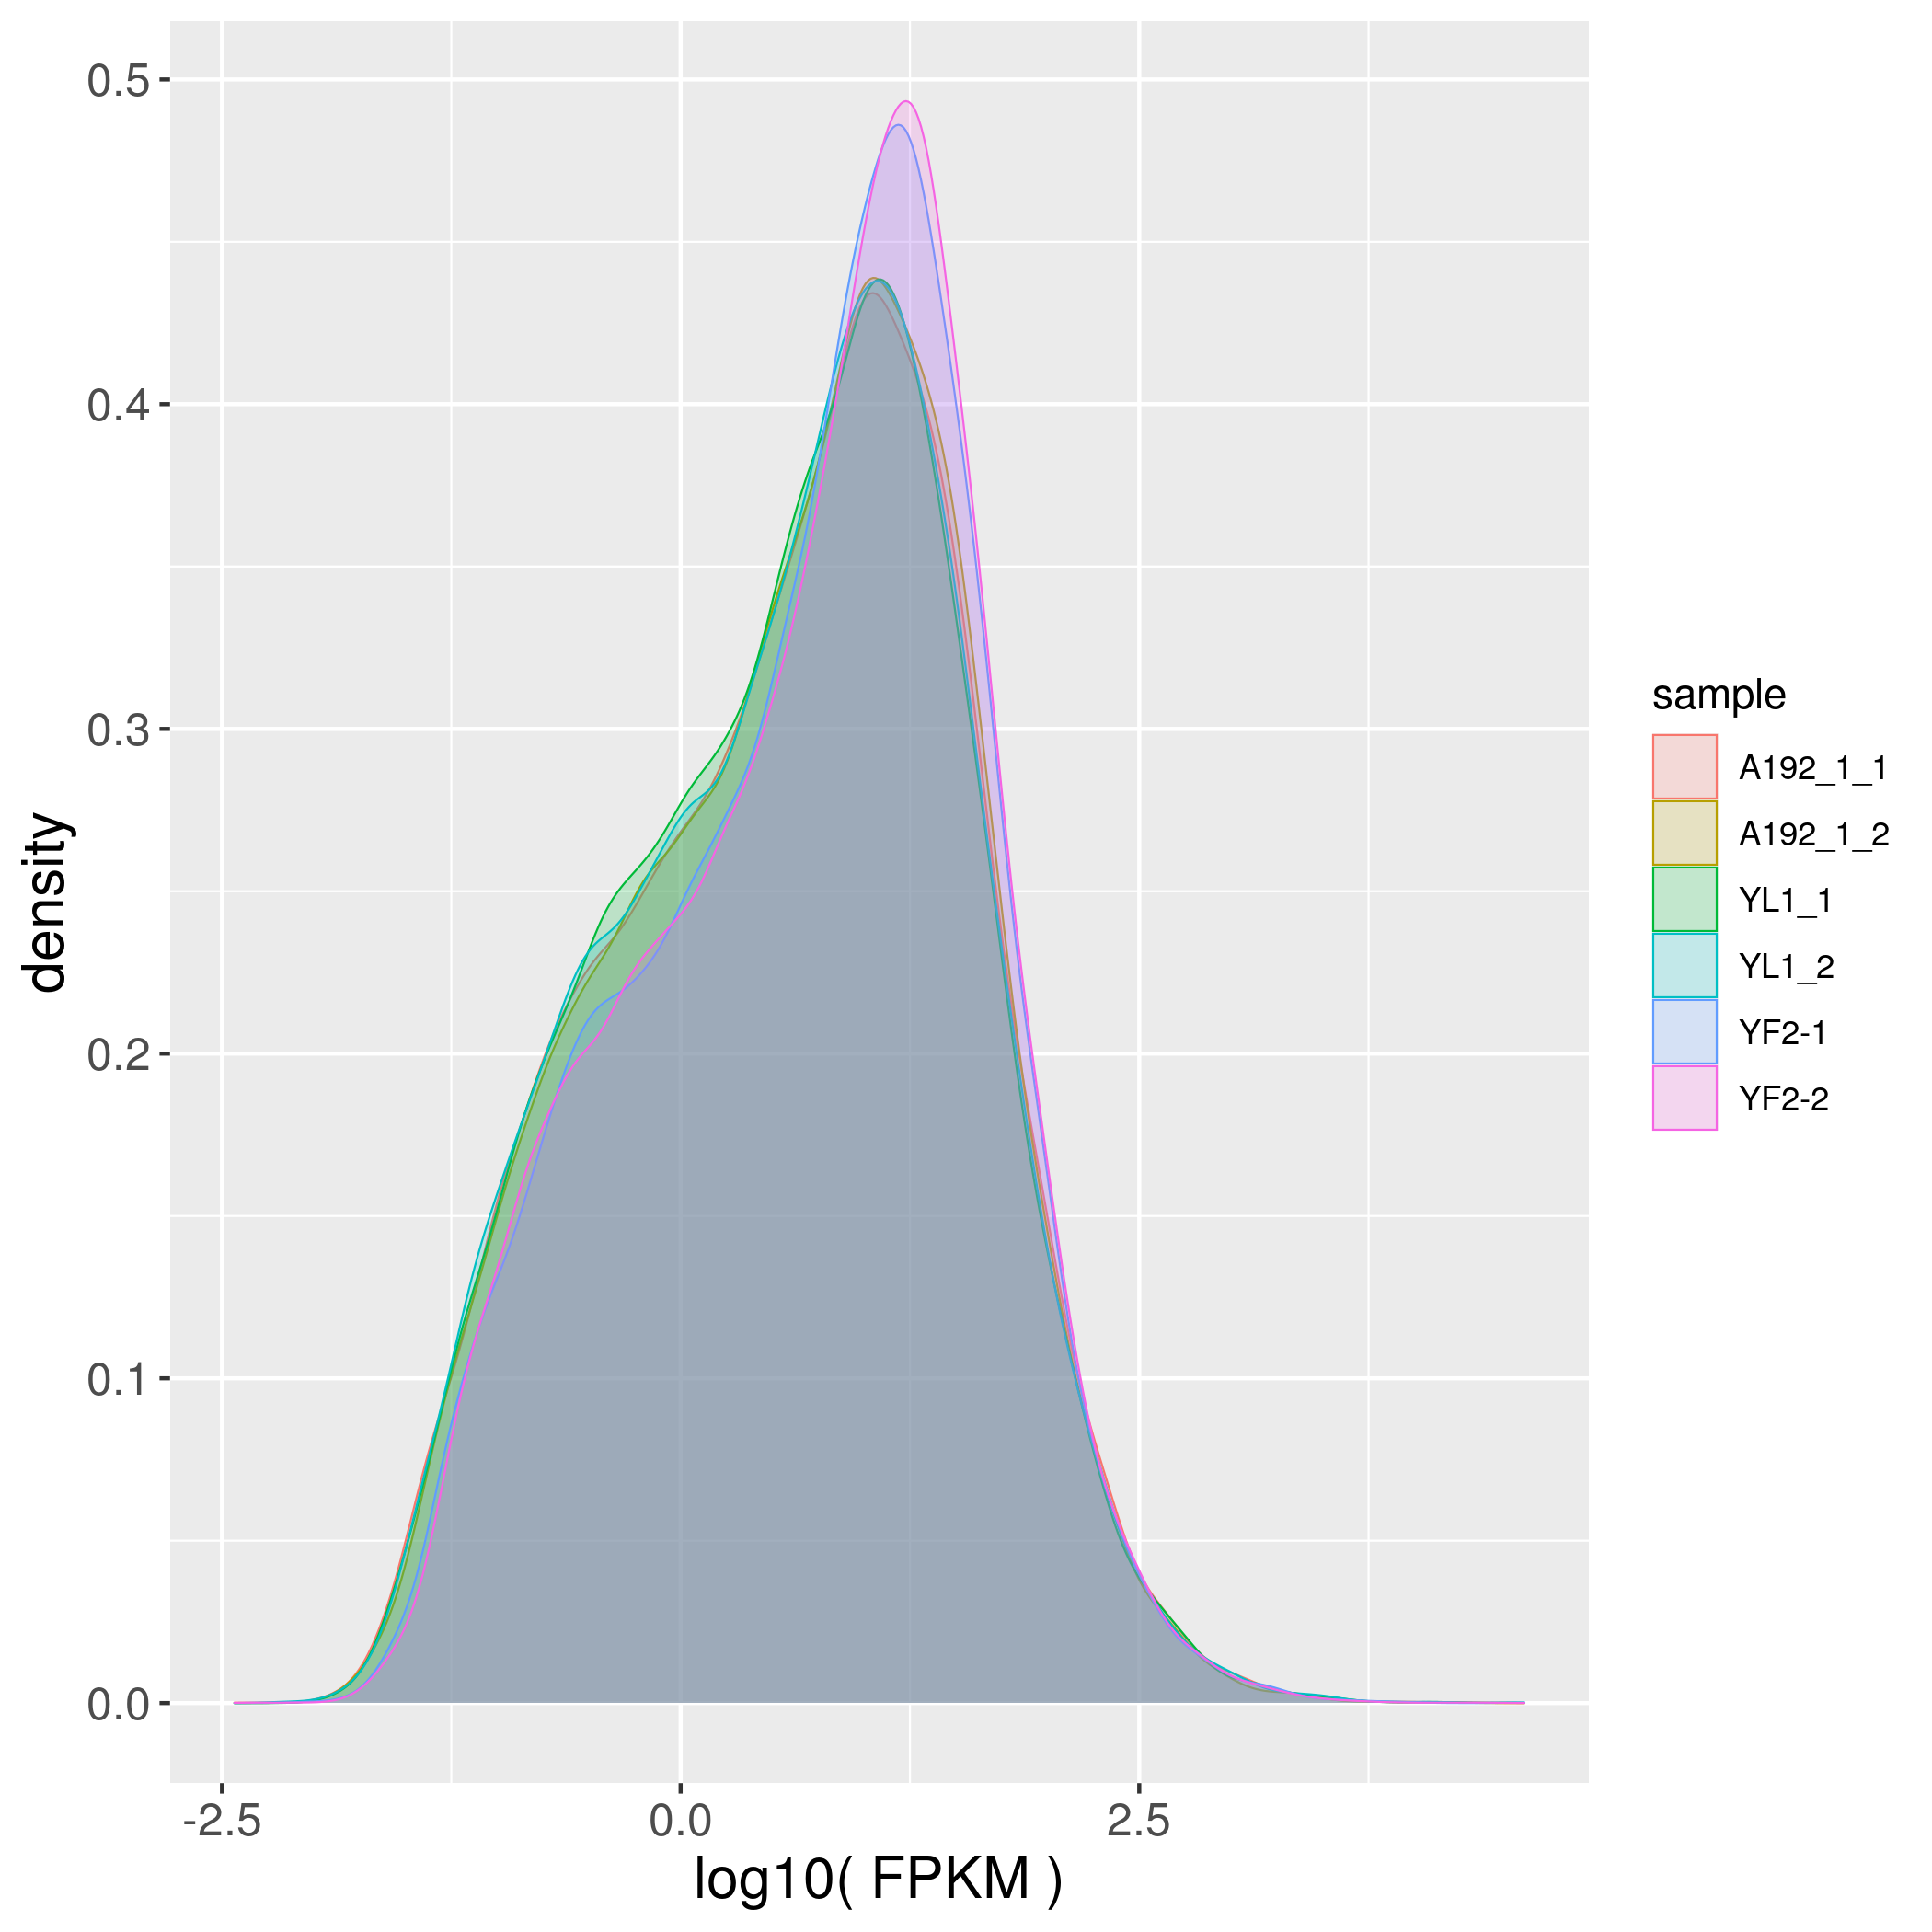
Six cDNA libraries of petal samples of A192-1 (white petals’ Fig. 1a), YL-1 (yellow petals’ Fig. 1b) and YF-2 (white petals; Fig. 1c) were sequenced to obtain DEGs. After removing adaptor sequences, low-quality reads and ambiguous reads, 88.72 (A192-1), 87.60 (YL-1) and 76.57 (YF-2) million clean reads were obtained, and all the Q30 values were > 92%. The clean reads were then mapped to the B. oleracea TO1000 reference genome (http://plants.ensembl.org/Brassica_oleracea/Info/Index). All the total mapping percentages were > 88% (Table 1), and the density distribution and boxplots of all the genes exhibited similar patterns among the six samples, indicating that the transcriptome sequencing data were reliable for further analysis (Supplementary Fig. S1).
Table 1
Overview of the transcriptome sequencing dataset
| Samples | A192-1-1 | A192-1-2 | YL-1-1 | YL-1-2 | YF-2-1 | YF-2-2 |
| Raw reads | 49,470,348 | 47,645,834 | 45,147,382 | 49,510,444 | 41,944,966 | 40,739,642 |
| Clean bases | 45,118,684 | 43,601,476 | 41,801,266 | 45,799,878 | 38,837,852 | 37,736,246 |
| Q20 (%) | 97.55 | 96.63 | 97.55 | 97.43 | 96.80 | 97.10 |
| Q30 (%) | 94.38 | 92.55 | 94.24 | 93.98 | 92.41 | 92.98 |
| Total mapped reads (%) | 92.16 | 91.38 | 89.74 | 89.68 | 88.51 | 88.35 |
| Uniquely mapped reads (%) | 96.49 | 97.12 | 97.41 | 97.28 | 95.95 | 96.42 |
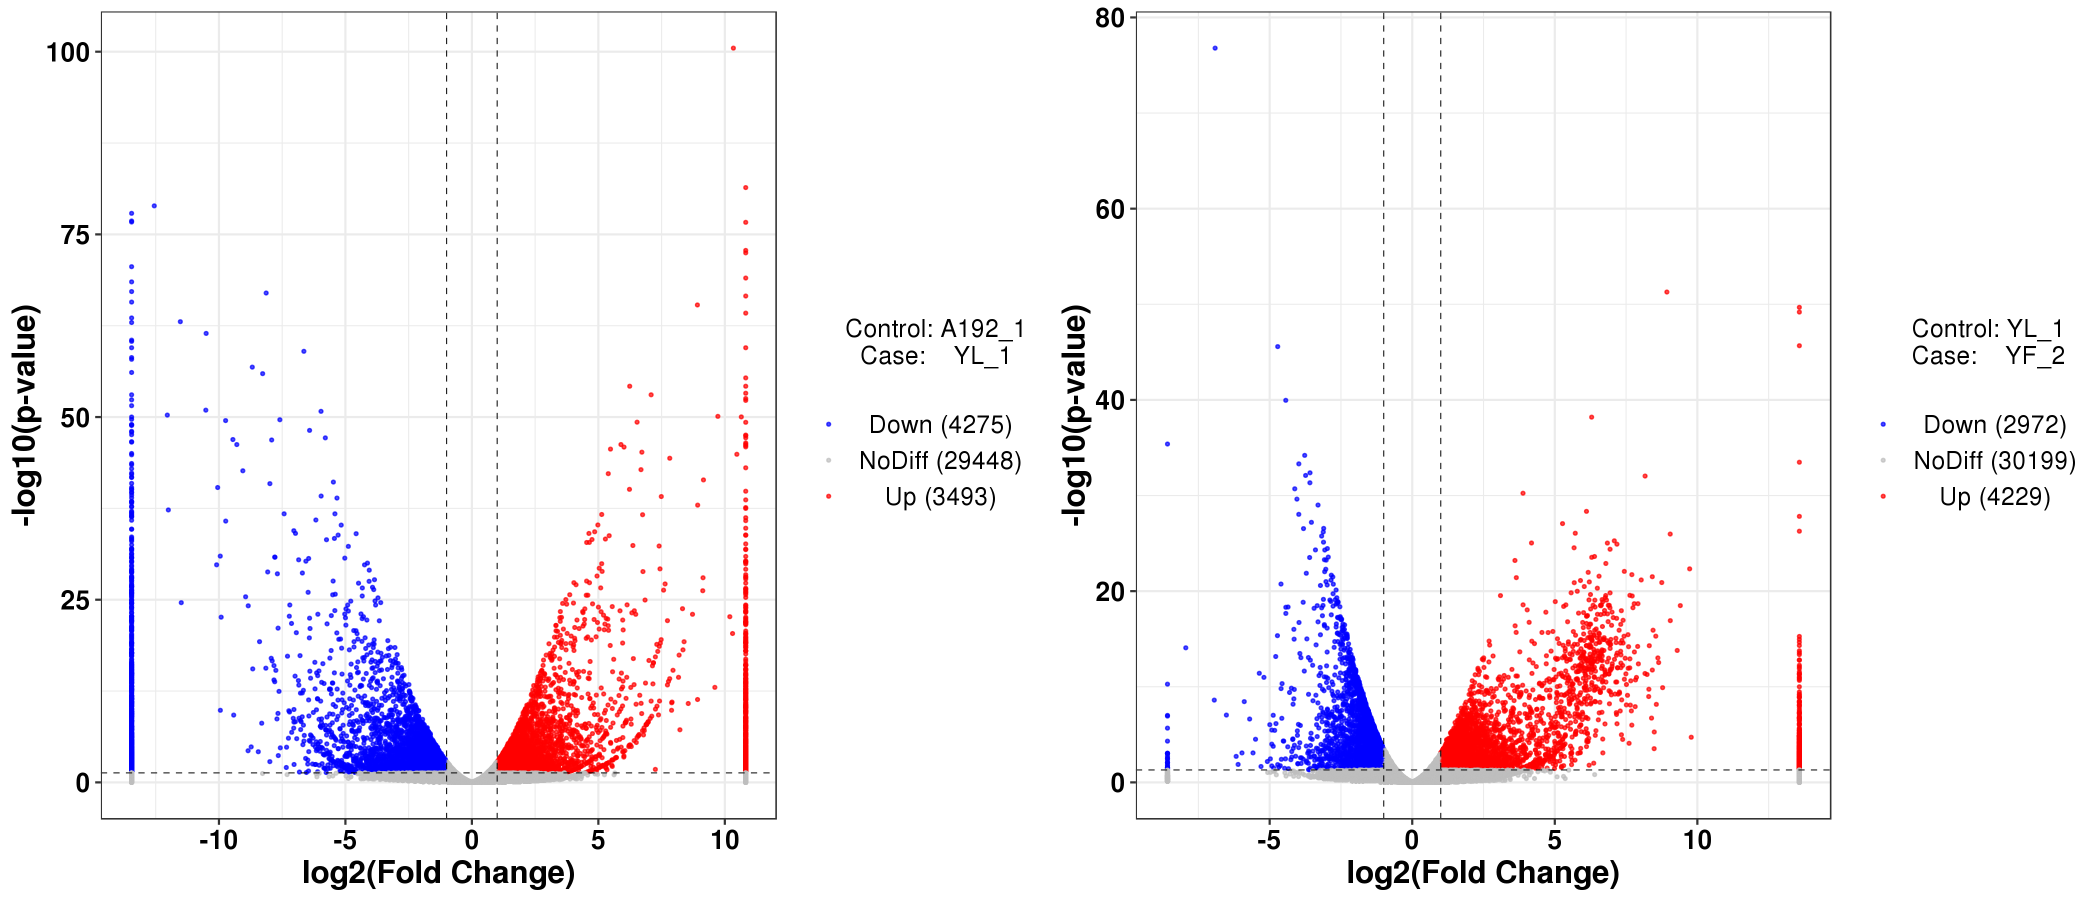
In total, 7768 (3493 up- and 4275 down-regulated) and 7201 (4229 up- and 2972 down-regulated) DEGs were detected in the A192-1 vs. YL-1 and YL-1 vs. YF-2 comparison groups, respectively (Supplementary Fig. S2). Venn diagram analysis revealed that 1928 DEGs were common to the A192-1 vs. YL-1 and YL-1 vs. YF-2 comparisons (Fig. 2), including 1026 up-regulated and 902 down-regulated genes in the A192-1 vs. YL-1 comparison group and 964 up-regulated and 964 down-regulated genes in the YL-1 vs. YF-2 group (Supplementary Table S2), indicating that these genes may be strongly related to petal color formation in cabbage.
GO and KEGG pathway enrichment analysis of DEGs
The DEGs were classified into three GO categories: biological process (BP), cellular component (CC), and molecular function (MF) categories. The top 20 enriched terms were identified in each comparison group. The most significantly enriched terms were small-molecule metabolic process (BP), structural constituent of ribosome (MF), chloroplast (CC) and plastid (CC) in the A192-1 vs. YL-1 and YL-1 vs. YF-2 comparison groups (Fig. 3a). KEGG analysis was subsequently performed to uncover the important biological functions of the DEGs, and the top 20 enriched pathways were identified in each comparison group. Ascorbate and aldarate metabolism was the most significantly enriched pathway in both the A192-1 vs. YL-1 and YL-1 vs. YF-2 comparison groups. In addition, ribosome and methane metabolism, fatty acid degradation and carotenoid biosynthesis were the most highly enriched pathways in the A192-1 vs. YL-1 and YL-1 vs. YF-2 comparison groups (Fig. 3b).
Expression analysis of DEGs involved in the carotenoid biosynthetic pathway
The carotenoid biosynthetic pathway has been thoroughly characterized16-18. Thirty-three homologous genes involved in the carotenoid biosynthetic pathway were identified in B. oleracea, of which 10 (six up- and four down-regulated), and 18 (15 up- and three down-regulated) were significantly differentially expressed in the A192-1 vs. YL-1 and YF-2 vs. YL-1 comparison groups, respectively (Fig. 4; Supplementary Table S3). Among these DEGs, only BoNCED4.2 (BoCCD4) and BoAAO3 were significantly up-regulated in both A192-1 and YF-2 petals; this was especially true for BoCCD4, which showed abnormally high expression in the white petals (Fig. 4), indicating that BoCCD4 may interact with BoAAO3 to jointly regulate carotenoid biosynthesis in cabbage petals.
Identification of key transcription factors related to the carotenoid metabolic pathway
A previous study reported that members of the MYB, SBP, bHLH, NAC, WRKY, HD-ZIP and MADS-box TF families are the major regulators of carotenoid metabolism-related genes19. The top 20 significantly differentially expressed genes encoding TFs were then analysed in the YL-1 vs. A192-1 and YL-1 vs. YF-2 comparison groups. Among these TF-encoding genes, only Bo2g151880 (WRKY) and Bo3g024180 (SBP) were significantly up-regulated in both A192-1 and YF-2 petals consistent with the expression pattern of BoCCD4 (Supplementary Table S4), indicating that these genes may regulate carotenoid metabolism by regulating BoCCD4 gene expression.
qRT‑PCR validation of key DEGs
The expression patterns of two key enzymes, BoCCD4 and BoAAO3, and two key TFs, Bo2g151880 and Bo3g024180, related to the carotenoid metabolic pathway in 11-192, YL-1 and YF-2 petals were verified via qRT–PCR. All the genes showed significantly higher expression levels in the white petals compared with the yellow petals, which is consistent with the transcriptome results; this was especially true for the BoCCD4 gene, whose expression was barely detected in the yellow petals (Fig. 5).