Model approach
Comparing the use of a machine learning approach (random Forests) to gain additional insights into indicator-indicandum relationships and intercorrelation within indicator sets in comparison to e.g., linear regression with forward selection, we see following main advantage for ecological science: (i) no assumptions about linear relationships are needed, (ii) a possible collinearity of variables does not affect model predictions negatively and (iii) stable prediction results in terms of the Out-Of-Bag error. The disadvantages of random Forests are that (i) outcomes are more challenging to interpret, (ii) direction of statistic relation is unknown, and (iii) collinearity might affect %IncMSE, are clearly outweighed in our case study. The package random Forest explainer proved to be a useful tool to interpret the model outcomes.
Validity of most indicators used is weakly scientifically supported (Gao et al. 2015). A biodiversity indicator is found to be more useful the more precise the correlation with the indicandum is known (Heink and Kowarik 2010). Yet, indicator-indicandum relationships are poorly understood and tested across habitat and scales (Gao et al. 2015). Our case study shows, how random Forest can be applied for the indicator validation urgently needed on large spatial scales (Ferris and Humphrey 1999; Gao et al. 2015) considering intercorrelated data and indicators sets.
Indicator-indicandum relationships
The Clark & Evans-index (C & E)
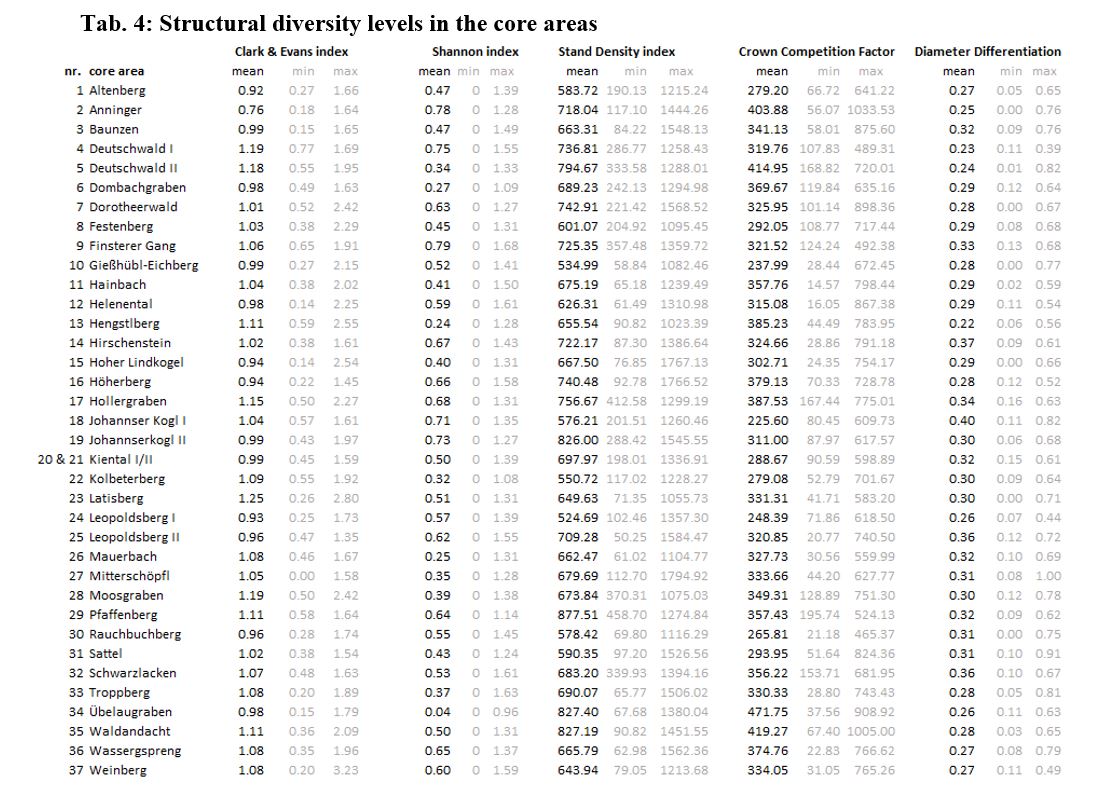
Actual C & E levels in the unmanaged core areas of the BR Vienna Woods range between 0.76 (´Anninger´) and 1.25 (´Latisberg´). In the core area ´Anninger´, trees are evenly arranged, while stem distribution in ´Latisberg´ already evolved towards a more clustered spatial structure. Comparable C&E levels to ´Latisberg´ were found in a 53-year-old pure European Beech stand in Germany (Pommerening 2002). Older stands tend to have lower stem numbers and clumped structure, while young stands are often found to be evenly arranged (Pretzsch 2002; Dieler 2013). Even if mean stand age only differs about 20 years between two core areas, ´Latisberg´ displays twice the amount of living stock volume and half the number of trees per hectare. In line with Pretzsch (2002) and Dieler (2013), this points towards a more mature successional state of ´Latisberg´ which is indicated by C & E.
In unmanaged forests, structural complexity, and diversity significantly increase with stand age, denoted by enhanced levels of lying and standing deadwood and natural regeneration (Pretzsch 2002). In line with the findings of Pretzsch (2002) all these variables (cwd, swd, regen) are very well indicated by C & E in our case study. C & E indicates the variable category ´vertical structure´ very well. Moreover, our results underline a profonde indication of the category ´age & density´.
C & E was found to indicate horizontal distribution as a proxy for resource partitioning of light use among species (Kohyama 1993; Yachi and Loreau 2007; Álvarez-Yépiz et al. 2017; Atkins et al. 2018), the size and distribution of gaps (Neumann and Starlinger 2001) and processes such as mortality, ingrowth, and competition (Svensson and Jeglum 2001). Therefore, it is highly plausible that the variable indicated best by C& E in our case study is ´stem density´. C & E shows particularly low statistical relation to other structural diversity indicators.
The Shannon index (H´)
Shannon index levels varies between 0.04 (´Übelaugraben´) and 0.79 (´Finsterer Gang´). Comparable index levels were described for pure European Beech forest (H´= 0.09) and oak-beech mixed forest (H´= 0.62) in Germany (Pommerening 2002). Rare species increase H´ disproportionately, while common species affect it under proportionately (Pretzsch 2002). Overall, the Shannon index indicates the highest number of variables. Moreover, the category ´vertical structure´ and the variable ´dominant tree species´ are predicted best by the Shannon index. This is supported by scientific literature in which the Shannon index is expected to indicate tree species abundance and diversity and is considered as a proxy for the number of niche spaces filled by different tree species (Turnbull et al. 2016), habitat quality or biotope trees (Heym et al. 2021), diversity of microhabitats (Larrieu et al. 2014), and habitat types (Kovac et al. 2020) for a variegation of taxonomic groups.
Of the five diversity indicators surveyed in this study, H´ indicates variables of ´soil & bedrock´ best (s. s., soil type, flysch or limestone Vienna Woods, and soil moisture). These variables are interdependent, have major impact on plant communities, and underline the geological peculiarity of the study area. The distinction between flysch and limestone Vienna Woods has crucial implications for the soil types, their chemical composition and water balance, as well as the diversity of occurring animal and plant species (BFW 2011). In the flysch parts of the Vienna Woods, heavy, nutrient-rich, deep soils have developed. These soils are characterized by advantageous water supply and high specific water storage capacity (Leitgeb et al. 2012). Species diversity monitoring in the BR Vienna Woods detects few vascular plant species in high abundances in those areas (BR Vienna Woods Management 2021a). In the limestone parts of the study area, dry, nutrient-poor, and shallow soils are common (BFW 2011). Specific water storage capacity and water supply of these soils is much lower and promote drought tolerance species (Leitgeb et al. 2012). Species diversity monitoring indicates species-rich herbaceous vegetation in low abundances (BR Vienna Woods Management 2021a) making the model outcomes highly reasonable.
The Stand Density index (SDI)
Of all indicators, the variables ´basal area´, ´living wood volume´, ´quadratic mean diameter´, and ´stand density´ are indicated best by SDI. The Stand Density index reflects the lowest number of explanatory variables, all belonging to the category ´age & density´, in very high accuracy. In our study, pronounced correlations with other indicators, especially with CCF, are found. Besides directly sharing the element ´stand density´ in their formula, CCF and SDI describe the same forest structural aspect. The SDI is a proxy for spatial distribution of resource availability (Heym et al. 2021) and indicates the availability of open niche space (McElhinny et al. 2005; LaRue et al. 2019).Actual SDI levels in the core areas of the BR Vienna Woods range between 524.69 (´Leopoldsberg I´) and 877.51 (´Rauchbuchberg´). Our findings line up with Vospernik and Sterba (2016) who demonstrated maximum stand densities stands of tree species in Austria. Pure coniferous and mixed stands show comparably higher stand density levels than broadleaved stands.
No correlation between SDI and ´dominant tree species´ is detected in the case study, even if e.g., tree mortality with increasing stand density was found to be strongly tree species dependent (Liang et al. 2007). This indicates that (1) the broadleaved species observed have similar maximum densities in terms of stem numbers and basal areas or (2) species dependent mortality does not yet play a major role in the core areas of the BR Vienna Woods.
Additionally, occurrence of ´clastic bedrock´, on which nutrient-poor soils establish (NW-FVA 2008), is indicated by SDI. Our study shows how canopy competition in the BR Vienna Woods could be a proxy for soil nutrient supply. These findings are in line with Schmidt et al. (2002) and Podrázský et al. (2014), who proved that soil base supply is the most important factor explaining herbaceous species diversity in temperate beech and Douglas fir forests. Greater overlap of crowns indicates a greater use of niche space for light in the canopy (Williams et al. 2017), and limits light transmission to the ground. In future studies, it would hence be interesting to test if ground vegetation diversity or quantity can be indicated by SDI in European beech dominated forests.
The Crown Competition Factor (CCF)
The ranking of the core areas deviates between stand density assessment with SDI and CCF. Actual CCF levels in the core areas of the BR Vienna Woods range between 225.60 (´Johannserkogel II`) and 471.75 (´Übelaugraben´). CCF can be applied to uneven-aged mixed forests (Sterba 2008). Difficulties with CCF can arise with the assessment of pure stands of the very shade-tolerant and large-crowned European beech, for which Sdino (1996) described maximum CCF levels of >2000. Variables well indicated by CCF are ´stem basal area´, ´quadratic mean diameter´, and ´dominant tree species´. The indication of ´dominant tree species´ by the CCF is in line with Sdino (1996) and Liang et al. (2007) and may occur due to the species-wise crown diameter being considered in the CCF formula.
Moreover, CCF indicates the variables ´altitude´ and ´aspect´ well. The Vienna Woods contains both, hall-shaped, low understory beech stands and south-exposed hilltops, where European beech (Fagus sylvatica) is already water-limited. On those sites, red pine and oak forest communities with rich understory occur (BR Vienna Woods Management 2021b), making this result highly plausible.
The Diameter Differentiation index (Diff)
The Diameter Differentiation index is the only indicator to mirror game impact and an overall high number of variables. Closest intercorrelation of Diff is found with CCF and SDI, both of which Diff shares one element (qmd) in the formula with, respectively. Actual Diameter Differentiation index levels in the core areas of the BR Vienna Woods range between 0.22 (´Hengstlberg`) and 0.40 (´Johannserkogel I´). Diameter heterogeneity in unmanaged stands is created by natural disturbance regimes which are decisive for most forest structural legacies. Natural disturbance regimes of European beech forests contain frequent, small-scale, low intensity as well as rare, large-scale, high intensity disturbance events (Leibundgut 1982; Mayer 1984; Tabaku 1999; Meyer et al. 2003).
Species diversity monitoring in the BR Vienna Woods shows that occurrence probabilities for bat, snail, relict beetle, and old-growth forest bird species increase in the core areas compared to the managed parts. The Diameter Differentiation index seems to mirror plenty of the crucial habitat structures and quality for those guilds best (e.g., altitude, aspect, micro- and meso-relief, natural regeneration and standing dead wood). Deadwood input often relates with the natural disturbance regimes (Christensen et al. 2005). The outcomes line up with findings of Winter and Möller (2008) who showed that the Diff can be an important indicator of microhabitats in forest stands.
Structural diversity indicator set
The variable category ´age & density´ is overrepresented by the comprehensive indicator set. Partially reflected are the categories ´forest site´ and ´vertical structure´. The categories neglected are ´game impact´ and ´soil & bedrock´. Using random Forest to gain new insights in indicandum-indicator relationships, pronounced sensitivity to the number of explanatory variables tested could be found. Variables reflected best by the indicator set are ´stem basal area´, ´stem density´, ´standing stock volume´, and ´quadratic mean diameter´. Contrary, stand characteristics like ´coarse woody debris >25 MDM´, ´tree browsing´, and ´humus type´ are neglected in all models. Scientifically, there is broad consensus for the relevance of humus type (e.g., Schäfer and Schauermann 1990; Hooper et al. 2000; Ponge 2003; Salmon et al. 2006, 2008), tree browsing (e.g., Gill 1992; Pastor et al. 1997; Reimoser et al. 2003) and large coarse woody debris (Kappes & Topp 2004; Müller et al. 2007; Rondeux and Sanchez 2010; Brin et al. 2011; Lassauce et al. 2011) for forest biodiversity.
In line with LaRue et al. (2019), our study shows that aspects of forest structure indeed are intercorrelated and neither ecologically nor statistically independent. Furthermore, we agree with these authors that structural niche space or ecosystem structure and function cannot be understood by one metric. Indicators which measure either more or less than they are supposed to, i.e., construct-irrelevant variance or construct underrepresentation may bias the qualitative connection between evidence and interpretation (Heink & Kowarik 2010).
Due to unavailable indicator values (e.g., bark diversity, hollow trees, forest communities, litter dry weight, litter decomposition, perennial species richness, tree age, and undisturbed reference areas) or different scales it was not possible to compare our indicator set with the performance of other aggregated biodiversity indicators (Parkes et al. 2003; McElhinny et al. 2006; Geburek et al. 2010; Storch et al. 2018; Heym et al. 2021). However, there is partial agreement in choice of elements of biodiversity studied in McElhinny et al. (2006) and Storch et al. (2018) like quadratic mean diameter, natural regeneration, standing and lying deadwood, stem basal area. Compared to Heym et al. (2021) partly identical structural diversity indicators are chosen (e.g., Shannon index, SDI).