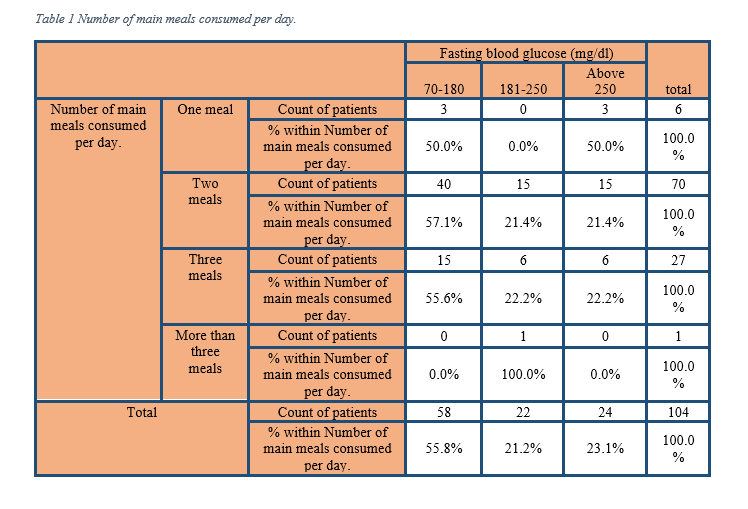
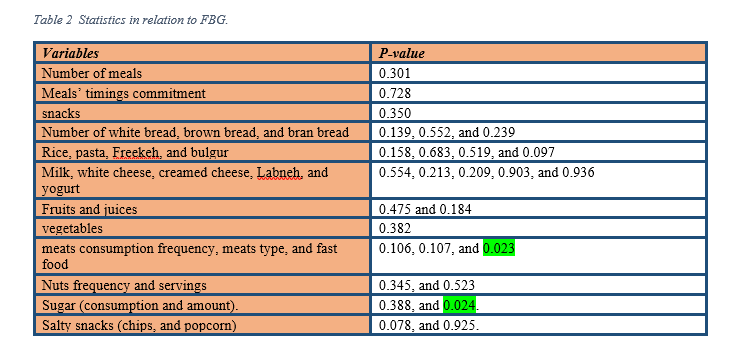
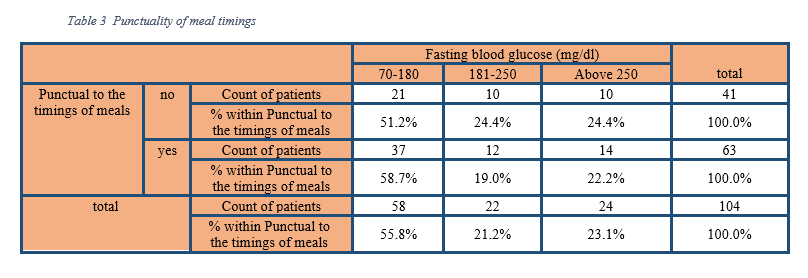
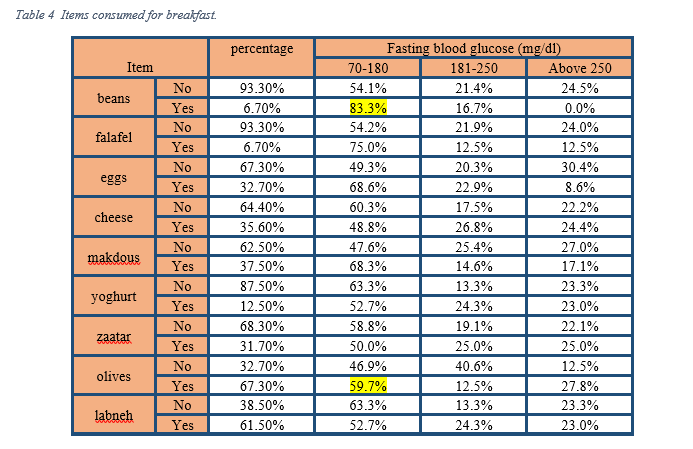
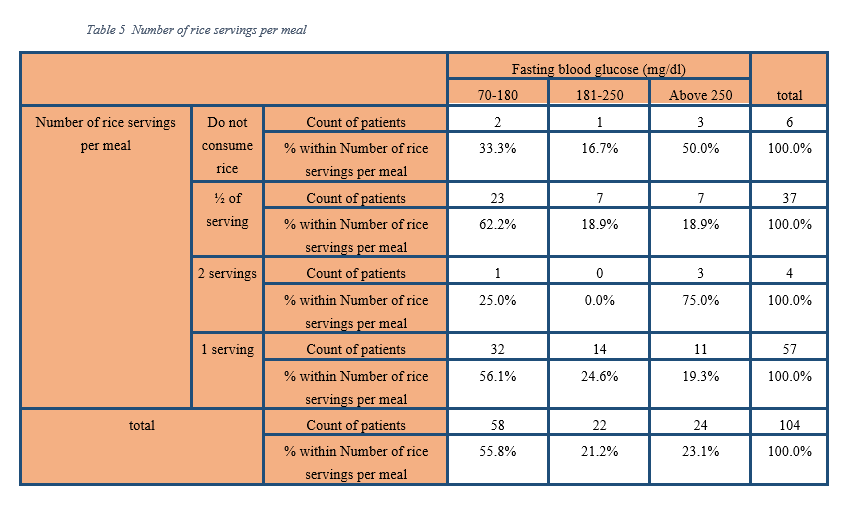
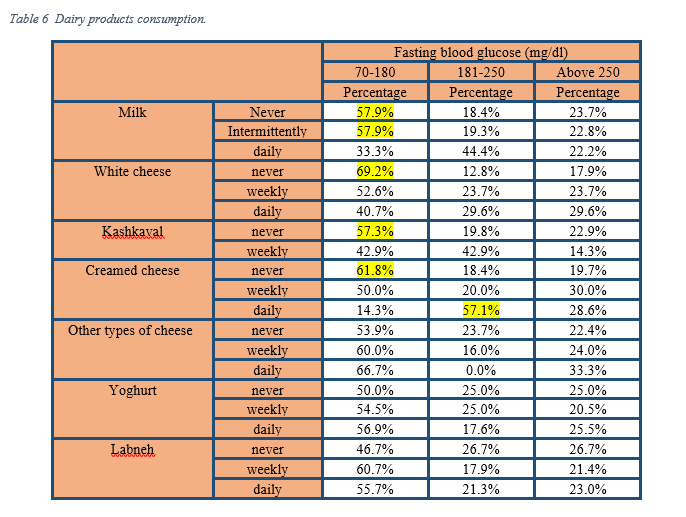
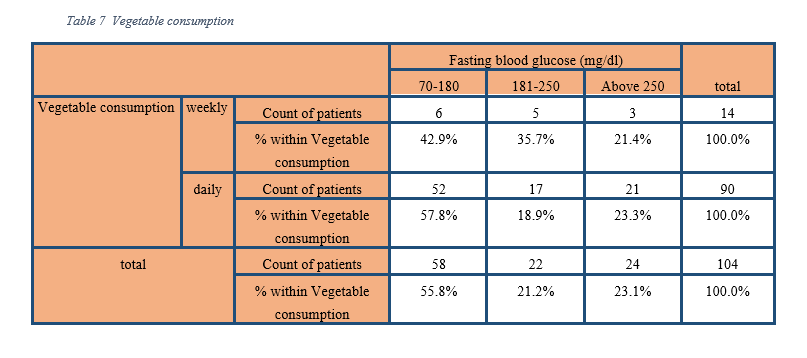
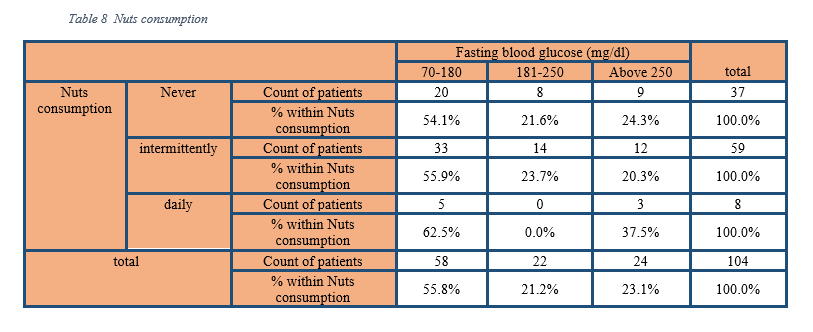
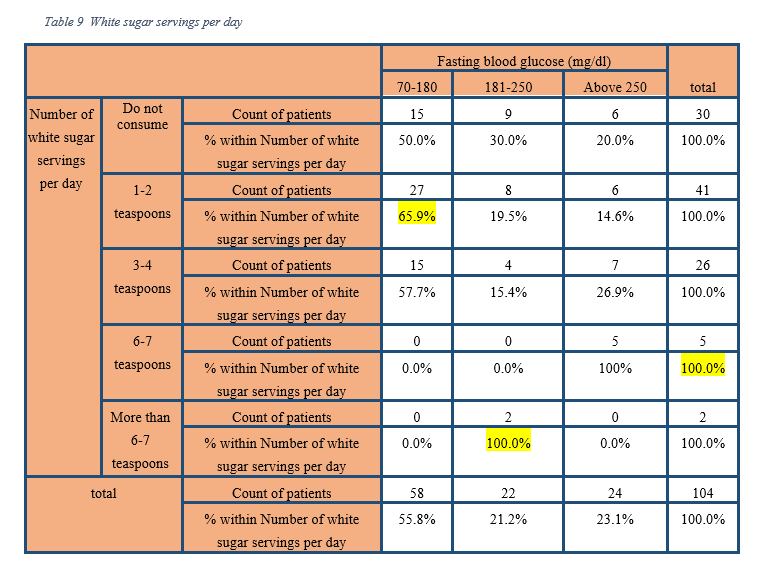
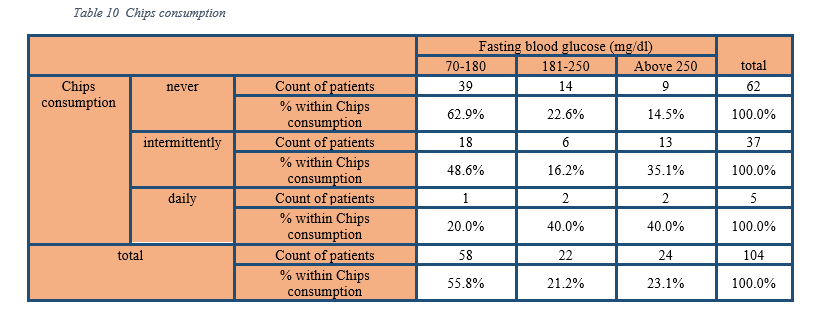
Females constituted 63.4% of the participants, while males were only 36.5%. Regarding the age groups, the 51–60 group was the most prevalent with a rate of 40.4%, followed by 39.4% of the 61–70 group, whereas the 71–75 group was the least prevalent. The patient’s Body Mass Index data was not complete. About two-thirds of the sample were smokers, and 52.8% of the total patients were exercising daily. We asked about hypertension, high blood cholesterol levels, and vascular disorders in reference to medical history; however, the data was incomplete. As for the diabetic history, questions included the onset of disease where 40.4% of the participants had the disease for 5–15 years, followed by 1–5 years with a rate of 26%, and 25 years or more with 2.9% as the less prevalent percentage. The medications were not questioned; self-glucose monitoring (SGM) data was not used in this study because more than half of the patients did not own the SGM device, and 89.4% of those of owned it were not using it daily. Data used in the lab results were only the FBG, where 55.8% of the patients recorded 70–180 mg/dl, 21.1% recorded 181–250 mg/dl, and 23.1% recorded 250 < mg/dl. HbAc1 readings were not complete for all the individuals. As for the renal lab, results were checked before proceeding with the patients, as mentioned previously. In the general diet questions, 5.7% of the patients consume one meal per day; 67.3% consume two meals per day where 57.1% of that percentage recorded an FBG of 70–180 mg/dl; 25.9% of the patients consume three meals per day where 55.6% of the patients that consumed three meals per day recorded 70–180 mg/d, however these results were not statistically significant Table 1 Table 2. Moreover, 60% of the patients were punctual in their meals timings; nevertheless, their FBG was approximate to those who were not punctual, and the majority had an FBG of 70–180 mg/dl Table 3. Diving further into the meals and food ratio, for breakfast, 67.3% of the patients consume olives, 61.5% consume Labbneh, 37.5% consume Makdous, and 6.7% consume beans and Falafel. As for the FBG, beans were associated with a lower sugar rate than the rest of the items, where 83.3% had an FBG of 180 − 70 mg/dl Table 4. As for lunch, cooking, especially vegetables, made up the majority with a percentage of 89.4%, followed by rice with a percentage of 16.3%. Concluding with dinner, vegetables were the most consumed item with a percentage of 15.4%, followed by Labneh with a 12.5%, and cheese with a 3.8% making it the least consumed. Moving onto the snacks, 86% of the sample confirmed to having daily snacks, where the category divides into fragments in the situation that 46% of them chose apple as their snack, 31% as orange, and 21% as biscuits. Regarding the food groups and starting with bread, 93.2% of the patients consumed traditional white bread daily, and subdivisions of that percentage document that 53.8% of them recorded FBG of 70–180 mg/dl. Only 8.6% and 5.7% of the sample had bran bread and brown bread, respectively, on a daily basis. Regarding the rice, pasta, and legumes, three-quarters of the participants ate rice weekly, and nearly half of the patients ate pasta monthly. As for Freekeh (green durum wheat), most of the sample did not eat it, and about 70% of the sample ate bulgur weekly; by moving to the FBG records, most of those who ate rice monthly, recorded greater rates at an FBG of 70–180 mg/dl. As for the Freekeh, individuals who ate it weekly recorded 100% FBG of 181–250 mg/dl. As for bulgur, 66.7% of the patients who ate it daily recorded FBG 250 < mg/dl. Regarding the number of rice servings, there was a tendency for higher FBG reading as the number of servings per meal increased (1 serving = 1 meal plate = 10–15 tablespoons) Table 5. Moving onto milk and dairy products, most of the participants, 54.8%, drank milk intermittently, and 36.5% did not consume it at all, where both recorded FBG of 70–180 mg/dl with a similar rate and it was 57.9%. As for white cheese, 26% of the sample ate it daily; regarding the FBG reading, 40.7% of patients that ate it daily, recorded 70–180 mg/dl. The majority of the participants did not consume creamed cheese and other types of cheese, and that consisted of 73.2%; nevertheless, individuals who consumed more than three tablespoons of creamed cheese recorded an FBG of 250 < mg/dl. 49.5% of the sample consumed yogurt daily and 56.9% of them recorded an FBG of 70–180. Most of the sample ate Labneh on a daily basis which resulted in a percentage of 58.7% where 55.7% of them recorded 70–180 mg/dl Table 6. Moving on to the fruits and juices, apples were the most consumed fruit accounting for 85.6%, followed by oranges with a 74%. 42.3% of the patients did not consume any type of juice, and most of the non-consumers recorded FBG of 70–180 mg/dl. Regarding vegetables, 86.5% consumed them daily, and the majority of the consumers recorded an FBG of 70–180 mg/dl Table 7. As for the types of vegetables eaten, tomatoes scored the highest percentage of consumers with a 63.5%, followed by cucumbers with a 54.8%, and lettuce came third with a 42.3%. In regards to the meat, which was incorporated through cooking and the serving did not exceed 150 grams, 62.5% of the patients consumed meat weekly where 56.0% of the weekly consumers recorded an FBG of 70–180 mg/dl. Generally speaking, 76.8% of participants who ate meat consumed white meat, and 53.4% of this majority recorded an FBG of 70–180 mg/dl. Furthermore, 23.2% of the patients consumed red meat where most of the red meat consumers recorded an FBG of 70–180 mg/dl. Concerning fast food, individuals who never consume it recorded 62.5%, where the majority of the non-consumers recorded FBG of 70–180 mg/dl. Merely 6.7% of the patients consume fast food weekly which were more likely to record an FBG 250 < mg/dl with a 71.4% and these results were statistically significant Table 2. Regarding the consumed fast food items, Shawarma recorded the highest percentage with 69.2% followed by broasted chicken with 33.3%. On the subject of nuts consumption, which are peanuts, sunflower and melon seeds, 56.7% eat nuts intermittently and more than half of the consumers recorded an FBG of 70–180 mg/dl. Only 7.7% of the individuals ate nuts daily, where the majority of the daily consumers recorded an FBG of 70–180 mg/dl Table 8. There was a tendency for high FBG rates as the number of servings of nuts increased (1 serving = 5–6 nuts). For those with an FBG of 250 < mg/dl, 15.9% of them ate one serving, while 42.9% ate three servings. As for oils, the most used type is sunflower oil with a 88.3% of the participants confirming their usage, followed by olive oil with 9.7%. Moving on to the sugar, 71% of the patients used white sugar, where 55.4%, and 8.1% of the white sugar users, respectively consumed 1–2, and 6–7 teaspoons (1 teaspoon = 4 grams) of sugar per day. There was a tendency for high FBG records as the number of teaspoons of sugar increased, where most of patients who consume 1–2 teaspoons recorded an FBG of 70–180 mg/dl, and the majority of patients who consumed 6–7 teaspoons recorded 250 < mg/dl, and these findings were statistically significant Table 9 Table 2. Furthermore, 84.6% did not use artificial sweeteners at all. Regarding salty snacks, an increased tendency was observed between FBG values and the frequency of consuming chips, where 59.6% of the patients never consumed chips and most of the non-consumers recorded an FBG of 70–180 mg/dl Table 10. As for popcorn 63.5% consumed it intermittently. There was no significant difference between the popcorn results.