Mice and transient middle cerebral artery occlusion (tMCAO) model
Senty-tow 8-12 week-old C57BL/6J male mice were housed under controlled environmental conditions with a consistent temperature of 22-25℃, relative humidity of 65%, and 12h light/dark cycle. All the mice had free access to food and water. All experimental protocols and animal handling procedures were performed according to the National Institutes of Health (NIH) guidelines for the use of experimental animals, and the study was approved by the Institutional Animal Care and Use Committee of the Fourth Military Medical University (No. 2014–81371447).
Animals were randomly assigned to the following experimental groups of 12 mice each: a. Sham; b. tMCAO; c. tMCAO+si-Ctrl; d. tMCAO+si-STIM1; e. tMCAO+si-STIM1+Vehicle; f. tMCAO+si-STIM1+AZD5363.
tMCAO model was performed according to the previous published article[14]. Briefly, anesthesia was induced in mice by inhalation of 5% isoflurane and maintained with 2% isoflurane. The external carotid artery was isolated following by inserting a standardized nylon filament (Doccol Corporation, US) to the origin of the right MCA through the right internal carotid artery. Filaments were removed after 90mins to allow reperfusion. Cortical cerebral blood flow (CBF) was recorded by laser Doppler flowmetry (Moor Instruments, UK), and the reduction to approximately 20% of the baseline was considered as successful occlusion. Mice in the Sham group underwent the same procedure except for filament insertion. All the mice were sacrificed 1 day after tMCAO.
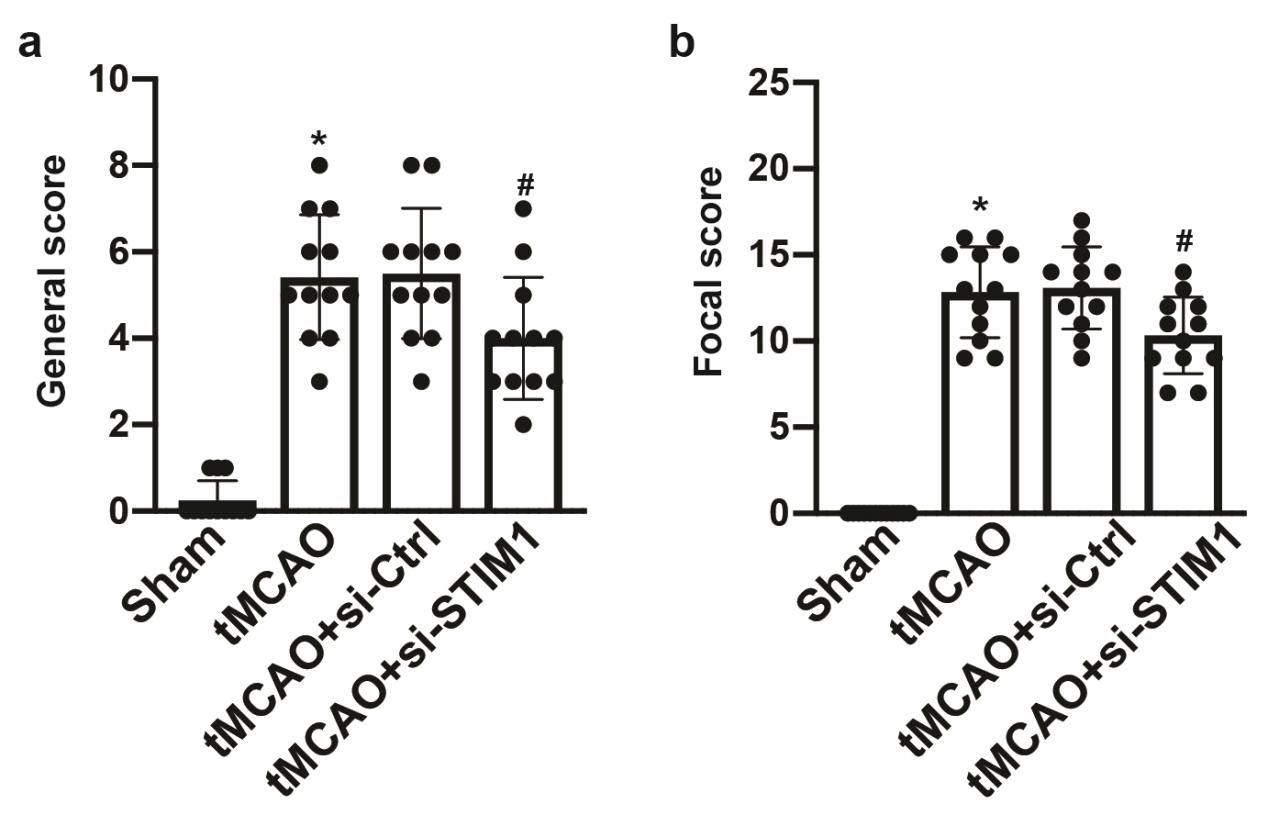
Neurological score evaluation
The Clark score was performed to assess neurological deficits. The score consists two parts, focal and general. The general part contains 6 items with a total score ranging from 0-28. The focal part contains 7 items, each providing 0-4 points. Higher scores indicate more severe neurological deficits.
Infraction volume and brain edema measurement
2,3,5-Triphenyltetrazolium hydrochloride (TTC) staining was performed to assess the infraction volume. Immediately after sacrifice, mouse brains were removed and sectioned into five coronal slices 2-mm-thick. Brain sections were stained with 2% TTC (Sigma-Aldrich, US) at 37℃ for 30min in the dark. Stained brain sections were fixed in 2% paraformaldehyde and photographed. The percentage of infarct volume (white) was analysed using Image J software.
Primary culture of hippocampal neuron
Hippocampal neurons were obtained from C57BL/6 mice following a modified method described previously[15]. Briefly, cerebral cortices were removed from day 16-18 embryos in ice-cold medium (HBSS plus 10 mM HEPES, pH7.3), and the meninges and blood vessels were stripped, and minced. Dissociated the tissues by trypsinining with 0.25% trypsin for 15 min at 37 °C and triturating gently. Neurons were resuspended in a neurobasal medium containing 10% FBS (Invitrogen), 2% B27 supplement (Invitrogen), penicillin/streptomycin (Invitrogen), and 0.5 mM L-Glutamine (Invitrogen), and then plated at a density of 3×10⁵ cells/cm2. Before seeding, the culture vessels were coated with Poly-D-lysine (10 mg/ml, Sigma-Aldrich) overnight at room temperature. Neurons were maintained at 37 °C in a humidified 5% CO2 incubator and half of the culture medium was replaced every other day. All experiments were performed at 10 days after culturing.
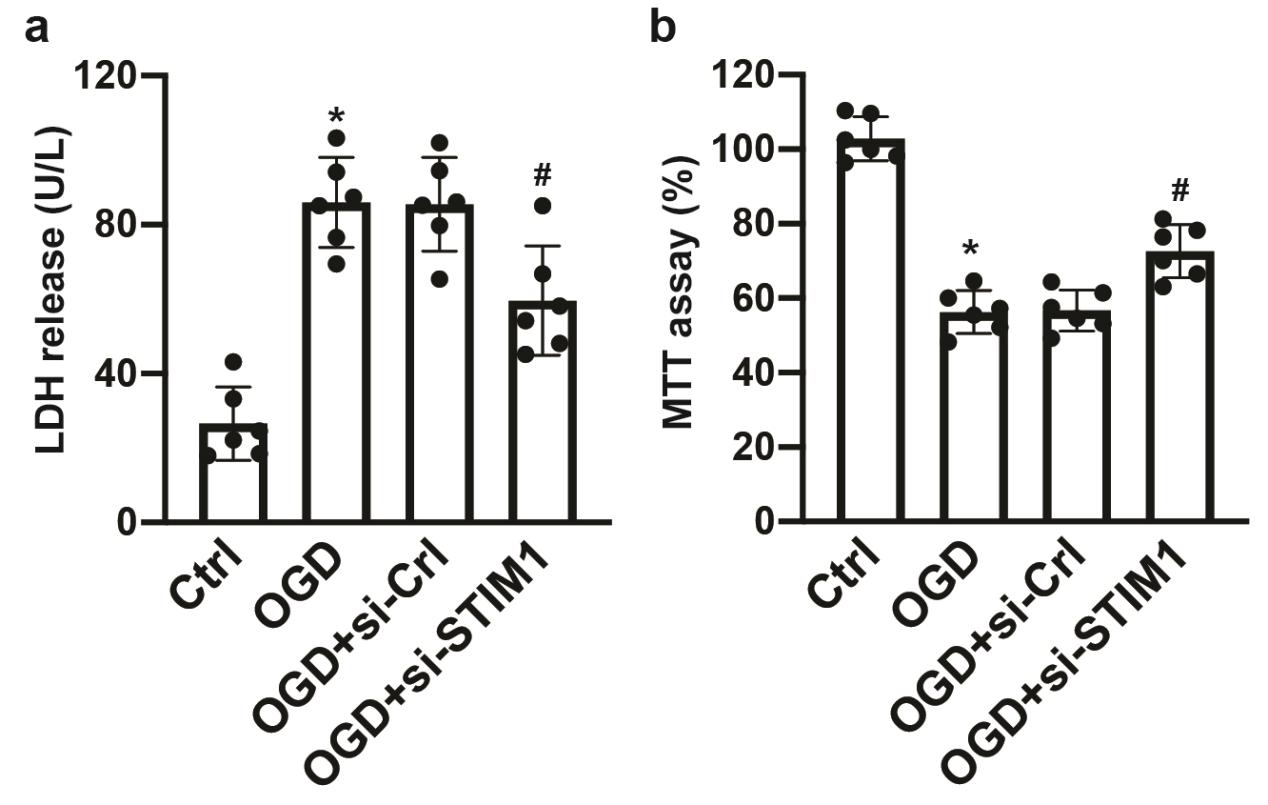
Oxygen and glucose deprivation (OGD)
To initiate OGD, remove medium and rinse 3 times with phosphate-buffered saline (PBS). Place the cultured neurons in a dedicated humidified chamber containing 5% CO2, 95% N2 at 37 °C with glucose-free DMEM, which was pre-gassed with N2/ CO2 (95%/5%) to remove residual oxygen. After 2, 4, 8 12, and 24 h according to experimental design, neurons were removed from the anaerobic chamber, and the culture medium was replaced with neurobasal medium containing a 2% B27 supplement and 0.5 mM L-Glutamine. Neurons were further incubated in a humidified 5% CO2 incubator for 24h at 37°C to generate the reperfusion injury.
Intracellular Ca2+ measurement
Cytosolic Ca2+ signals were measured with Fluo-4 AM (Beyotime, China) according to manufacturer’s instructions. In detail, cells were incubated with 5 μM Fluo-4 AM in normal Tyrode’s solution for 30 min, then washed three times with PBS and incubated without Fluo-4 AM for an additional 15 min to de-esterificate AM esters. Add 4 μM thapsigargin (TG) at 120 s to induce intracellular Ca2+ store depletion. At 400 s, add 2.5 mM Ca2+ to the bath to initiate SOCE. Real-time fluorescent intensity was acquired every 2 seconds and monitored for 10 min. Data were analyzed usingMetaFluor imaging software (Molecular Devices, US).
Immunohistochemistry and immunofluorescence
Deparaffinized 4 μm-thick coronal sections or neurons fixed with 4% paraformaldehyde were blocked with 5% bovine serum albumin (BSA) for 30 min at room temperature and rinsed twice in PBS. Sections or cells were then permeabilized in 0.5% Triton X-100 for 20 min and incubated with the primary antibodies against LC3 (1:50, Cell Signaling Technology, US), STIM1 (1:100, Cell Signaling Technology, US), Orai1 (1:100, Invitrogen, US), NeuN (1:100, Millipore, US) overnight at 4 °C. Sections or cells were then rinsed twice in PBS and incubated with secondary antibody for 2 h at room temperature in the dark. Slices were overlaid with mounting medium containing 4,6-diamidino-2-phenylindole (DAPI) to counterstain nuclei and imaged by confocal microscopy (Olympus iX80). Five random regions of each sample were imaged and analyzed with ImageJ software.
Autophagic flux measurement
Neurons were infected overnight with adenoviral vectors containing GFP-LC3 or GFP-mRFP-LC3 (HanBio Technology, China). Under acidic condtions of the lysosome, the GFP signals were quenched, while the mRFP remains stable. Thus, the formation of autophagosomes is represented by yellow spots and lysosomes are only shown in red. Autophagy flux was determined by assessing the number of GFP and mRFP puncta and the colocalization of the two signals with ImageJ software.
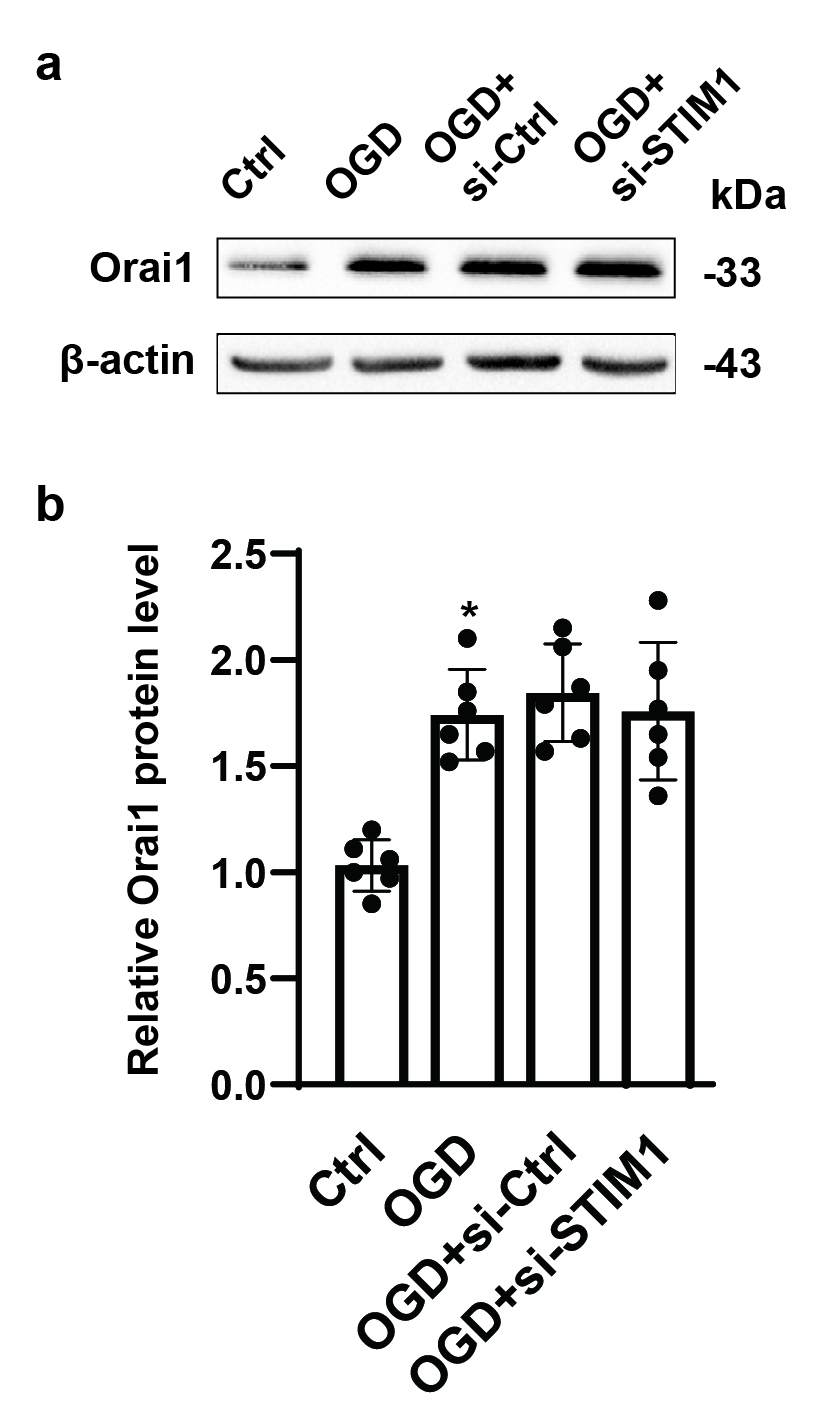
Western blot analysis
Hippocampus or neurons were harvested for whole-cell protein extraction. Protein was quantified using the BCA kit (Beyotime, China). Equal amounts of protein (40 μg) were loaded and separated by 10% sodium dodecyl sulphate (SDS)-PAGE gel and transferred to polyvinylidene difluoride (PVDF) membranes. Membranes were blocked with 5% non-fat milk in tris-buffered saline containing 0.1% Triton X-100 for 1 h and then incubated with primary antibodies against LC3Ⅱ (1:800, Cell Signaling Technology, US), SQSTM1/P62 (1:800, Cell Signaling Technology, US), Orai1 (1:500, Invitrogen, US), STIM1 (1:1000, Cell Signaling Technology, US), p-AKT (1:800, Cell Signaling Technology, US), p-mTOR (1:500, Invitrogen, US) and β-actin (1:2000, Cell Signaling Technology, US) overnight at 4 °C. Then, the membranes were washed and then incubated with secondary antibodies for 1 h at room temperature. Bands were visualized with Super Signal West Pico Chemiluminescent Substrate (Thermo Scientific, US) and scanned. ImageJ software was used to quantify the optical density of each band.
Statistical analysis
All of the experiments were performed at least three times and data was presented as mean ± SD. Statistical analysis was performed using GraphPad Prism version 9.0 software. Significant differences were assessed by univariate ANOVA with more than two groups, followed with post hoc Tukey’s test for multiple comparisons or an unpaired t-test between two groups. P<0.05 was considered statistically significant.