SASP-related genes were screened in BLCA
We're from GenesCords to senescence in website (https://www.genecards.org/) associated secretory phenotype (SASP) for keywords, A total of 96 genes with SASP score > 7.0 were selected. Then, the prognostic significance of these 96 genes in bladder cancer was analyzed, and 18 prognostic related genes were obtained (PPARG,PRKG1,NFKB1,GATA4,EGFR,CAV1,IGF1,SPINK1,HLA-G,IL4,VEGFA,CD36,MMP9,ACTA2,SRC,MAPK3,SERPINE1,ILK)(figure 1B). Of the 18 genes, PRKG1 NFKB1, CAV1, IGF1, CD36, ACTA2, ILK expression in bladder cancer is lower than the corresponding normal tissues,The expressions of HLA-G, MMP9 and SRC in bladder cancer were higher than those in the corresponding normal tissues, while there were no significant differences in the expressions of PPARG, GATA4,EGFR, SPINK1,IL4,VEGFA, MAPK3 and SERPINE1 in bladder cancer and the corresponding normal tissues(figure 1A). We also analyzed the associations of these 18 genes in bladder cancer samples from the TCGA database (figure 1C),And a grid of their interactions is drawn from STRING (https://cn.string-db.org/) (medium confidence(0.4))(figure 1D).
Expression and prognostic significance of SASP-related genes in bladder cancer. A: Expression of 18 genes in bladder cancer. B: Prognostic forest map of 18 genes in bladder cancer. C:Correlation network diagram of 18 genes in bladder cancer. D: Interaction network diagram of 18 genes.
SASP-related gene enrichment analysis
To elucidate the function of SASP-related genes in tumors, we analyzed these genes using KEGG and GO databases. KEGG enrichment analysis showed that SASP-related genes were significantly correlated with "HIF−1 Signaling Pathway", "PI3K−Akt Signaling Pathway", and "IL−17 Signaling Pathway", and bladder cancer(figure 2A). The important roles of these three factors in tumor immune microenvironment have been reported [7][8][9]. GO enrichment analysis showed that SASP-related genes were most correlated with peptidyL-Tyrosine phosphorylation, membrane Raf and protein heterodimerization activity(figure 2B-D).
KEGG/GO analysis of SASP-related genes. A:KEGG pathway analysis. B:GO:Biological Process . C:GO:Cellular Component analysis. D:GO:Molecular Function analysis.
Consensus Clustering Analysis of SASP Regulators Revealed Significant Differences in Baseline Characteristics and Survival Between Two Patient Clusters
ConsensusClusterPlus (v1.54.0) is used for consistency analysis. Based on the expression level of selected SASP-related genes and the proportion of fuzzy clustering measures, k = 2 was determined to be the best clustering stability from K = 2 to 6 (figure 3A-B). Subsequently, we analyzed the expression of SASP-related genes in these 2 clusters, and found that 11 genes were highly expressed in cluster 2, 4 genes were highly expressed in cluster 1, and 3 genes showed no significant difference between cluster 1 and cluster 2(figure 3C-D). We also analyzed OS and PFS of clusters 1 and 2 in bladder cancer, and the results showed that cluster 2 was significantly associated with poor prognosis of BLADDER cancer OS and PFS (figure 3E-F). Subsequently, differences were noted in the clinicopathological characters and prognosis between the two subtypes, as shown in Table 1. There was no statistical significance between the two clusters except for age and sex (P > 0.05), and other pathological features were statistically significant.
Differential expression patterns and survival rates of SASP-related genes in two bladder cancer subtypes. (A) K = 2 consensus clustering matrix. (B) The cumulative distribution function of k = 2-6. (C-D) Heat and box plots show the expression patterns of SASP-related genes in two bladder cancer subtypes. (E-F) Kaplan-meier curves showed OS (E) and PFS(F) in patients with bladder cancer in both groups. * p < 0.05,** p < 0.01,和 *** p < 0.001.
Table 1 Clinical characteristics of two groups of patients with bladder cancer. 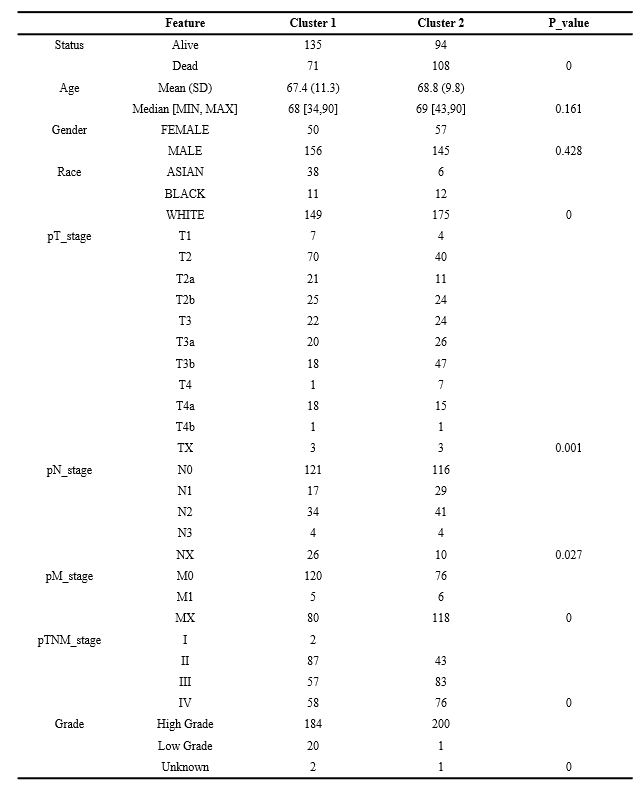
Association of SASP-related genes with genes related to immune cell infiltration and immunoassay sites in bladder cancer
In order to investigate the effect of SASP-related genes on the immune microenvironment of bladder cancer, TIMER and CIBERSORT methods were used to evaluate the relationship between cluster 2 and genes related to immune cells and immune examination sites. The classification of the two subtypes based on expression levels of selected SASP-related genes revealed significant differences in immune cell infiltration (figure A-D). In addition, we also analyzed the relationship between cluster 2 and immunoassay sites, and the results showed that there were significant differences in the expression of genes related to immunoassay sites in cluster 2 (figure 4F). PD-L1 (CD274) plays an important role in the immunotherapy of bladder cancer. Therefore, we detailed the expression of PD-L1 in two clusters, and the results showed that the expression of PD-L1 in cluster 2 was significantly higher than that in cluster 1 (P=3.1e-18)(figure 4E). Therefore, we believe that SASP-related genes play an important role in the immune microenvironment of bladder cancer.
The differential infiltration level of tumor immune cells in two bladder cancer(BLCA) subtypes. A-D:The infiltrating levels of various immune cell types in two subtypes in the TCGA-BLCA cohort. E: PD-L1 expression was significantly different in 2 clusters. F:Heat maps of gene expression associated with two clusters of immunoassay sites.*p < 0.05, **p < 0.01, ***p < 0.001, and ****p < 0.0001.
Construction of LASSO model
The LASSO Cox regression model was used to select the most predictive genes as prognostic indicators. λ was selected when the median of the sum of squared residuals was the smallest. Five potential predictors (figure 5A-B). MAPK3,SRC,CD36,VEGFA,IL4,HLA-G,SPINK1,IGF1,EGFR,GATA4,NFKB1,PRKG1 were identified as prognostic factors for BLCA. The risk score =(0.1426)*PRKG1+(-0.2351)*NFKB1+(-0.0116)*GATA4+(0.1326)*EGFR+(0.0676)*IGF1+(-0.0303)*SPINK1+(-0.1331)*HLA-G+(-0.043)*IL4+(-0.02)*VEGFA+(0.0246)*CD36+(-0.0326)*SRC+(0.1409)*MAPK3. Patients with BLCA were divided into two groups based on risk score. The distribution of risk score, survival status and expression of these 12 genes are shown in Figure 5C. Kaplan-meier curves showed that patients with high risk BLCA had a lower overall survival rate than patients with low risk BLCA (median time=1.8 and 5.3 years,p=4.77e-06)(figure 5D),AUC in the 1-year, 3-year and 5-year ROC curves were 0.703, 0.682 and 0.673 respectively (figure 5E). These results suggest that SASP-related genes can be used as biomarkers for the prognosis of BLCA.
Genetic prognostic model of SASP-related genes. (A) Partial likelihood deviance versus log (λ)was drawn using LASSO Cox regression model. (B) Coefficients of selected features are shown by lambda parameter. (C)Distribution of risk score, survival status, and the expression of 12 prognostic SASP-related genes in BLCA. (D-E) Overall survival curves for BLCA patients in the high-/low-risk group and the ROC curve of measuring the predictive value.
Building a predictive nomogram
Considering the clinicopathologic features and these 12 prognostic SASP-related genes, we also built a predictive nomogram to predict the survival probability. Univariate and multivariate analyses showed that HLA-G, EGFR, CD36 expression, age and pTNM stage were independent factors affecting the prognosis of BLCA patients (figure 6A-B). The predictive nomogram suggested that the 3‐year and 5‐year overall survival rates could be predicted relatively well compared with an ideal model in the entire cohor (figure 6C-D).
Construction of a predictive nomogram. (A-B): The risk ratios and P values of the components involved in univariate and multivariate Cox regression for clinical parameters of BLCA and 12 SASP-related genes. (C-D): Nomogram to predict the 1, 3, and 5 year overall survival rate of BLCA patients. Calibration curve for the overall survival nomogram model in the discovery group. A dashed diagonal line represents the ideal nomogram.
Correlation analysis of SASP-related genes prognosis model and tumor immune infiltration in BLCA
SASP plays an important role in the development of tumor immune microenvironment. In this study, we also used TIMER and MCPCOUNTER methods to analyze the correlation between SASP-related genes prognosis model and various immune cells,The results of TIMER method showed that B cell, T cell CD4+,T cell CD8+,Neutrophil,Macrophage and Myeloid dendritic cell was positively correlated with SASP-related genes prognosis model(figure 7A) .SASP-related genes prognosis model was positively correlated with cytotoxicity score, NK cell, B cell, Macrophage/Monocyte,Myeloid dendritic cell,Endothelial cell by MCPCOUNTER method (figure 7B).
Correlation analysis of SASP-related genes prognosis model and tumor immune infiltration. (A): TIMER method was used to analyze the correlation between SASP-related genes and immune infiltrating cells. (B): MCPCOUNTER method was used to analyze the correlation between SASP-related genes and immune infiltrating cells.
Key SASP genes in BLCA were obtained by screening
PD-L1 plays an important role in immunotherapy of various tumors, including bladder cancer. Correlation analysis of PD-L1 with 12 SASP-related genes in BLCA prognostic model showed that PD-L1 was positively correlated with CD36, EGFR, HLA-G, IGF1, NFKB1, PRKG1, and negatively correlated with SPINK1, SRC, and VEGFA (figure 8A). Subsequently, we took the cross points of the gene set with high expression of SASP-related genes in bladder cancer, the gene set with positive correlation with DP-L1, and the gene set with significant difference in multivariate analysis of the genes in our prognostic model, we get a single gene:HLA-G (figure 8B). We also showed the correlation between PD-L1 and HLA-G in detail (correlation coefficient: 0.33, P = 7.29E-12, figure 8C). Sankey diagram showed the distribution trend of HLA-G expression on age, pTNM stage, grade and BLCA survival in TUMOR samples of BLCA (figure 8D). Finally, in bladder cancer, we grouped high HLA-G expression and low HLA-G expression into groups for KEGG enrichment analysis. The results showed that HLA-G expression was significantly correlated with 'Th1 and Th2 cell differentiation' and, 'Th2 cell differentiation', suggesting that HLA-G plays an important role in tumor immune microenvironment.
HLA- G plays an important role in BLCA immune microenvironment. (A):Correlation analysis of PD-L1 and SASP related genes. (B):Venn diagram showed that HLA-G was up-regulated in bladder cancer, with significant difference in multivariate analysis and positive correlation with PD-L1. (C): Correlation analysis between PD-L1 and HLA-G. (D): The distribution trend of HLA-G expression and age, TNM grade in patients with bladder cancer. (E) KEGG enrichment analysis of HLA-G expression in BLCA.
Correlation Analysis of HLA-G Expression With Infiltrating Immune Cells
To identify a discrepancy in the TIME of BLCA patients with high and low expression levels of HLA-G, the TIMER and CIBERSORT algorithm was carried out to explore the difference of numerous immune cell subtypes between the HLA-G high expression group and the low expression group in BLCA. TIMER algorithm showed that the B cell, T cell CD4+, Neutrophil and Myeloid dendritic cells in HLA-G high-expression group were significantly increased(p<0.001),CIBERSORT algorithm showed that T cell CD8+, T cell CD4+ memory activated and Macrophage M1 were significantly increased in HLA-G high expression group(p<0.001)(figure 9A-B), and the heat map visualized the percentage of abundance of tumor-infiltrating immune cells in each sample of low and high HLA-G group (figure 9C).
Correlation analysis of HLA-G expression with infiltrating immune cells in BLCA. (A-B):The infiltrating levels of immune cells in high and low HLA-G expression groups in BLCA patients. (C) The heat map visualized the percentage abundance of tumor-infiltrating immune cells in each sample. *p < 0.05, **p < 0.01, and ***p < 0.001.
Correlation analysis of biomarkers between HLA-G and tumor immune infiltrating cells in BLCA TIMER 2.0 database was used to study the correlation between HLA-G in BLCA and biomarkers of tumor immune infiltrating cells, and the results showed that HLA-G was positively correlated with most biomarkers of tumor immune infiltrating cells with significant difference (P < 0.05). This further proves that HLA-G is significantly correlated with immune-infiltrating cells in bladder cancer (table 2).
TABLE 2 Correlation analysis between HLA-G and related genes and markers of immune cells in Tumor Immune Estimation Resource (TIMER2.0).

Cor, R value of Spearman’s correlation; None, correlation without adjustment; Purity; correlation adjusted by purity. *p < 0.01; **p < 0.001; ***p < 0.0001.
The expression of HLA-G is associated with immunomodulators and chemokines in BLCA
Immunomodulator is an important substance that affects the function of immune system. This study showed that HLA-G expression was positively correlated with Immunoinhibitor, and P < 0.001 (Figure 11A). Meanwhile, we also found that HLA-G expression was closely related to immunestimulants and chemokines (figure 11B-D). These results suggest that HLA-G is closely involved in the regulation of immune interactions and may regulate tumor immune escape.
The expression of HLA-G is associated with immunomodulators and chemokines in BLCA. (A) Correlation between HLA-G expression and immunoinhibitors in BLCA available at TISIDB database. (B) Correlation between HLA-G expression and immunostimulators in BLCA available at TISIDB database. (C) Correlation between HLA-G expression and chemokines in BLCA available at TISIDB database. (D) Correlation between HLA-G expression and chemokine receptors in BLCA available at TISIDB database. Color images are available online.