In the Parangtritis Beach tourism area located in the Southern Mountain of Yogyakarta, karst hills were excavated to build the main accessing road and produce some of long and very steep slopes along the sides of the road. But still, there was none of the slope reinforcement installed along the road. Meanwhile, at several nearby locations within Southern Mountain, rockfall incidents have occurred many times even caused casualties. The potential of rockfall hazard also could be found in the main road of Parangtritis Beach as the study area. The purpose of this study is to determine the rockfall hazard assessment along the main road using Slope Mass Rating (SMR) analysis with the additional parameter of the slope height and the rock block size. The necessary data obtained by direct measurement and laboratory test. Geomechanics analysis, stereographic projection analysis, and hazard parameters weighting were carried out to produce the Rockfall Hazard Zonation Map of the study area. Based on 17 measurement stations, there are 4 (four) rockfall hazard classes in the study area, i.e., very low, low, moderate, and high. The class of very low, which also included road segments without slope, has the largest percentages of 83.83%, followed by the classes of moderate, low, and high with the percentage of 7.16%, 4.28%, and 4,19%, respectively. SMR was assumed as the most significant parameter that influences the rockfall hazard zonation. Historical rockfall points were overlaid over the Rockfall Hazard Zonation Map to validate the predicted hazard zones. Since 91.23% of the rockfall occurred in the moderate and high hazard classes, the zonation map considered reliable to predict future rockfall. This study also identified several landslide potential zones and provides the recommendation of slope reinforcement to be installed in the study area. Keywords: Rockfall, Slope Mass Rating, Hazard zonation, Slope reinforcement, Hills.
Research
Slope Mass Rating-based Analysis to Assess Rockfall Hazard on Yogyakarta Southern Mountain, Indonesia
https://doi.org/10.21203/rs.3.rs-17254/v3
This work is licensed under a CC BY 4.0 License
Journal Publication
published 26 Aug, 2020
You are reading this latest preprint version
Rockfall is one type of mass movement that occurred in the form of rock lumps collapsed from a slope and happens quickly both vertically and sub-vertically (Budetta, 2004; Goodman, 1989). The rockfall hazard has the potential to inflict dangerous and severe impacts on human life (van Westen & Greiving, 2017), but the risks and hazards of rockfall are varying based on the conditions of the area (Ansari et al., 2016; Budetta, 2004). The natural and physical characteristics of the hilly area were suspected to be the cause of rockfall events, and the hazard level will be higher if the area were experiencing hills excavation for transportation facilities (Hizbaron et al., 2010). Along the roads produced from excavated hills, rockfall is definitely to be one of the most potential threats that could happen, but not all segments of the roads have the same levels of hazard. Rockfall impacts were identified by Gracchi et al. (2017) as a combination of several functions, one of which is geomechanics conditions. In this study, geomechanics conditions of an area will be analyzed as a significant factor that affecting the hazard level of rockfall.
The rockfall incidents have occurred several times in Yogyakarta. Hizbaron et al. (2010) have identified 16 rockfall events that occurred in 1970-2009 in Yogyakarta and discovered that the high vulnerability area of rockfall was located along the transportation route. Afterward, a rockfall incident occurred in 2011 on Yogyakarta Southern Mountain hills that fell into settlements and caused casualties (Mustopo, 2015). In the same district, the rockfall incident occurred again in 2015 on Sadranan Beach and also caused fatalities (Jatmikotomo et al., 2015). Also located within the Southern Mountain hills area, Parangtritis Road as the study area of this present study surely cannot get away from this dangerous threat of rockfall.
Parangtritis Road is the main road to access the well-known Parangtritis Beach tourism site along the coast of the Southern Mountains, Yogyakarta. This road access has considerable tourism activities and frequently accessed by local and international visitors. Karst hills were excavated to build the main accessing roads and support the development of Parangtritis Beach. These cuttings produce several long and very steep slopes along the sides of the road. But still, there was none of the slope reinforcement installed along the road. The road also located near to the Girijati Fault, which has 250 meters of steep slope and estimated to be the main trigger of the rock mass movements in the area (Husein et al., 2010). This fault movement activates the Parangtritis Fault as the extension in the west. Both of these faults produced a rock-shaped semi-circular landslide crown (Husein et al., 2010; Prasetyadi et al., 2011) that was traversed by the road access connecting Parangtritis-Giricahyo villages as the two-way route to reach the beach.
The purpose of this study is to assess the rockfall hazard in the study area (Figure 1). The research was carried out by the study of the geological setting, the analysis of geomechanics conditions including Slope Mass Rating (SMR) and other parameters that were considered could affect the hazard level significantly, i.e., slope height and rock block size. As a result, the rockfall hazard zonation will be created using a weighting system of hazard parameters collected from field data measurements.
1. Research Equipment
The required field equipment consists of general site survey tools, but there is some equipment that commonly used in geological investigations such as the Global Positioning System (GPS), geological hammer and compass, and Schmidt Hammer. Some software was used in the data analysis and also in the making of output maps, including ArcGIS 10.6.1, Global Mapper 19, and Dips v.5.1.
2. Data Collection
There were four primary data groups obtained through direct measurements in the field, i.e., Rock Mass Rating basic (RMRb) parameters, strike and dip from the slope and discontinuous plane, slope height, and the size of rock blocks. Secondary data used in the data processing stage were including rock lithology and geological structure obtained from the extracting of Yogyakarta Regional Geological Map on a scale of 1:100.000 (Rahardjo et al., 1977) published by Geological Research and Development Center. The extracted structures were analyzed together with the interpretation of Shuttle Radar Topographic Mission (SRTM) 1-arc second global (USGS, NASA). Primary data were only taken along the main road, as the study area, from each slope/outcrop that considered could represent the area of rockfall. The slope/outcrops must be on the side of the road and have or have not yet experienced rockfalls. These slopes then become the observation points or called the stations.
Rock Mass Rating basic (RMRb)
The 5 (five) parameters that used to determine the value of the RMRb were including Uniaxial Compressive Stress (UCS), Rock Quality Designation (RQD), the space of discontinuous planes, the condition of discontinuous planes, and the condition of groundwater (Bieniawski, 1989).
Uniaxial Compressive Stress (UCS)
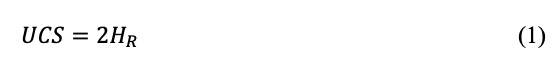
UCS values were obtained through measurements in the field using Schmidt Hammer type NR. Hardness Rebound (HR), the value generated from the Schmidt Hammer, has a scale of 1 to 100 that can be converted into UCS units (the UCS unit used in this study is MPa). Several equations can be used to determine or convert HR values into desired uniaxial compressive strength units. The equation used depends on the type of device used, the size of the media measured, and the position of the tool when taking HR values. In this study, the most suitable equation considered for the acquisition of UCS values was Equation 1 (Dinçer et al., 2004):
Several rock samples were taken from the study area to validate the accuracy of UCS values generated by Schmidt Hammer. The rock samples will be tested in the laboratory to find out the UCS value as well. The stratified random sampling method was used in rock sampling, where the population was divided into several groups based on lithology. Then, from each lithology, 1 (one) or 2 (two) random samples will be taken in a boulder size using the geological hammer. All UCS values generated by the Schmidt Hammer at 17 stations would be considered proper for use if equivalent to the UCS values resulted from the laboratory. The classification of UCS value from rock materials is shown in Table 1.
Table 1. Uniaxial Compressive Strength (UCS) classification (Bieniawski, 1989)
|
Description |
Compressive Strength (MPa) |
RMRb value |
|
Extremely strong |
>250 |
15 |
|
Very strong |
100-250 |
12 |
|
Strong |
50–100 |
7 |
|
Moderate |
25–50 |
4 |
|
Weak |
10–25 |
2 |
|
Very weak |
2–10 |
1 |
|
Extremely weak |
1–2 |
0 |
Rock Quality Designation (RQD)
The determination of indirect RQD was using the volumetric joints method proposed by Palmstrom (1982), this method is used if there is no borehole core available and measured at the site as illustrated in Figure 2. The RQD value was estimated indirectly through the calculation of solid volumetric per one cubic meter of rock mass with Equation 2 (Palmström, 1982):
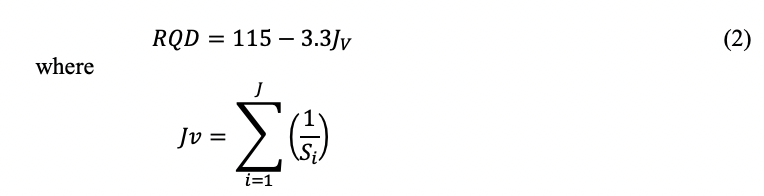
Si is the average value of the joints spacing in meters of the i number of joints sets, while J is the total number of joints sets. Table 2 below shows the classification of RQD values.
Table 2. Rock Quality Designation (RQD) classification (Bieniawski, 1989)
|
Description |
RQD |
RMRb value |
|
Very good |
90–100 |
20 |
|
Good |
75–90 |
17 |
|
Moderate |
50–75 |
13 |
|
Bad |
25–50 |
8 |
|
Very Bad |
<25 |
3 |
The space of discontinuous planes
The discontinuous plane spacing was measured perpendicular to one discontinuous plane until it meets the other discontinuous plane. The form of the discontinuous plane could be a joint, shear zone, minor fracture, or other weak surfaces. Between the discontinuous plane, there are gaps or apertures in general, but sometimes there was a very tight discontinuous plane without visible gaps. There were 5 (five) classes of discontinuous plane spacing as shown in Table 3.
Table 3. The space of discontinuous planes classification (Bieniawski, 1989)
|
Description |
Space (m) |
RMRb value |
|
Very wide |
> 2 |
20 |
|
Wide |
0,6–2 |
15 |
|
Moderate |
0,2–0,6 |
10 |
|
Tight |
0,06–0,2 |
8 |
|
Very tight |
< 0,06 |
5 |
The condition of discontinuous planes
Parameters measured in a discontinuous plane condition were including the length, the gaps, the surface roughness, the filling material, and the weathering condition. The 5 (five) criteria have each value according to the conditions found in the field, then weighted together to get the overall value of the discontinuous plane conditions. Table 4 describes the criteria of the parameters.
Table 4. The condition of discontinuous plane classification (Bieniawski, 1989)
|
Parameter |
RMRb value |
||||||
|
Length |
<1 m (6) |
1–3 m (4) |
3–10 m (2) |
10–20 m (1) |
>20 m (0) |
|
|
|
Gaps |
- (6) |
<0,1 mm (5) |
0,1–1 mm (4) |
1–5 mm (1) |
>5 mm (0) |
|
|
|
Roughness |
Very rough (6) |
Rough (5) |
Moderate (3) |
Smooth (2) |
Very smooth (0) |
|
|
|
Filling |
- (6) |
Hard |
Soft |
|
|||
|
<5 mm (4) |
>5 mm (2) |
<5 mm (2) |
>5 mm (0) |
|
|||
|
Weathering |
None (6) |
Slightly weathered (5) |
Moderate (3) |
Mainly weathered (1) |
Very weathered (0) |
|
|
The groundwater conditions
If it is not possible to measure the groundwater discharge and pore pressure in the field, groundwater conditions could be observed generally based on the conditions found on rock surfaces. These general conditions could be a dry, humid, wet, dripping, and flowing surface (Table 5).
Table 5. The groundwater conditions classification (Bieniawski, 1989)
|
Inflow/10 m(lt/minute) |
- |
<10 |
10–25 |
25–125 |
> 125 |
|
Pore pressure ratio |
0 |
0–0,1 |
0,1–0,2 |
0,2–0,5 |
>0,5 |
|
General condition |
Dry |
Humid |
Wet |
Dripping |
Flowing |
|
RMRb value |
15 |
10 |
7 |
4 |
0 |
Based on the total of the RMRb values obtained from the parameters above, the rock mass classification was divided into 5 (five) classes as shown in Table 6.
Table 6. Rock Mass Rating basic (RMRb) (Bieniawski, 1989)
|
RMRb value |
81–100 |
61–80 |
41–60 |
21–40 |
< 20 |
|
Rock quality |
Very good |
Good |
Moderate |
Bad |
Very bad |
Slope height
The height of the slope mentioned here is the vertical slope height. According to Pierson (1991), slope height measurements were carried out from the highest point to the point where the fall of the rock was estimated. The classification method used was the modification of Budetta (2004) classification. The classification of Budetta (2004) was modified because it was considered to give a relatively low value for the hazard rating. Slope with a height of more than 10 meters logically can be categorized as very dangerous, especially if their geometry is almost vertical and without vegetation cover as the slopes found in the study area. The classification of the slope height is shown in Table 7.
Table 7. The modified slope height classification
|
Slope height (m) |
≤2,50 |
2,51–5,00 |
5,01–7,50 |
7,51–10,00 |
>10 |
|
Weight |
3 |
9 |
27 |
54 |
81 |
|
Hazard rating |
Very low |
Low |
Moderate |
High |
Very high |
Rock block size
A rock block could be a boulder or small group of independently moving rocks that separated with their rock mass body by the presence of discontinuities (Sazid, 2019). The size of a rock block significantly influences how much of the impact a rock can cause when it falls over an object underneath. Rock block size measurements must be able to represent the type of rockfall that most likely to occur. If there is a rockfall from the previous falling rocks at the observation point, then the measurement goes into the rockfall volume per event. But if there is no record of falling rocks that have occurred at the observation point, then it can be represented by measurements of the block (diameter) of rocks on the slope that considered to have the most potential to fall (Pierson, 1991). The weighting method used is a modification of Budetta (2004) method as shown in Table 8.
Table 8. The modified rock block size and rockfall volume classification
|
Block size (m) |
≤ 0,30 |
0,31–0,60 |
0,61–0,90 |
0,91–1,20 |
≥ 1,20 |
|
Rockfall volume (m3) |
≤ 2,30 |
2,31–4,60 |
4,61–6,90 |
6,91–9,20 |
≥ 9,20 |
|
Weight |
3 |
9 |
27 |
54 |
81 |
|
Hazard rating |
Very low |
Low |
Moderate |
High |
Very high |
3. Data Analysis
The data analysis stage was preceded by laboratory tests to obtain UCS values, which then converted to MPa units according to the classification of UCS value by Bieniawski (1989). Followed by the geomechanics analysis of RMRb and SMR. To obtain the SMR value, the value of RMRb were calculated with SMR Adjustment Factors using Equation 3 (Romana, 1993):

SMR Adjustment Factors (F1, F2, F3, and F4) are additional weights given based on the orientation of the discontinuous plane on an outcrop/slope (Romana, 1993) with the detailed description in Table 9. The SMR Adjustment Factors consist of:
- F1 which describes the parallelism between the joint direction/strike and the slope direction/strike;
- F2 which describes the steepness/dip of the slope;
- F3 which describes the relationship of the joints dip and the slopes steepness/dip; and
- F4 which is an adjustment score for the excavation method on the slope.
The next step was the making of stereographic projections from discontinuous planes in 2 (two) dimensions to model the discontinuous planes on outcrops/slopes found in the field. This step was intended to determine rockfall types that could happen in a planar, wedge, or toppling type, which was used later to calculate the SMR Adjustment Factors.
|
Table 9. SMR Adjustment Factor classification and the hazard rating (Romana, 1993) |
||||||
|
Slope condition |
Very good |
Good |
Moderate |
Bad |
Very bad |
|
|
F1 |
P [αj - αs] |
>30⁰ |
20⁰–30⁰ |
10⁰–20⁰ |
5⁰–10⁰ |
<5⁰ |
|
T [αj - αs - 180⁰] |
||||||
|
W [αi - αs] |
||||||
|
P, W, T value |
0,15 |
0,40 |
0,70 |
0,85 |
1,00 |
|
|
F2 |
P [βj] |
<20⁰ |
20⁰–30⁰ |
30⁰–35⁰ |
35⁰–45⁰ |
>45⁰ |
|
W [βi] |
||||||
|
P, W value |
0,15 |
0,40 |
0,70 |
0,85 |
1,00 |
|
|
T value |
1,0 |
1,0 |
1,0 |
1,0 |
1,0 |
|
|
F3 |
P [βj - βs] |
>10⁰ |
0⁰–10⁰ |
0⁰ |
0⁰– (-10)⁰ |
<(-10)⁰ |
|
W [βi - βs] |
||||||
|
T [βj + βs] |
<110⁰ |
110⁰–120⁰ |
>120⁰ |
--- |
--- |
|
|
P, W, T value |
0 |
-6 |
-25 |
-50 |
-60 |
|
|
F4 |
Excavation Method |
|||||
|
Method |
Natural slope |
Pre-splitting |
Minor blasting |
Mechanical excavation |
Major blasting |
|
|
Weight |
15 |
10 |
8 |
0 |
-8 |
|
|
Information: |
||||||
|
P = Planar failure |
αs = slope strike |
|||||
|
W = Wedge failure |
αj = discontinuous plane strike |
|||||
|
T = Toppling failure |
αi = plunge direction of discontinuous plane |
|||||
|
βs = slope dip |
||||||
|
βj = discontinuous plane dip |
||||||
|
βi = plunge dip of discontinuous plane |
||||||
The score of SMR (Table 10) can be referred to provide recommendations on the required slope reinforcement method. Slopes with very good stability will not need a reinforcement system, whereas those with lower levels of stability will require a variety of reinforcement types (Romana, 1993).
Table 10. Slope Mass Rating (SMR) description (Romana, 1993)
|
Class |
I |
II |
III |
IV |
V |
|
SMR score |
81–100 |
61–80 |
41–60 |
21–40 |
0–20 |
|
Weight |
3 |
9 |
27 |
54 |
81 |
|
Description |
Very good |
Good |
Moderate |
Bad |
Very bad |
|
Stability |
Very stable |
Stable |
Moderate |
Not stable |
Very not stable |
|
Structure |
None |
A few of the blocks |
Some or many of the block |
Planar or major failure |
Big planar plane or soil |
The weighting of rockfall hazard parameters was carried out using rockfall hazard classification, which is a modified weighting method of the Rockfall Hazard Rating System (RHRS) by Pierson (1991) and Budetta (2004). SMR weight along with slope height and rock block size weights were added up and classified into 5 (five) categories of rockfall hazard. The classification of rockfall hazards based on the total weight is shown in Table 11.
Table 11. The classification of the rockfall hazard
|
Total weight |
Class |
|
9,0–55,8 |
Very low |
|
55,9–102,6 |
Low |
|
102,7–149,4 |
Moderate |
|
149,5–196,2 |
High |
|
196,3–243,0 |
Very high |
Some of the data processing was carried out using Geographic Information System (GIS) software as well as the maps produced in this study. The verification phase was conducted by confirming the accuracy and the conformity of the data and the resulted map with actual conditions in the study area. The historical rockfall points will be overlaid over the Rockfall Hazard Zonation Map, then the number of rockfalls that occurred in each hazard class will be calculated. If there is a discrepancy, repeated field investigation and re-analysis need to be conducted.
1. Geological Setting
The study area is included in a series of Southern Mountains hills along the west to the east of the south coast of Java, and the northern part of the area is encountered by a lowland known as Solo Lane (van Bemmelen, 1949). The area is divided into 3 (three) geomorphological units, i.e., the karst hills, the structural hills, and the lowlands. Based on the Geological Map of Yogyakarta sheet (Rahardjo et al., 1977), the western part of the Southern Mountains is composed of volcanic rocks, volcanic clastic rocks, and carbonate rocks. Most of volcanic clastic rocks formed by the deposition of gravity sediment that approximately 4000 meters thick. The study area compiled by the 4 (four) rock formations in the region, named respectively based on the age are Nglanggran Formation, Wonosari Formation, Young Merapi Volcanic Mount Deposition, and Alluvium Deposition.
Geological structures founded on the Geology Map of Yogyakarta sheet (Rahardjo et al., 1977) are joints, faults, and folds. The folds consist of anticline and syncline, which are having a general direction northeast-southwest and east-west, and some other trending is northwest-southeast. Faults are generally a normal fault with antithetic fault block patterns (van Bemmelen, 1949). The geological structures developed are shear faults and normal faults (Figure 3). The Opak Fault cut Yogyakarta and Wonosari old andesite as a constituent of fault cutting structures. Meanwhile, in the east of Opak River, there are Semilir and Nglanggran Formation that also involved in the fault system (Rahardjo et al., 1997).
The number of slopes found on the main roadside was 17 slopes with varying height and length. Each slope becomes an observation point so that in total 17 stations were analyzed in this study. The naming of these units was based on the lithology of the rocks. There were only 4 (four) geological units found from the 17 stations in the study area (Figure 4). These 4 (four) geological units, i.e., andesite, crystalline limestone, fragmental limestone, and reefal limestone (Rahardjo et al., 1977), used as the analysis unit in the analysis stage.
The number of stations has changed dramatically (closer to each other) start from the middle to the eastern end of the study area. However, the western part of the study area was still analyzed for some reason. The presence of volcanic rock outcrops with a significant height is a rarely found object in this area. Station 1, composed of an andesite unit, was expected to provide a distinct comparison of rock mass properties and quality with the three types of limestones units. Moving forward, composed of loose gravel to boulder sediments, most of the rock mass of the outcrops/slopes lied between Station 1 and 2 cannot be measured because the rocks were not compact, too soft, and easily destroyed. This road segment will still be mapped because several locations were considered to have the landslides potentials.
2. Rock Mass Rating basic (RMRb) Analysis
Based on Hardness Rebound (HR) values generated by Schmidt Hammer in the field measurement, the andesite unit has the highest UCS value of 131.20 MPa (very strong). The lowest average UCS value of 6.52 MPa (very weak) owned by the reefal limestone unit. Crystalline limestone unit included in the weak class with an average UCS value of 14.92 MPa. The fragmental limestone unit has a higher UCS value compared to other limestone types (crystalline and reefal) and categorized as the moderate class with the average UCS value of 35.33 MPa. The UCS values generated by Schmidt Hammer were equivalent to the UCS value resulted from laboratory tests (Table 12).
Table 12. Comparison of UCS values resulted from Schmidt Hammer and laboratory test
|
Unit |
Average UCS value generated by Schmidt Hammer (MPa) |
UCS value resulted from laboratory test (MPa) |
|
Andesite |
131.20 (1 stations) |
122.30 |
|
Crystalline limestone |
14.92 (5 stations) |
14.61 |
|
Fragmental limestone |
35.33 (6 stations) |
36.52 |
|
Reefal limestone |
6.52 (5 stations) |
6.96 |
Indirect RQD measurements were carried out in all 17 stations because there was no borehole available. Based on the measurements, the RQD values in all stations categorized as good–very good. The 14 stations have very good RQD values, while 3 (three) other stations that are Station 1 (composed of andesite units) and Station 7 & 10 (composed of fragmental limestone units) have good RQD values. Table 13 shows the details of indirect RQD measurements in the study area.
Table 13. Indirect RQD measurements
|
Sta. |
Space of discontinuous planes (m) |
Jv |
RQD (%) |
Description |
|||
|
Set 1 |
Set 2 |
Set 3 |
Set 4 |
||||
|
1 |
0.415 |
0.200 |
0.240 |
|
11.560 |
76.850 |
Good |
|
2 |
1.043 |
0.636 |
0.300 |
|
3.025 |
100.000 |
Very good |
|
3 |
0.477 |
0.667 |
1.167 |
|
4.460 |
100.000 |
Very good |
|
4 |
0.676 |
0.750 |
0.515 |
|
4.740 |
99.360 |
Very good |
|
5 |
0.453 |
|
|
|
2.200 |
100.000 |
Very good |
|
6 |
1.200 |
|
|
|
0.833 |
100.000 |
Very good |
|
7 |
0.170 |
0.237 |
|
|
10.100 |
81.670 |
Good |
|
8 |
0.580 |
|
|
|
1.720 |
100.000 |
Very good |
|
9 |
0.560 |
0.820 |
|
|
3.000 |
100.000 |
Very good |
|
10 |
0.380 |
0.730 |
0.710 |
0.165 |
11.400 |
77.400 |
Good |
|
11 |
0.340 |
0.500 |
|
|
4.940 |
98.700 |
Very good |
|
12 |
0.350 |
1.660 |
|
|
3.450 |
100.000 |
Very good |
|
13 |
1.360 |
1.067 |
|
|
1.670 |
100.000 |
Very good |
|
14 |
0.240 |
|
|
|
4.160 |
100.000 |
Very good |
|
15 |
0.970 |
|
|
|
1.030 |
100.000 |
Very good |
|
16 |
2.110 |
1.440 |
|
|
1.160 |
100.000 |
Very good |
|
17 |
1.625 |
0.625 |
|
|
2.215 |
100.000 |
Very good |
The spaces of discontinuous planes vary between 0.17–2.11 meters, with lengths between 0.47–7.49 meters, and various gaps from <0.01 to 76 millimeters. The surface roughness of the discontinuous planes is not the same between the sets. Some are very smooth, smooth, moderate to rough, with slightly to very weathered conditions. The filling of discontinuous planes varies from soft filling with <5 millimeters size to hard filling with >5 millimeters size, except discontinuous planes found at Stations 1, 3, and 8 that have no filling.
The groundwater conditions were observed based on general conditions found on rock surfaces of outcrops/slopes and categorized as dry, moist, wet, dripping, and flowing (Bieniawski, 1989). The groundwater conditions in the study area were dominated by humid and dry on rock surfaces, but there was 1 (one) exception station with a significantly different state. Station 1, which is composed of andesite unit, has a flowing groundwater condition (Figure 5). Meanwhile, the other slopes composed of crystalline, fragmental, and reefal limestone have between dry and moist groundwater conditions. Table 14 shows the groundwater conditions in the study area.
Table 14. Groundwater condition found on the slopes
|
General condition |
Number of locations |
Station |
|
Dry |
5 |
6, 7, 8, 9, 12 |
|
Humid |
11 |
2, 3, 4, 5, 10, 11, 13, 14, 15, 16, 17 |
|
Wet |
0 |
- |
|
Dripping |
0 |
- |
|
Flowing |
1 |
1 |
3. Stereographic projection analysis
A discontinuous plane and the kinematics mechanism can be analyzed using the stereographic projection (Goodman, 1989). According to Ragan (2009), the stereographic projection is a two-dimensional picture or a projection of a sphere surface that used to describe the geometry position or the orientation of the planes and lines. The method used in stereographic projection in this study was the Equal Area Projection using Schmidt Net as the projection plane and created using Dips v.5.1 software.
In this study, the stereographic projection was also carried out to determine the rockfall types that could or had occurred in the discontinuous planes on a slope, i.e., planar failure, wedge failure, and toppling failure, as mentioned in the Slope Mass Rating (SMR) analysis by Romana (1993). Furthermore, this stereographic projection analysis was also conducted to find out whether a rock volume from a slope could fall naturally due to the condition of the discontinuous planes or not. If the parallelism of the discontinuous plane orientation and the slope face orientation (resulted from the cutting hills) was known to be in a stable condition, then without any disturbance from natural phenomena or human disturbances, the rockfall could not happen by itself and vice versa.
More information obtained from the stereographic projection of the 17 stations was that the rockfall type of wedge failure has more potential and occurred more frequently than the planar failure and toppling failure types. It was resulted due to a large number of discontinuous plane sets, which have many variations of orientation and causing intersections between discontinuous planes. Some examples of stereographic projections from 3 (three) stations were shown in Figure 6. The detail of slopes and discontinuous planes orientation (strike and dip), and also the failure type of each station were shown in Table 15.
Table 15. Slopes and discontinuous planes orientations (strike/dip) and the failure types
|
Sta. |
Slopes orientation (strike/dip) |
Discontinuous planes orientation (strike/dip) |
|||
|
Set 1 |
Set 2 |
Set 3 |
Set 4 |
||
|
1 |
N150⁰E/85⁰ |
N220⁰E/40⁰ (wedge) |
N50⁰E/30⁰ (wedge) |
N67⁰E/15⁰ (wedge) |
|
|
2 |
N87⁰E/88⁰ |
N343⁰E/90⁰ (toppling) |
N37⁰E/67⁰ (wedge) |
N80⁰E/35⁰ (wedge) |
|
|
3 |
N120⁰E/85⁰ |
N62⁰E/20⁰ (planar) |
N240⁰E/84⁰ (wedge) |
N43E⁰/87⁰ (wedge) |
|
|
4 |
N/200⁰E/70⁰ |
N193⁰E/62⁰ (planar) |
N290⁰E/28⁰ (wedge) |
N110⁰E/50⁰ (wedge) |
|
|
5 |
N105⁰E/80⁰ |
N120⁰E/42⁰ (planar) |
|
|
|
|
6 |
N93⁰E/76⁰ |
N97⁰E/24⁰ (planar) |
|
|
|
|
7 |
N132⁰E/64⁰ |
N48⁰E/33⁰ (wedge) |
N222⁰E/47⁰ (wedge) |
|
|
|
8 |
N144⁰E/76⁰ |
N253⁰E/70⁰ (planar) |
|
|
|
|
9 |
N183⁰E/78⁰ |
N324⁰E/18⁰ (planar) |
N115⁰E/66⁰ (planar) |
|
|
|
10 |
N53⁰E/66⁰ |
N143⁰E/6⁰ (planar) |
N317⁰E/48⁰ (planar) |
N138⁰E/42⁰ (wedge) |
N143⁰E/63⁰ (wedge) |
|
11 |
N83⁰E/82⁰ |
N87⁰E/22⁰ (planar) |
N355⁰E/90⁰ (toppling) |
|
|
|
12 |
N24⁰E/83⁰ |
N28⁰E/3⁰ (planar) |
N341⁰E/47⁰ (planar) |
|
|
|
13 |
N182⁰E/74⁰ |
N87⁰E/85⁰ (toppling) |
N189⁰E/65⁰ (planar) |
|
|
|
14 |
N124⁰E/76⁰ |
N132⁰E/32⁰ (planar) |
N48⁰E/61⁰ (wedge) |
|
|
|
15 |
N87⁰E/75⁰ |
N274⁰E/82⁰ (toppling) |
|
|
|
|
16 |
N127⁰E/84⁰ |
N37⁰E/33⁰ (wedge) |
N213⁰E/52⁰ (wedge) |
N220⁰E/11⁰ (planar) |
|
|
17 |
N110⁰E/70⁰ |
N116⁰E/53⁰ (planar) |
N24⁰E/33⁰ (planar) |
|
|
Rose Diagram, which is a graphical form that concludes the entire stereographic projection analysis of 17 stations, is shown in Figure 7. These Rose Diagrams were created using Dips v.5.1 software and carried out to determine the dominant strike orientation of the discontinuous plane in the slopes. The diagrams show that the dominant strike orientation of the discontinuous planes was trending northeast-southwest (N 60⁰E) in the andesite unit (Figure 7a), northeast-southwest (N 45⁰E) in the crystalline limestone units (Figure 7b), northwest-southeast (N 325⁰E) in the fragmental limestone units (Figure 7c), and northeast-southwest (N 40⁰E) in the reefal limestone units (Figure 7d). In general, the most dominant strike orientation of all discontinuous planes in the study area was trending northeast-southwest (N 45⁰E).
4. Slope Mass Rating (SMR) analysis
Road segments without slopes were not classified because the assessment of the slope mass quality cannot be conducted without the rock slopes as the observed objects. The summary of the classified slopes according to the Slope Mass Rating (SMR) by Romana (1993) is shown in Table 16. Overall, there were none of good quality mass slopes in the study area. The measured SMR score ranged from normal to very bad.
Table 16. The summary of measured SMR
|
Sta. |
Lithology |
RMRbscore |
SMR Adjustment Factors |
SMR score |
Class |
|||
|
F1 |
F2 |
F3 |
F4 |
|||||
|
1 |
Andesite |
60.33 |
0.72 |
0.56 |
-60.00 |
15.00 |
51.27 |
Normal |
|
2 |
Crystalline limestone |
61.33 |
0.72 |
0.90 |
-48.33 |
0.00 |
30.19 |
Bad |
|
3 |
Crystalline limestone |
67.33 |
0.67 |
0.80 |
-53.33 |
0.00 |
38.87 |
Bad |
|
4 |
Crystalline limestone |
61.33 |
0.72 |
0.80 |
-56.67 |
0.00 |
28.87 |
Bad |
|
5 |
Crystalline limestone |
58.00 |
0.70 |
0.85 |
-60.00 |
0.00 |
22.30 |
Bad |
|
6 |
Crystalline limestone |
68.00 |
1.00 |
0.40 |
-60.00 |
0.00 |
36.50 |
Bad |
|
7 |
Fragmental limestone |
60.50 |
0.57 |
0.85 |
-60.00 |
0.00 |
31.17 |
Bad |
|
8 |
Fragmental limestone |
73.00 |
0.85 |
1.00 |
-25.00 |
0.00 |
51.75 |
Normal |
|
9 |
Fragmental limestone |
71.50 |
0.57 |
0.57 |
-60.00 |
0.00 |
51.66 |
Normal |
|
10 |
Fragmental limestone |
59.50 |
0.15 |
0.75 |
-57.50 |
0.00 |
53.03 |
Normal |
|
11 |
Fragmental limestone |
55.00 |
0.57 |
0.70 |
-55.00 |
0.00 |
35.16 |
Bad |
|
12 |
Fragmental limestone |
68.00 |
0.57 |
0.57 |
-60.00 |
0.00 |
48.16 |
Normal |
|
13 |
Reefal limestone |
53.00 |
0.92 |
1.00 |
-37.50 |
0.00 |
18.31 |
Very bad |
|
14 |
Reefal limestone |
48.00 |
0.57 |
0.85 |
-60.00 |
0.00 |
18.67 |
Very bad |
|
15 |
Reefal limestone |
56.00 |
0.85 |
1.00 |
-25.00 |
0.00 |
34.75 |
Bad |
|
16 |
Reefal limestone |
54.15 |
0.43 |
0.62 |
-60.00 |
0.00 |
38.15 |
Bad |
|
17 |
Reefal limestone |
53.00 |
0.92 |
0.85 |
-60.00 |
0.00 |
5.82 |
Very bad |
The andesite unit represented by 1 (one) station of observation point has SMR value of 51.27 and categorized as normal class. The RMRb value of andesite units was not the largest of the entire sample, but the type of slope excavation method (natural) in this station gives an extra point to the SMR score. Natural exposed slope was only found at this station.
The crystalline limestone unit represented by 5 (five) stations of observation point had SMR score of 22.30–38.87 and categorized as bad class. Furthermore, the fragmental limestone unit represented by 6 (six) stations of observation point has SMR score of 31.17–53.03 and classified as normal to bad class. The highest average score of RMRb and SMR were found in fragmental limestone unit, proven by hard and compact rock conditions and non-complex discontinuous plane conditions.
The reefal limestone unit represented by 5 (five) stations of observation point has SMR score of 5.82–38.15, which is classified as bad to very bad. This unit has the lowest average score of RMRb and SMR, proven by weaker rock hardness, accompanied by holes of water dissolution, and complex condition of the developed discontinuous planes. The result of the SMR zonation is shown in Figure 8.
Most of the slopes at the study site need special attention from the community and local government because they have poor slope strengths and unstable conditions. These conditions may increase the risk and hazard level of rockfall and lead to physical and social losses. SMR values obtained in this study can be used as a reference to find the most suitable slope reinforcement method. The relationship between the SMR scores with the recommended slope reinforcement method is presented in Table 17.
Slope reinforcement should be installed on a slope with SMR value below 80 (good–very bad classes of SMR). That means even though a slope has a stable condition, slope reinforcement still needs to be installed to avoid the rockfall threats from external factors such as natural disasters and human disturbances. Fence, nets, ditch need to be installed on slopes that could potentially drop small rocks. These types of supports suitable for installation in Stations 8, 9, and 12. Shotcrete was needed to cover fragile and weak parts of the slopes and suitable for Stations 3, 7, and 10.
Anchors and bolts can be installed on a slope with very hard composing rock as in Station 1. Meanwhile, the systematic shotcrete or the concrete coating method should be installed on slopes formed from weathered and/or softer rock types and easily destroyed, such as in Stations 2, 4, 5, 6, 11, 15, and 16. This fragile character is often found in excavated karst hills as in the study area. If the slopes have badly weathered and/or has experienced a lot of rockfalls, then the most needed slope reinforcement is an anchored wall or even need re-excavation as in Stations 13, 14, and 17.
Table 17. Recommended support according to SMR score (Romana, 1993).
|
SMR Score |
Support |
|
91–100 |
None |
|
81–90 |
None; scaling |
|
71–80 |
None; toe ditch or fence; spot bolting |
|
61–70 |
Toe ditch or fence; nets; spot or systematic bolting |
|
51–60 |
Toe ditch and/or nets; spot or systematic bolting; spot shotcrete |
|
41–50 |
Toe ditch and/or nets; systematic bolting; anchors; systematic shotcrete; toe wall and/or dental concrete |
|
31–40 |
Anchors; systematic shotcrete; toe wall and/or concrete; re-excavation; drainage |
|
21–30 |
Systematic reinforced shotcrete; toe wall and/or concrete; re-excavation; deep drainage |
|
11–20 |
Gravity or anchored wall; re-excavation |
However, not only SMR scores used to assess rockfall hazards in this study. Two other parameters (i.e., slope height and rock block size) were also considered as intrinsic factors that could significantly affect the level of rockfall hazards. Slope height and rock block size will be explained further in the next section.
5. Slope Height and Rock Block Size
Rockfall that occurred from a higher slope possesses greater energy than those that occurred from a lower slope. So it is necessary to measure the slope height considering a higher slope was expected to have a higher level of hazard. Based on the field measurements, the crystalline limestone unit has moderate to high slope height hazard category (Figure 9a). Reefal limestone unit has varied slope height hazard categories from low, moderate, and high. A significant difference in slope height between the units will affect the rockfall hazard weight.
The block size is a very significant parameter in rock mass behavior (Barton, 1991) and considered practically affect the rockfall hazard assessment in the study area because of its variations. The rock block size on the slopes varies with the rock diameter size of 0.2 to 1.3 meters. A very high hazard category of rock block size was found in Station 13 (Figure 9b). From the evidence and remnants, rockfall was indicated to had occurred in the location. Rock block size in other stations varies with a very low to high hazard category. Combined with SMR and slope height values, the weighting of rock block size will result in more variations of the rockfall hazard assessment.
6. Rockfall Hazard Zonation
The very low class of rockfall hazard zonation has the greatest percentage of 83.83%, road segments without slopes were also classified in this class. The second-largest percentage is the moderate hazard class by 7.16%, followed by low hazard class by 4.82% and high hazard class with the smallest portion of 4.19%. On the different scenario, a different result was shown when the roads without slopes were not included. The largest portion owned by the moderate hazard class by 36.60%, followed by low hazard class by 24.64%. Third, there was high hazard class with a percentage of 21.39%, followed by very low hazard class with the smallest portion of 17.38%. The most significant parameter that influences the rockfall hazard zonation was the SMR, with a percentage of 53.42% of total rockfall hazard weight. Followed by slope height and rock block size with the percentages of 24.27% and 22.30%, respectively. Figure 10 shows the Rockfall Hazard Zonation Map.
Most rockfall hazard zonation class at overall stations experience reduced levels compared to their SMR class. Only Station 2 and Station 6 that classified in the same class level (high) in both the SMR and rockfall hazard zonation classes. It proves that the slope height and rock block size parameters affected the final result of rockfall hazard zonation. For example, Station 3 has a bad SMR class, but the size of the rock block at this station has low weight because the largest diameter found was only 0.6 meters (classified as low hazard of rock block size). Therefore, the total weight of the rockfall hazard zonation at Station 3 was classified as low class. Another example, Stations 8 and Station 9 have normal SMR class, but the slope height at both stations did not reach 5 (five) meters (classified as low hazard of slope height). Hence, the final result of rockfall hazard zonation at Station 8 and Station 9 was classified as very low class. Table 18 provides a summary of rockfall hazard classes with the condition of each parameter.
Table 18. The summary of rockfall hazard class and the parameters.
|
Hazard class |
Lithology |
SMR score |
Slope height (m) |
Size of rock block (m) |
Stations |
|
Very low |
Fragmental limestone |
51.66–51.75 (normal) |
2.85–4.57 |
0.2–0.3 |
8, 9 |
|
Low |
Andesite, crystalline, and fragmental limestones |
31.17–53.03 (normal–bad) |
3.52–5.28 |
0.2–0.7 |
1, 3, 7, 10, 12 |
|
Moderate |
Crystalline, fragmental, and reefal limestones |
5.82–38.15 (bad–very bad) |
4.26–8. 96 |
0. 3–1.0 |
4, 5, 11, 14, 15, 16, 17 |
|
High |
Crystalline and reefal limestones |
18.31–36.50 (bad–very bad) |
3.62–7.82 |
0.7–1.3 |
2, 6, 13 |
There was a 'landslide potential' category with purple color on the Rockfall Hazard Zonation Map. The slopes could be assumed to have landslide potential if there was evidence of occurred landslide and also none of the slope reinforcement installed yet on the slopes. The slope mass quality at the location automatically could not be measured because the rocks that composed the slopes had been destroyed and/or collapsed. Therefore, slopes with landslide potential were not included in the rockfall hazard classes, but they still need extra awareness and marked.
The extension of Girijati and Parangtritis Fault which forms a semi-circular crown structure (Prasetyadi et al., 2011) produced paleo-landslides deposits with estimated dimensions of 2,700 m long, 1,500 m wide, and 810 million m3 of landslide volumes (Husein et al., 2010) in a gravel–boulder grain size. These landslide deposits are very prone to move and/or collapse and believed to be one of the causes of most recent landslide events in the study area. On these landslide potential areas, the stakeholders should consider to re-excavating or at least covering the slopes with an anchored wall. Figure 11 below shows the occurred landslides at several locations in the study area.
Historical rockfall points were overlaid over the Rockfall Hazard Zonation Map to validate the predicted hazard zones, and the number of rockfalls that occurred in each hazard class was calculated. Information about occurred rockfalls was obtained from the local authorities of transportation, facilities, and infrastructure. In some stations without administrative data sources, the number of rockfalls estimated based on observations around the stations and information from residents. The estimation was carried out by observing the holes in the former slope or the rock blocks found on the trench/ditch. From this validation, rockfalls have occurred in the classes of very low, low, moderate, and high with the percentages of 1.75%, 7.02%, 26.32%, and 64.91%, respectively (Figure 12). Since 91.23% of the rockfall occurred in the moderate and high hazard classes, the Rockfall Hazard Zonation Map considered reliable to predict future rockfall.
Based on 17 measurement stations, there were 4 (four) rockfall hazard classes in the study area, i.e., very low, low, moderate, and high. The very low class, which also included road segments without slope, has the largest percentage of 83.83% that associated with normal SMR score, slope height very low to low, and block size between 0.2–0.3 m. Followed by moderate class with a percentage of 7.16% that associated with bad to very bad SMR score, slope height low to high, and block size between 0.3–1.0 m. In the third position, taken by a low class with a percentage of 4.28% that associated with normal to bad SMR score, slope height low to moderate, and block size between 0.2–0.7 m. The last position was taken by high class with a percentage of 4,19% that associated with bad to very bad SMR score, slope height low to high, and block size between 0.7–1.3 m.
Based on the percentage of the total rockfall hazard weight, SMR was assumed as the most significant parameter that influences the rockfall hazard zonation, followed by slope height and rock block size, respectively. This study also identified several landslide potential zones, which included slopes that have experienced landslide but still have the potential to re-occur and also slopes with destroyed composing rocks and/or easily collapse. Historical rockfall events were overlaid over the Rockfall Hazard Zonation Map to validate the predicted hazard zone. Since 91.23% of the rockfall occurred in the moderate and high hazard classes, the Rockfall Hazard Zonation Map considered reliable to predict future rockfall.
Even in a stable condition, slope reinforcement still needed to be installed on the slopes to avoid the rockfall threats triggered by external factors such as natural disasters and human disturbances. Fence, nets, ditch need to be installed on slopes that could potentially drop small rocks. Spot shotcrete was needed to cover the fragile and weak parts of the slopes. Anchors and bolts can be installed on a slope with very hard composing rock. Meanwhile, the systematic shotcrete or the concrete coating method should be installed on slopes formed from weathered and/or softer rock types and easily destroyed. If the slopes have badly weathered and/or has experienced a lot of rockfalls, then the most needed slope reinforcement is an anchored wall or even need re-excavation.
Availability of data and materials
The DEM data utilized in this study are freely available from USGS NASA Shuttle Radar Topography Mission Version 3.0 Global 1 arc second (https://earthexplorer.usgs.gov). The other datasets used and/or analyzed during the current study are available from the corresponding author on reasonable request.
Competing interest
The authors declare that they have no competing interests.
Funding
Funding of the entire work was personal.
Authors' contributions
Affiliations
Research Center of Oceanography, Indonesian Institute of Science
Research Center of Geotechnology, Indonesian Institute of Science
Contributions
KT conducted field investigation and sampling in 2014, analyzed the data, created the maps, compiled and drafted the manuscript. KH carried out some geotechnical analyses in the research work. Both authors read and approved the final manuscript.
Corresponding author
Correspondence to Karlina Triana.
Acknowledgements
The authors thank to Dr.rer.nat Doni Prakasa Eka Putra and Dr. Wahyu Wilopo from Gadjah Mada University for their support and encouragements, and also thank to the two anonymous reviewers for their constructive comments that improved the manuscript. At last, authors would like to acknowledge all of the agencies specially, Geological Research and Development Center of Indonesia and USGS NASA for obtaining the maps and data required for the study.
Ansari, M. K., Ahmad, M., Singh, R., & Singh, T. N. (2016). Rockfall Hazard Rating System along SH-72: a case study of Poladpur–Mahabaleshwar road (Western India), Maharashtra, India. Geomatics, Natural Hazards and Risk, 7(2), 649–666. https://doi.org/10.1080/19475705.2014.1003416
Barton, N. (1991). Scale effects or sampling bias? Publikasjon - Norges Geotekniske Institutt, 27(6), 331. https://doi.org/10.1016/0148-9062(90)91074-h
Bieniawski, Z. T. (1989). Engineering rock mass classifications: a complete manual for engineers and geologists in mining, civil, and petroleum engineering (p. 250). John Wiley & Sons.
Budetta, P. (2004). Assessment of rockfall risk along roads. Natural Hazards and Earth System Science, 4, 71–81. https://doi.org/10.5194/nhess-4-71-2004
Dinçer, I., Acar, A., Çobanoğlu, I., & Uras, Y. (2004). Correlation between Schmidt hardness, uniaxial compressive strength and Young’s modulus for andesites, basalts and tuffs. Bulletin of Engineering Geology and the Environment, 63(2), 141–148. https://doi.org/10.1007/s10064-004-0230-0
Goodman, R. E. (1989). Introduction to Rock Mechanics Second Edition. In Engineering Geology (p. 289). https://doi.org/10.1016/0013-7952(82)90015-1
Gracchi, T., Lotti, A., Saccorotti, G., Lombardi, L., Nocentini, M., Mugnai, F., Gigli, G., Barla, M., Giorgetti, A., Antolini, F., Fiaschi, A., Matassoni, L., & Casagli, N. (2017). A method for locating rockfall impacts using signals recorded by a microseismic network. Geoenvironmental Disasters, 4(26), 12p. https://doi.org/10.1186/s40677-017-0091-z
Hizbaron, D. R., Hadmoko, D. S., Wibawa, S., Dalimunthe, S. A., & Sartohadi, J. (2010). The Assessment of Rockfall Vulnerability, Risk, and Hazard Zonation in Kulonprogo, Yogyakarta (in Bahasa Indonesia). Forum Geografi, 24(2), 119–136. https://doi.org/10.23917/forgeo.v24i2.5021
Husein, S., Sudarno, I., Pramumijoyo, S., & Karnawati, D. (2010). Paleostress Analysis to Interpret The Landslide Mechanism: A Case Study in Parangtritis, Yogyakarta. Journal of Applied Geology, 2(2), 104–109. https://doi.org/10.22146/jag.7251
Jatmikotomo, A., Wilopo, W., Kartika, R. J. D., & Wisnumurti, L. (2015). Rockfall Vulnerability in Southern Beach, Gunungkidul District, Yogyakarta (in Bahasa Indonesia). The 8th Earth National Seminar, Academia-Industry Linkage, 693–703. https://repository.ugm.ac.id/135513/
Mustopo, M. A. B. (2015). Slope Stability Study of Settlements in Tancep Village, Ngawen, Gunungkidul District, Yogyakarta (thesis in Bahasa Indonesia) [UPN “Veteran” Yogyakarta]. http://eprints.upnyk.ac.id/1918/
Palmström, A. (1982). Volumetric Joint Count - A Successful and Simple Measure of The Degree of Rock Mass Jointing. Proceeding IV Congress, International Association of Engineering Geology, New Delhi, 221–228.
Pierson, L. A. (1991). Rockfall hazard rating system. In Transportation Research Record (p. 15). https://doi.org/10.1017/CBO9781107415324.004
Prasetyadi, C., Sudarno, I., Indranadi, V. B., & Surono. (2011). The pattern and the genesis of the geological structure of the Southern Mountains, Yogyakarta Special Province and Central Java Province (in Bahasa Indonesia). Jurnal Geologi Dan Sumberdaya Mineral, 21(2), 91–107. https://doi.org/10.33332/jgsm.2011.v21.2.91-107
Ragan, D. M. (2009). Structural geology: An introduction to geometrical techniques, 4th Edition (p. 622). Cambridge University Press. https://doi.org/10.1017/CBO9780511816109
Rahardjo, W., Sukadarrumidi, and Rosidi. 1977. Regional Geological Map of Yogyakarta Sheet, Java, Scale 1:100,000. Geological Research and Development Center, Bandung.
Romana, M. R. (1993). A geomechanical classification for slopes: slope mass rating. Comprehensive Rock Engineering. Vol. 3, 575–600. https://doi.org/10.1016/b978-0-08-042066-0.50029-x
Sazid, M. (2019). Analysis of rockfall hazards along NH-15: A case study of Al-Hada road. International Journal of Geo-Engineering, 10(1), (p. 13). https://doi.org/10.1186/s40703-019-0097-3
USGS. NASA Shuttle Radar Topography Mission Version 3.0 Global 1 arc second. https://doi.org/10.5066/F7PR7TFT.
van Bemmelen, R. W. (1949). The Geology of Indonesia. In General Geology of Indonesia and Adjacent Archipelagoes (p. 732). Government Printing Office, The Hague. https://doi.org/10.1109/VR.2018.8447558
van Westen, C. J., & Greiving, S. (2017). Multi-hazard risk assessment and decision making. In Environmental Hazards Methodologies for Risk Assessment and Management, Chapter 2. https://doi.org/10.2166/9781780407135_0031