In this study, firstly, 22 thiosemicarbazone derivatives (3a-y) were synthesized. Then, ADME parameters, pharmacokinetic properties, drug-like structures, and suitability for medicinal chemistry of these molecules were studied theoretically by using SwissADME and admetSAR programs. According to the results of these theoretical studies, it can be said that the bioavailability and bioactivity of these compounds may be high. In silico molecular docking between ligands (thiosemicarbazone derivatives) and targeted proteins (protein-78 (GRP78) for C6 and quinone reductase-2 (4ZVM for MCF 7) was analyzed using Hex 8.0.0 docking software. According to the docking data, almost all molecules had higher negative E values than Imatinib (already used as drug). For this, in vitro anticancer studies of these molecules were done. The cytotoxic activities of thiosemicarbazone derivatives (3a-y) were evaluated on C6 glioma and MCF7 breast cancer cell lines at 24 hours, and Imatinib was used as positive control. According to the results of cytotoxicity assay, it can be said that the five compounds (3b, c, f, g and m with IC50 = 10.59–9.08; Imatinib IC50 = 11.68) showed more potent cytotoxic activity than Imatinib on C6 cell line. Together with to these results ten compounds (3b, d, f, g, I, k, l, m, n and r with IC50 = 7.02–9.08; Imatinib IC50 = 9.24) had more effective cytotoxic activity against MCF7 cell line than Imatinib. Compound 3m showed the highest antiproliferative effect against C6 and MCF7 cell lines.
Research Article
Synthesis and Biological Evaluation of Thiosemicarbazone Derivatives
https://doi.org/10.21203/rs.3.rs-1738122/v1
This work is licensed under a CC BY 4.0 License
You are reading this latest preprint version
Thiosemicarbazone
C6
MCF 7
SwissADME
molecular docking
Thiosemicarbazones are compounds obtained by the reaction of thiosemicarbazide with aldehydes and ketones. Due to their biological activities and pharmacological properties, they have been the subject of many studies in recent years. Thiosemicarbazones have important pharmacological properties such as anti-cancer [1], anti-microbial [2], anti-bacterial [3], anti-fungal [4]. Thiosemicarbazones, many of whose compounds have medicinal properties, show activity against tuberculosis, leprosy, cancer, bacterial and viral infections, psoriasis, rheumatoid arthritis [5, 6] and malaria. Also, the functional groups and aromatic rings in their structures are very effective in showing the pharmacological effects of thiosemicarbazones [7]. Cancer is one of the most difficult diseases in the world and in our country in terms of response to treatment [8]. Cancer is defined as the uncontrolled division, proliferation and spread of cells in an organism. It can affect a single organ as well as spread to distant organs. Due to the problems experienced in the effectiveness of existing drugs and treatment methods used in cancer treatment and the side-effect profiles that may arise, studies on the synthesis of new molecules that can be effective in treatment have intensified [9, 10].
The aim of this study includes the synthesis, theoretical and in vitro studies of thiosemicarbazone derivatives that we think have anticancer activity potential in the literature studies. For this purpose, firstly, 22 thiosemicarbazone derivatives were synthesized. Then, ADME parameters, pharmacokinetic properties, drug-like structure, and suitability for medicinal chemistry of these compounds were tried to be explained theoretically by using SwissADME and admetSAR programs. Also, Hex 8.0.0 docking software was used to examine in silico molecular docking between ligands (thiosemicarbazone derivatives) and targeted proteins (protein-78 (GRP78) for C6 and quinone reductase-2 (4ZVM for MCF 7). Finally, the cytotoxicity of thiosemicarbazone derivatives (3a-y) was tested on C6 and MCF 7 cell lines for 24 hours, with Imatinib serving as a positive control. The purpose of performing cytotoxicity tests is to evaluate and calculate the antiproliferative effects of the synthesized derivatives against cancer cells and compare their effectiveness compared to Imatinib. According to the results obtained, compounds with high cytotoxic effects against cancer cells will benefit scientific resources and will be instrumental in the development of new ideas and projects.
General synthetic procedure for thiosemicarbazones (3a-y)
To a solution of benzaldehyde derivatives (1a–y) (0.01 mol) in warm ethanol (30 mL) was added two drops of acetic acid and thiosemicarbazide (2) (0.01 mol) in warm water (30 mL). The reaction mixture was stirred at room temperature for 4 h and monitored by TLC. The precipitate was filtered off and recrystallized from ethanol to afford the target compounds 3a-y.
Determination of drug similarity properties of compounds using Swiss ADME and Admet SAR programs
Today, computer-based calculation methods are used to reduce or eliminate the harm and undesirable effects of chemicals. Before starting preclinical studies, it is possible to make predictions about the pharmacokinetic properties, bioactivity, and drug similarity of the compounds by conducting theoretical studies. While designing a drug molecule, preliminary information about many properties such as water solubility, water carrying capacity, absorption in the gastrointestinal tract, protein affinity and toxicity can be obtained. As a result of many years of studies on drugs, various drug similarity rules such as Lipinski, MDDR-like, Veber, Ghose filter, BBB, CMC-50-like rules, and Quantification of Drug Similarity (QED) have been established. In this study, the properties of the compounds synthesized using the Swiss ADME and Admet SAR programs will be evaluated by investigating their similarities and superiorities with the standard drug [11–14].
Molecular Docking
Hexe 8.0.0 Docking program was used in the calculations [12–15]. The molecular formulas of each of the 22 thiosemicarbazone derivatives (3a-y) selected as Ligands in the program were drawn with the MarvinSketch 21.20 program and stored as a pdb (Protein Date Bank/PDB) file. The pdb file of the receptor proteins (carbonic anhydrase I-II isoenzymes and acetylcholinesterase) was obtained from RCSB PDB (http://www.rscb.org/pdb). To compare the data obtained, standards currently used as market drugs were used ligands (thiosemicarbazone derivatives) and targeted proteins (protein-78 (GRP78) for C6 and quinone reductase-2 (4ZVM for MCF 7). Receptor and Ligand files were imported in the Hex 8.0 software. Energy of docking (E value) was calculated using Hex 8.0. [15, 19].
Cell Culture Studies
The C6 glioma (ATCC® CCL-107) cell line and the MCF 7 breast cancer (ATCC® HTB-22) cell lines were obtained from ATCC. Penicillin/streptomycin (10,000U/mL), DMEM, Fetal Bovine Serum (FBS), Trypsin-EDTA solution and various consumables required for cell culture were used.
Cell Culture Study and Consumables
Cells proliferated in DMEM cell culture medium containing 1% L-glutamine, 1% penicillin-streptomycin and 10% fetal bovine serum in 25 cm2 flasks in an oven at 37°C and 5% CO2. Cells were passaged when they reached at 80% density and studies were started after a certain passage.
XTT Cell Viability Assay
The effects of the synthesized compounds on the cell viability of C6 and MCF 7 cells were evaluated by applying the XTT (2,3-bis (2-methoxy-4-nitro-5-sulfophenyl)-5-[(phenylamino)carbonyl]-2H-tetrazolium hydroxide) test. This study was carried out by using the method applied by Wolf et al [20]. Synthesized (thiosemicarbazone derivatives) compounds (3a-y) at determined concentrations were treated to each cell line, and the XTT cell viability test was performed for each cell line. Imatinib was considered as a positive control group. XTT method is based on the principle that metabolically active cells convert XTT, a tetrazolium salt, into orange colored formazan crystals. The resulting dye is water-soluble, and the dye density can be read at certain wavelengths (450 nm) using an ELISA reading device. The dye intensity in orange is proportional to the number of metabolically active cells. For cytotoxicity experiments, cells were seeded into a 96-well microplate with 10x103 cells per well in 100 µL of DMEM (containing 10% FBS + 1% antibiotic) medium and incubated overnight for cells to attach. Following day, after removing the medium on the cells and washing the wells with PBS, fresh medium was added to the cells. Samples of compounds (3a-y) at concentrations of 2, 5, 10, 25, 50 µg/ml were treated with cells and incubated for 24 hours. At the end of this period, the medium was removed, and the cells were washed three times with PBS.
Then, 100 µl of colorless DMEM and 50 µl of XTT solution were added to each well and incubated for 4 hours in a CO2 incubator. After the incubation, the optical density value was read at 450 nm in the microplate reader, the cell viability rate of the control group was accepted as 100% and it was calculated using the formula:
% Cell viability = (Concentration O.D. / Control O.D.) X 100.
According to the results obtained, IC50 values of compounds (3a-y) and imatinib were calculated.
Synthesis Thiosemicarbazone Derivatives (3a-y)
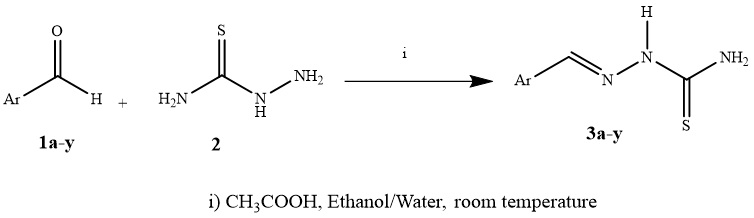
A series of thiosemicarbazones (3a-y) was prepared from the reaction of benzaldehydes (1a-y) with thiosemicarbazide (2) in ethanol, as solvent, and a few drops of CH3COOH at room temperature within 4 h, according to literature, [21, 22, 23] as shown in the Scheme 1.
Table 1. Synthesized Thiosemicarbazone derivatives (3a-y)

Evaluation of drug similarity properties of compounds
Selected compounds (3a-y) have high gastrointestinal absorption values. Compounds with high absorption also have high bioavailability. According to the results obtained, it was observed that the mentioned compounds cannot cross the blood brain barrier. In our hypothesis and application, which we determined within the scope of our study, a feature such as the compounds' crossing the blood-brain barrier was not sought. The compounds are therefore suitable in this respect. In addition, the fact that the compounds do not cross the blood-brain barrier would prevent a possible neurotoxicity. PGP substrate properties were not observed in almost any compound (except 3d). The absence of PGP substrate feature is a feature that increases the absorption and bioavailability of the compounds. Compounds (3a-y) synthesized according to drug similarity tests have drug similarity characteristics (Lipinski, Weber, Egan). The H bond of the compounds (3a-y) is similar to imatinib in terms of acceptor-donor property and number. Although LogP values are lower than imatinib, they are within the range of Lipinski rules and a lower LogP value is desired compared to the target. This is present in our compounds. Solubility in water is very important in terms of absorption, distribution in body fluids and tissues, metabolism, and elimination, respectively. A chemical with poor water solubility has low bioavailability. Thanks to the generally good water-soluble properties of the compounds, their dissolution, absorption and distribution in tissue fluids and blood will be more effective and higher. Thus, it can be said that the bioavailability and bioactivity of the compounds may be high.
Evaluation of Moleküler Docking results of thiosemicarbazone derivatives (3a-y)
Table 2 shows the binding affinity between the molecules and targeted proteins using Hex 8.0.0 docking software. When the data is examined, it is seen that all molecules have higher negative E values than standard substances. Also, the highest negative E value against MCF 7 is -375.82 kcal mol− 1 with 3v and (E=-308.16 kcalmol-1 for standard substance Imatinib), The highest negative E value against C6 was − 352.52 kcal mol-1 with 3g (E=-349.86 kcal mol-1 for standard substance Imatinib).
|
Compounds |
e Total (kcal mol− 1) |
Compounds |
e Total (kcal mol− 1) |
||
|---|---|---|---|---|---|
|
MCF 7 |
C6 |
MCF 7 |
C6 |
||
|
3a |
-308.15 |
-311.94 |
3m |
-331.13 |
-308.97 |
|
3b |
-322.48 |
-341.84 |
3n |
-329.22 |
-294.47 |
|
3c |
-262.91 |
-308.16 |
3o |
-275.51 |
-258.07 |
|
3d |
-277.99 |
-247.89 |
3p |
-305.38 |
-246.84 |
|
3e |
-302.69 |
-209.03 |
3r |
-226.39 |
-249.58 |
|
3f |
-295.73 |
-211.96 |
3s |
-254.09 |
-221.86 |
|
3g |
-333.88 |
-352.52 |
3t |
-190.78 |
-180.71 |
|
3h |
-323.76 |
-242.40 |
3u |
-314.89 |
-258.07 |
|
3i |
-339.46 |
-303.51 |
3v |
-375.82 |
-242.89 |
|
3j |
-254.15 |
-221.78 |
3y |
-231.01 |
-238.97 |
|
3k |
-235.80 |
-233.37 |
Drug (Imatinib) |
-308.16 |
-349.86 |
|
3l |
-279.34 |
-252.74 |
|||
Evaluation of antiproliferative activity results of thiosemicarbazone derivatives (3a-y)
The cytotoxic activities of thiosemicarbazone derivatives (3a-y) were evaluated on C6 and MCF 7 cell lines at 24 hours and Imatinib was used as positive control. Antiproliferative activities and IC50 values of compounds (3a-y) differ depending on the functional groups they contain and the differences in ring structures. The results clearly show that some compounds show more potent cytotoxic activity than Imatinib in both C6 and MCF 7 cell lines in Table 2. The IC50 values of the positive control Imatinib against C6 and MCF 7 cell lines were calculated as 11,68 ± 0,18 µg/mL and 9,24 ± 0,21 µg/mL, respectively. The IC50 values of the compounds (3a-y) on the C6 cell line ranged from 10,59 ± 0,15 µg/mL and 17,65 ± 0,22 µg/mL. When the results were evaluated, we can say that the IC50 values of five compounds were lower than Imatinib, so they showed a more effective antiproliferative effect than Imatinib. In addition, the IC50 values of the compounds (3a-y) on the MCF 7 cell line were between 7,02 ± 0,14 µg/mL and 11,38 ± 0,08 µg/mL. It was clearly seen that nine compounds show more potent cytotoxic activity against MCF 7 cell line than Imatinib. Compounds with the highest antiproliferative effect against C6 cell line were 3m (IC50: 10.59 ± 0.15 µg/mL) and 3b (IC50: 10.76 ± 0.32 µg/mL), respectively. The thiophene ring in the structure of 3m and the methoxy group attached to the aromatic ring in the structure of 3b were effective in the high antiproliferative effect of these derivatives. Also, the compounds with the greatest cytotoxic activity in the MCF 7 cell line were 3m (IC50: 7.02 ± 0.14 µg/mL) and 3r (IC50: 7.08 ± 0.28 µg/mL), respectively. The thiophene ring in the structure of 3m and the pyridine aromatic ring in the structure of 3r ensured that these derivatives showed significant antiproliferative effects. It was observed that the antiproliferative activity of the mentioned derivatives on cell lines was significantly higher than Imatinib. When the results were evaluated in detail, the IC50 values of thiosemicarbazone derivatives (3a-y) in the MCF 7 cell line were generally calculated to be lower than the IC50 values in the C6 cell line. In this case, it can be said that the synthesized compounds (3a-y) are more effective in MCF 7 cells and show better cytotoxic activity and inhibit the proliferation of the cells more.
|
Samples |
C6 IC50 (µg/mL) |
MCF 7 IC50 (µg/mL) |
|---|---|---|
|
3a |
12,02 ± 0,21 |
9,34 ± 0,16 |
|
3b |
10,76 ± 0,32 |
8,88 ± 0,19 |
|
3c |
11,62 ± 0,21 |
9,76 ± 0,09 |
|
3d |
12,84 ± 0,16 |
9,08 ± 0,24 |
|
3e |
13,05 ± 0,07 |
10,22 ± 0,19 |
|
3f |
11,68 ± 0,17 |
8,64 ± 0,24 |
|
3g |
10,98 ± 0,13 |
8,28 ± 0,14 |
|
3h |
13,65 ± 0,22 |
9,94 ± 0,27 |
|
3i |
11,73 ± 0,14 |
7,96 ± 0,09 |
|
3j |
13,56 ± 0,21 |
9,32 ± 0,15 |
|
3k |
12,25 ± 0,12 |
8,64 ± 0,24 |
|
3l |
14,84 ± 0,32 |
7,78 ± 0,18 |
|
3m |
10,59 ± 0,15 |
7,02 ± 0,14 |
|
3n |
12,22 ± 0,19 |
7,32 ± 0,31 |
|
3o |
14,36 ± 0,13 |
10,57 ± 0,14 |
|
3p |
14,78 ± 0,27 |
10,75 ± 0,44 |
|
3r |
15,65 ± 0,23 |
7,08 ± 0,28 |
|
3s |
12,65 ± 0,13 |
9,75 ± 0,21 |
|
3t |
17,65 ± 0,22 |
10,76 ± 0,26 |
|
3u |
13,65 ± 0,22 |
10,22 ± 0,25 |
|
3v |
13,65 ± 0,22 |
11,38 ± 0,08 |
|
3y |
12,64 ± 0,18 |
9,96 ± 0,15 |
|
Imatinib |
11,68 ± 0,18 |
9,24 ± 0,21 |
In this study, firstly, 22 thiosemicarbazone derivatives (3a-y) were synthesized. It was observed that the compounds fit Lipinski, Ghose, Veber, Egan, Muagge quarals in the calculations made with the SwissADME program. Thanks to the generally good water-soluble properties of the compounds, their dissolution, absorption and distribution in tissue fluids and blood will be more effective and higher. Thus, it can be said that the bioavailability and bioactivity of the compounds may be high. In the in vitro culture study, the effects of derivatives and imatinib synthesized in C6 and MCF 7 cell lines on cell proliferation were investigated and calculated. When the results were evaluated, it was observed that the synthesized derivatives showed a cytotoxic effect on cancer cells and decreased cell viability as desired. Especially 3m, 3b and 3r thiosemicarbazone derivatives showed the highest cytotoxic activity in C6 and MCF 7 cells. It can be said that the chemical groups or rings in the structures of these synthesized derivatives have positive effects on their antiproliferative effects. As a result, it can be said that thiosemicarbazone derivatives can be effective compounds in terms of their stated properties, according to the data obtained from both SwissADME evaluations and in vitro cell culture studies.
Acknowledgments
This work is supported by the Scientific Research Project Fund of Sivas Cumhuriyet University under the project number SHMYO-013 and Scientific Research Projects Commission of Tokat Gaziosmanpasa University (Project Number: 2019/54).
Conflict of interest statement
The authors declare that there are no conflicts of interest.
- Hu K, Yang Z, Pan S-S, et al. Synthesis and antitumor activity of liquiritigenin thiosemicarbazone derivatives. Eur J Med Chem. 2010;45:3453–8.
- Joseph M, Kuriakose M, Kurup MRP, et al. Structural, antimicrobial, and spectral studies of copper (II) complexes of 2-benzoylpyridine N (4)-phenyl thiosemicarbazone. Polyhedron. 2006;25:61–70.
- Gupta RP, Narayana NL. Synthesis of some Mannich basesof 1-cyclohexylidene-N(1,2-dihydro-2-oxo-3H-indol-3- ylidene) thiosemicarbazones and their antibacterial activity. Pharm Acta Helv. 1997;72:43–5.
- Khan SA, Asiri AMAA, Khan KA, et al. Synthesis of novel schiff bases by microwave irradiation and their in vitro antibacterial activity. Asian J Chem. 2013;25:8643–6.
- Zambre AP, Kulkarni VM, Padhye S, et al. Novel curcumin analogs targeting TNF-induced NF-jB activation and proliferation in human leukemic KBM-5 cells. Bioorg Med Chem. 2006;14:7196–204.
- Pavan FR, Maia Pedro da S, Leite SRA, et al. Thiosemicarbazones, semicarbazones, dithiocarbazates and hydrazide/hydrazones: Anti – Mycobacterium tuberculosis activity and cytotoxicity. Eur J Med Chem. 2010;45:1898–905.
- Denny WA. Prodrug Strategies in Cancer Therapy. Eur J Med Chem. 2001;36:577–95.
- DeSantis CE, Lin CC, Mariotto AB, et al. Cancer treatment and survivorship statistics. CA Cancer J Clin. 2014;64:252–71.
- Fitzmaurice C, Dicker D, Pain A, et al. The Global Burden of Cancer 2013. JAMA Oncol. 2015;1(4):505–27.
- Pavlopoulou A, Spandidos DA, Michalopoulos I. Human cancer databases (review). Oncol Rep. 2015;33(1):3–18.
- Ritchie DW. Evaluation of Protein Docking Predictions Using Hex 3.1 in CAPRI Rounds 1 and 2. PROTEINS: Struct Funct Genet. 2003;52(1):98–106.
- Ghoorah AW, Smail-Tabbone M, Devignes MD, et al. Protein Docking Using Case-Based Reasoning. PROTEINS: Struct Funct Genet. 2013;81:2150–8.
- Ritchie DW. Recent progress and future directions in protein-protein docking. Curr Prot Pep Sci. 2008;9(1):1–15.
- Macindoe G, Mavridis L, Venkatraman V, et al. HexServer: an FFT-based protein docking server powered by graphics processors. Nucleic Acids Res. 2010;38:W445–9.
- Daina A, Michielin O, Zoete V. SwissADME: a free web tool to evaluate pharmacokinetics, drug-likeness and medicinal chemistry friendliness of small molecules. Sci Rep. 2017;7:42717.
- Yang H, Lou C, Sun L, et al. AdmetSAR 2.0: web-service for prediction and optimization of chemical ADMET properties. Bioinformatics. 2018;15(6):1067–9. 35(.
- Yang H, Lou C, Sun L, et al. AdmetSAR 2.0: web-service for prediction and optimization of chemical ADMET properties. Bioinformatics. 2019;35(6):1067–9.
- Cheng F, Li W, Zhou Y, et al. AdmetSAR: a comprehensive source and free tool for assessment of chemical ADMET properties. J Chem Inf Model. 2012;52(11):3099–105.
- Lipinski CA, Lombardo F, Dominy BW, et al. Experimental and computational approaches to estimate solubility and permeability in drug discovery and development settings. Adv Drug Deliv Rev. 1997;23(1–3):3–25.
- Wolf NB, Kuchler S, Radowski MR, et al. Influences of opioids and nanoparticles on in vitro wound healing models. Eur J Pharm Biopharm. 2009;73:34–42.
- Santos J, Silva LR, de Melos J, Lima GS, et al. Synthesis, anti-Trypanosoma cruzi activity and quantitative structure relationships of some fluorinated thiosemicarbazones. J Fluor Chem. 2017;195:31–6.
- Matsaa R, Makamb P. Kaushikc M, et al. Thiosemicarbazone derivatives: Design, synthesis and in vitro antimalarial activity studies. Eur J Pharm Sci. 2019;137:104986.
- Sardari S, Feizi S, Rezayan AH, et al. Synthesis and Biological Evaluation of Thiosemicarbazide Derivatives Endowed with High Activity toward Mycobacterium Bovis. Iran J Pharm Sci. 2017;16(3):1128–40.
Schemes 1 and 2 are available in the Supplemental Files section.
- sup.inf..docx
- Scheme1.jpg
Scheme 1. Synthesis of thiosemicarbazones (3a-y)
- Scheme2.jpg
Scheme 2. Radar views of bioactivity for selected molecules