3.1 Synthesis and characterization of VAD, VDP, VAD-EP and VDP-EP
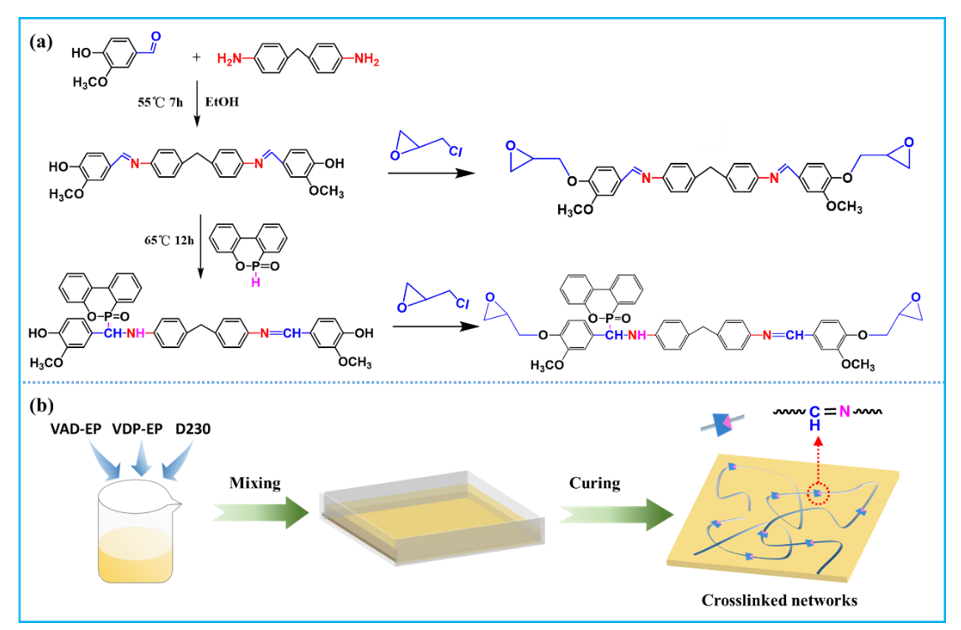
Scheme 1(a) illustrates the preparation of di-phenol epoxy vitrimer intermediate VAD, VDP, VAD-EP and VDP-EP. VAD was synthesized via in situ condensation reaction of the aldehyde group of vanillin and amino group of DDM. Then, VAD was epoxidized to obtain VAD-EP. The preparation method of VAD-EP was similar to the epoxy monomer MEP, as previously reported [18]. The FTIR spectra of VAD, VDP, VAD-EP and VDP-EP are shown in Fig. 1(a) and (b). In the vanillin spectrum, the absorption peaks at 3100–3500 cm− 1 and 1665 cm− 1 belong, respectively, to -OH and C = O stretching vibration characteristic peaks. In VAD spectrum, the absorption peak at 3100–3500 cm− 1 is retained, while the characteristic peak belonging to aldehyde group at 1665 cm− 1 disappears. Meanwhile, a new characteristic absorption peak, which belongs to C = N bond, appears near 1624 cm− 1, proving the successful synthesis of VAD. In the FTIR spectrum of VAD-EP, a new characteristic peak appears at 905 cm− 1, which belongs to epoxy group. The absorption peak at 2438 cm− 1 is ascribed to the characteristic peak of P-H bond on DOPO. In the VDP spectrum, it can be observed that the characteristic peaks of C = O stretching vibration and P-H bond disappear, while the characteristic peak of C = N at 1624 cm− 1 is maintained. In addition, the characteristic peaks at 3100–3500 cm− 1 (-OH and N-H stretching vibration), 1590 cm− 1 (P-C), 1270 cm− 1 (C-N), 1236 cm− 1 (P = O) and 925 cm− 1 (P-O) appear [18, 38]. In the VDP-EP spectrum, it can be seen that the absorption peak still exists at 1624 cm− 1 (C = N), and a new weak epoxy characteristic peak appears at 902 cm− 1, which proves that the synthesis of VDP-EP was successful.
The 1H NMR (400 MHz, DMSO) of VAD, VDP, VAD-EP and VDP-EP are reported in Fig. 1(a1, b1, a2 and b2), and their 13C NMR and 31P NMR are provided in Supporting Information. In details,
VAD, 1H NMR (400 MHz, DMSO) δ = 3.84 (d), 3.96 (d), 7.13–7.34(m), 7.75 (d), 8.43 (d), 9.27 (d).
VDP, 1H NMR (400 MHz, DMSO) δ = 3.46 (d), 3.66 (d), 3.96 (s), 4.87 (m, 1H), 5.26 (m, 1H), 6.06 (m), 6.66 (m), 7.12 (m), 7.40 (m), 7.72 (tt), 7.99 (dd), 8.17 (m), 8.42 (dd), 8.91 (m), 9.72 (s), 10.24 (s).
VAD-EP, 1H NMR (400 MHz, CDCl3) δ = 2.71–2.84 (t), 3.36 (s), 3.88 (m), 4.05 (d), 4.26 (m), 6.93–7.54 (m), 8.29 (d).
VDP-EP, 1H NMR (400 MHz, CDCl3) δ = 2.60 (dd), 2.81 (m), 2.99 (d), 3.17 (d), 3.51 (m), 3.89 (m), 6.17–7.68 (m), 8.07 (s), 8.28 (m).
3.2 Flame retardancy and flame mechanism analysis
Figure 2a-d show the UL-94 vertical combustion of various epoxy vitrimers. The values for limit oxygen index are shown in Table 1. It can be observed that the flame of A10P0-D230 burned violently without self-extinguishing, which means that the sample had no UL-94 vertical combustion grade. Meanwhile, LOI value was as low as 21.4%. The flame retardant efficiency was similar to that of a commercial epoxy resin. With the increasing content of VDP-EP, the flame combustion degree of the epoxy vitrimer decreased gradually. A9P1-D230 (P = 0.33%, N = 3.98%) can self-extinguish within 10 s and 11 s for the first and second ignition, which achieved the UL-94 vertical combustion V1 grade with a LOI of 24.3%. A8P2-D230 (P = 0.66%, N = 3.90%) and A7P3-D230 (P = 1.0%, N = 3.82%) can both self-extinguish within 10 s after leaving the fire source, indicating that the UL-94 V0 grade of vertical combustion was achieved. The LOI value increased to 27.0% and 28.7%, respectively. The results confirm that P content in the epoxy significantly contributed to the flame retardancy. In addition, no melting drops were observed in all epoxy vitrimers during combustion. The above results show that with increasing content of VDP-EP, the flame retardant efficiency of epoxy vitrimer was gradually increased.
As shown in Fig. 2e-g, the flame retardancy behavior of different epoxy vitrimers were further studied through cone calorimeter, which is helpful to understand the flame retardancy mechanism. In Fig. 3, curves of the total heat release (THR), heat release rate (HRR), total smoke production (TSP) and flame production rate (SPR), are reported. The related data are summarized in Table 1.
The residual char layers and morphological SEM images of the studied epoxy vitrimers after cone calorimetric measurements are included in Fig. 2e1-f1. It can be observed that A10P0-D230 has a large amount of char residue, nevertheless the residual char layer was discontinuous, and numbers of cracks and voids can be observed (Fig. 2e2-e3), contributing to the propagation of flame and oxygen. After adding the VDP-EP, the amount of residual char of epoxy vitrimer decreased, which was consistent with TGA data (Fig. S3), while the char layer became more continuous (Fig. 2f2, f3, g2, g3). As well-known, dense char layers contribute to hindering the transformation of heat and oxygen from the outside and impeding the flame spread [39, 40]. Therefore, high quality residual char layers played a significant role in enhancing flame retardant performance of the epoxy system [41]. It should be also noted that both P and N elements were evenly distributed in A7P3-D230 samples before combustion, as it will be shown in Fig. 5e.
PHRR and THR values of DER-DDM (commercial DGEBA epoxy) were 898.3 kW/m2 and 98.7 MJ/m2, respectively, while A7P3-D230 sample were reduced sharply to 467.3 kW/m2 and 67.1 MJ/m2, registering a decrease of 48% and 32% in comparison to DER-DDM. The result can be justified by considering that the decomposition of phosphorous substances in the early combustion stage promoted the formation of dense carbon layer, which will insulate the transformation of external oxygen and heat into the internal epoxy matrix; Secondly, the PO∙, PO2∙ and phenoxy radicals generated during combustion can effectively quench H∙ and OH∙, thus interrupting the combustion reaction [42]. In the meanwhile, with increasing VDP-EP content (P content), av-COP and av-CO2P declined, and av-EHC also decreased from 13.8 MJ/kg to 2.8 MJ/kg, i.e. 79.7% of decrease, indicating that the toxicity of smog produced during the combustion was reduced [3]. The fire growth index (FGI) was used to analyze the fire risk, and the results indicated that, with the introduction of VDP-EP, the FGI value gradually reduced and the fire risk therewith decreased [43]. Based on the above analysis, the addition of VDP-EP endowed the epoxy vitrimer having a good flame retardant efficiency, which was mainly due to the P-N synergistic effect in the system (Fig. 5e), in accordance with literature [9, 38, 44]. It should be also noted that the P content in this work is quite low (only 0.66%), which means the condensed phase and free radical scavenging mechanisms played more dominant role than the nonflammable gas dilution effect on the fire retardancy.
Table 1
Parameters of cured epoxy resins obtained from cone calorimeter.
| Samples | LOI (%) | PHRR (kW/m2) | THR (MJ/m2) | Time to PHRR (s) | FGI (kW/(m2·s)) | av-COP (kg/kg) | av-CO2P (kg/kg) | av-EHC | TSP (m2) |
| DER-DDM | 21.4 | 898.3 | 98.7 | 151.6 | 5.9 | 0.043 | 0.92 | 13.8 | 25.7 |
| A10P0-D230 | 24.3 | 531.4 | 61.7 | 158.3 | 3.4 | 0.113 | 1.03 | 17.5 | 29.6 |
| A9P1-D230 | 27.0 | 484.7 | 59.5 | 160.5 | 3.0 | 0.048 | 0.06 | 12.0 | 31.2 |
| A7P3-D230 | 28.7 | 467.3 | 67.1 | 178.4 | 2.6 | 0.054 | 0.07 | 2.8 | 32.1 |
3.3 Mechanical Properties
In Fig. 4 and Table 2, the tensile properties of epoxy vitrimers are reported and summarized. Epoxy vitrimer was a typical brittle material, which is consistent with the morphology of brittle fracture (Fig. 5). The fractured surfaces of epoxy vitrimers were smooth, which indicated good compatibility of VAD-EP had and VDP-EP. Compared with A10P0-D230, the tensile modulus, strength and elongation at break of epoxy vitrimer containing VDP-EP were improved. The tensile strength and modulus of A10P0-D230 were 50.8 MPa and 2.08 GPa, respectively. When the ratio of VDP-EP to VEND-EP was 9:1, the tensile strength and modulus enhanced to 63.4 MPa and 2.20 GPa, respectively, registering increase by 24.8% and 5.8%. The tensile strength of A8P2-D230 and A7P3-D230 were 74.0 MPa and 75.5 MPa, respectively, 45.7% and 48.6% higher than A10P0-D230. The tensile modulus was increased to 2.23 GPa and 2.47 GPa, improving by 7.2% and 18.8% compared with A10P0-D230. This was mainly attributed to the rigid aromatic ring structure in VDP-EP and the strong N-H interaction formed by the intermolecular hydrogen bonds [45]. In addition, the elongation at break was also increased due to the special long aliphatic chain structure of the curing agent D230 (a polyether amine) [46].
Table 2
Thermal characteristics and mechanical properties of cured epoxy systems.
| Samples | Td5% (ºC) | R800 (%) | Tensile Strength (MPa) | Tensile Modulus (GPa) | Tg (DSC) | Tg (DMA) | E′ at 30 °C (MPa) | νe/103 (mol/m3) |
| A10P0-D230 | 312.3 | 33.8 | 50.8 | 2.08 | 64.3 | 89.5 | 3093 | 0.6663 |
| A9P1-D230 | 203.0 | 33.6 | 63.4 | 2.20 | 61.8 | 82.8 | 3044 | 0.4353 |
| A8P2-D230 | 212.7 | 32.8 | 74.0 | 2.23 | 60.6 | 82.3 | 2768 | 0.3067 |
| A7P3-D230 | 205.3 | 30.2 | 75.5 | 2.47 | 57.6 | 80.3 | 2698 | 0.3112 |
3.4 Stress relaxation
Stress relaxation is an important feature of vitrimer material. VAD-EP and VDP-EP both contain dynamic bond C = N. The Schiff base bond will react reversibly at a certain temperature, resulting in the rearrangement of cross-linking network. In order to study the stress relaxation behavior of A7P3-D230, the relationship between relaxation modulus and time was tested by DMA. Stress relaxation time (τ) can directly reflect the rate of dynamic bond exchange reaction and topological rearrangement of vitrimer materials at different temperatures. Based on the Maxwell equation of viscoelastic fluid, τ can be calculated by the time required when the material relaxation modulus is 1/e (36.8%) of the initial relaxation modulus. As shown in Fig. 6, the stress relaxation curve of epoxy vitrimer A7P3-D230 at 90 ºC, 100 ºC, 110 ºC, 120 ºC, 130 ºC and 140 ºC were obtained. The results showed that the chain segment of epoxy vitrimer A7P3-D230 can completely relax and moved at a temperature higher than its Tg. With the increase of temperature, the corresponding relaxation time becomes shorter. The relaxation time of epoxy vitrimer A7P3-D230 ranged from 348 s at 90 ºC to only 11 s at 140 ºC, indicating that it can reach a new equilibrium state in a short time [29]. As well known, the relaxation time of a vitrimer is strongly dependent on temperature, and its relationship follows Arrhenius equation. As shown in Fig. 6b, according to Arrhenius equation, the relationship between relaxation time and temperature was considered to fit the experimental data, and the calculation formula was as follows:
$$\text{ln}\left(\tau \right)=\text{l}\text{n}\left({\tau }^{*}\right)+\frac{{E}_{a}}{RT}$$
1
The activation energy Ea calculated by formula (1) was 82.9 KJ/mol, which was consistent with the Ea value (34 ~ 130 KJ/mol) required for dynamic imine bond exchange reported in literature [17, 47–49].
Another important characteristic parameter of vitrimer material is the topological freezing transition temperature (Tv), at which the bond exchange reaction in the network changes from viscoelastic solid to viscoelastic liquid. At this time, the material viscosity reaches 1012 Pa·s [39, 47]. In this viscosity value, the τ was calculated to be 9.9×10⁵ s for epoxy vitrimer A7P3-D230. Then, the theoretical Tv was calculated at 7.0 ºC through extrapolation method of the curve fitted by Arrhenius equation, which was lower than the Tg measured by DMA. It can be seen that the imine bond of A7P3-D230 showed a faster exchange reaction rate. When the temperature is lower than Tv and Tg, the crosslinked network structure is frozen due to the low rate of bond exchange reaction. The network freezing refers to the segment mobility related to Tg rather than the exchange reaction [19, 29, 50]. When the temperature is higher than Tv and Tg, the material possesses faster mobility.
3.5 Reprocessing, recyclability and repairability of epoxy vitrimer
The self-healing performance of A10P0-D230 and A7P3-D230 epoxy vitrimers at 60 ºC are shown in Fig. 7a and Fig. 7b. It can be observed that after 12 h of treatment, the samples were gradually self-healed. After 24 h of treatment, the scratches disappeared, indicating that epoxy vitrimer had excellent self-healing capacity. Figure 7c illustrates the reprocessability of A7P3-D230 sample: when it was cut into pieces and then hot pressed by a plate vulcanizer at 140 ºC and 10 MPa, the sample maintained a good integrity. Tensile stress-strain curves and retention of tensile strength of A7P3-D230 sample with multiple reprocessing are reported in Fig. 7d and Fig. 7e. It can be observed that although the tensile strength, modulus and elongation at break of A7P3-D230 decreased gradually, the tensile strength still retained 86.1% and 66.8% after one and two reprocessing steps in comparison with the original A7P3-D230. Two main reasons can justify this result: (1) during the reprocessing process, only C = N, as the dynamic covalent bond, can be repaired, while other covalent bonds such as C − C, P-O and P = O cannot be repaired after break [35, 51]; (2) epoxy vitrimer was probably degraded during the hot pressing [52, 53].
As well-known, the traditional thermosetting polymers cannot be recycled, limiting their applications, as a result of waste of resources and environmental pollution. The decomposition mechanism and rearrangement mechanism of the crosslinking network of thermosets are the uniqueness of vitrimer materials [54]. Due to the reversible reaction properties of Schiff base bonds, epoxy vitrimer can be degraded via the exchange reaction between amino and imine groups under acidic conditions [26, 52]. To prove this hypothesis, A7P3-D230 was immersed in a mixed solution of 1M HCl/THF (v:v = 2:8) and stirred continuously at 60 ºC for 60 min, as shown in Fig. 8a and Fig. 8b. The sample was dissolved completely. This was mainly ascribed to the degradation effect of Schiff base bonds into amino and aldehyde groups under acidic conditions, which was named as the network decomposition mechanism of a vitrimer material. In addition, epoxy vitrimer A7P3-D230 was immersed into the excess 1, 3’-propylenediamine ethanol solution and then stirred continuously at 60 ºC for 30 min. The sample was completely dissolved. It should be noted that the epoxy vitrimer still maintain excellent resistance against other regular inorganic/organic solvents (water, DMSO, DMF, ethanol, n-hexane, ethyl acetate, dichloromethane and toluene), as shown in Fig. S4. This can be deduced by the fact that when the amino group is in excess, the Schiff base bonds can undergo amination reaction between amine and imine groups, further leading to the degradation of Schiff base bonds, which belonged to the network rearrangement mechanism [49].
3.6 Mechanical properties and recyclability of CF reinforced composites
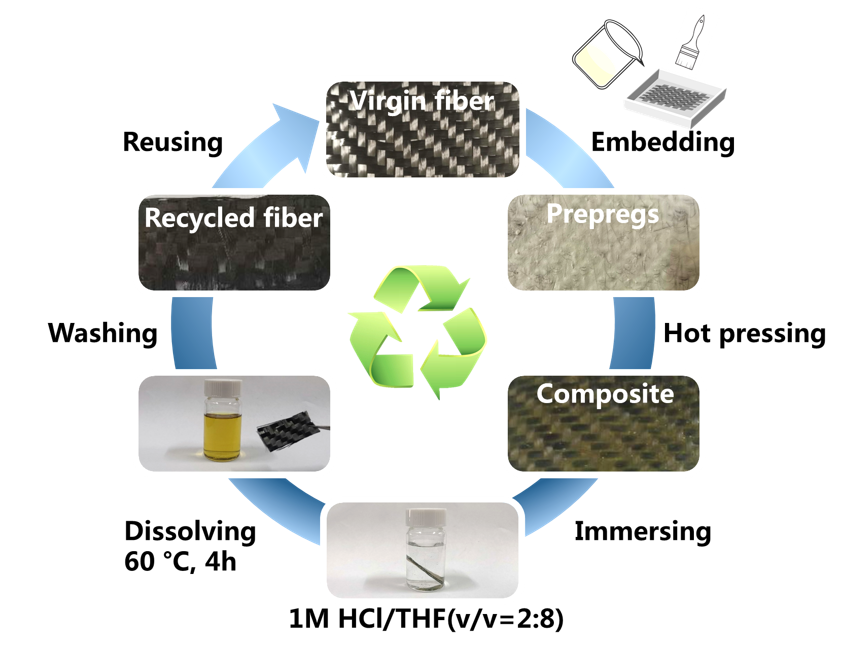
In order to expand the application field of epoxy vitrimer, carbon fiber (CF) reinforced epoxy composites (A7P3-D230/CF) were prepared via manual impregnation with the help of brush, as shown in Scheme 2, and the results of mechanical characterization of A7P3-D230/CF are given in Fig. 9. The bending strength and modulus of A7P3-D230/CF with three-layer CF were 187 MPa and 15.2 GPa, respectively. The tensile strength and modulus of single-layer A7P3-D230/CF were 152.8 MPa and 25.1 GPa, respectively. During the measurement, the A7P3-D230 and carbon fiber were closely bonded, indicating a strong interfacial adhesion. Subsequently, the A7P3-D230/CF composite was immersed in the 1M HCl/THF (v:v = 2:8) solution at 60 ºC for 4 h. As proposed, the epoxy vitrimer can be completely dissolved in the solution, and then the recycled CF can be obtained after drying and washing. Scheme 2 is a schematic diagram of the preparation and decomposition process of the A7P3-D230/CF composite. The epoxy vitrimer was completely degraded. The chemical structure, mechanical properties and micro-morphology are critical for reusing recycled CFs [55, 56]. The chemical structure, mechanical properties and micro morphology of the original and recovered CFs were analyzed by Raman spectroscopy, tensile test and SEM. Figure 9c shows the Raman spectra of virgin and recycled CFs, in which their chemical signals had no difference, indicating that the chemical structure of CFs during the recovery was not destroyed. Figure 9d is the stress-strain curve of original and recovered CFs. The tensile strength, modulus and elongation at break of recovered CF were 2.2 GPa, 454.0 GPa and 0.7%, respectively, demonstrating a slight change comparing with the original CFs of 2.3 GPa, 466.3 GPa and 0.8%, respectively. As shown in Fig. 9e and Fig. 9f, it can be observed that the recovered carbon fibers still keep smooth without any crack. The results showed that the carbon fibers can be recycled from the vitrimers based composites under the gentle acidic condition, and the CF still retains the similar chemical structure, mechanical properties and morphology as the original fibers.