An experimental and theoretical study of the molecular structure of an organic arsenate templated by 4-aminopyridine, with the general formula (C5H7N2)(C5H8N2)[AsO4]·H2O ((4-APH)(4-APH2)[AsO4]·H2O), is presented. The optimized geometry, vibrational frequencies and various thermodynamic parameters of the title compound calculated using DFT methods are in agreement with the experimental values. The theoretical calculations were performed using density functional theory (DFT) method at B3LYP/6-311 + + G(d,p) basis set levels. A detailed interpretation of the IR and Raman spectra were reported. The thermodynamic functions (heat capacity, entropy, and enthalpy) from spectroscopic data by statistical methods were obtained for the range of temperature 100–1000 K. The molecular orbital calculations such as Natural Bond Orbitals (NBOs), AIM approach, HOMO-LUMO energy gap, Molecular electrostatic potential (MEP), NLO characteristic and Hirshfeld surface analysis were performed with the same DFT level. Electronic stability of the compound arising from hyper conjugative interactions and charge delocalization were investigated based on the natural bond orbital (NBO) analysis. The molecular docking simulation results showed an excellent agreement with the experimental findings and satisfactory support the antiviral effects, the druggability and pharmacokinetic properties of the compound.
Research Article
Experimental and computational investigations on structural, spectroscopic, electronic and thermodynamic, druggability and pharmacokinetics of a hybrid organic-inorganic synthetic arsenate
https://doi.org/10.21203/rs.3.rs-1752702/v1
This work is licensed under a CC BY 4.0 License
Version 1
posted
You are reading this latest preprint version
DFT
HOMO-LUMO
NLO
Thermodynamic functions
Vibrational frequencies
Computational assessment.
• The structural and spectroscopic properties were investigated using experimental and theoretical methods.
• All computations were performed with DFT/B3LYP/6-311G (d,p) level.
• The electronic and thermodynamic properties were theoretically studied.
• Hirshfeld surface analysis was performed to study the intermolecular interactions.
• The molecular docking works of the title compound were performed by iGEMDOCK.
Due to their structural diversity, organic-inorganic hybrid (OIH) materials have been extensively studied in the last few years [1–8]. The assembly of the organic and inorganic components on a molecular level offers new features that potentially combine the properties of the two parts. Designed hybrid materials possess exceptional physical properties such as optical properties for applications in the fields of optoelectronics and energy [9–11]. The synthesis of hybrid materials offers an innovative route to design a variety of astonishing materials with industrial applications [2–12]. The quantum chemical methods are widely used for the investigation of theoretical modeling of drug functional materials; these methods provide powerful tools for studying molecular geometry, vibrational and molecular properties via Becke’s three-parameter hybrid functional (B3LYP) and Density Functional Theory (DFT) [13–14]. In an attempt to study this class of materials, a hybrid compound with the formula (C5H7N2)(C5H8N2)[AsO4]·H2O has been synthesized and its structure was determined [15]. The molecular geometry, vibrational spectra and thermodynamic properties were determined and compared with theoretical results. The spectral features were assigned to the different normal modes of vibration. The simulated infrared and Raman spectra of the compound show good agreement with the observed spectra. The conformational study was complemented by natural bond orbital (NBO) analysis to evaluate the significance of hyper-conjugative interactions which would favor one conformation over another and the study of the reactivity was performed by AIM approach. HOMO-LUMO analysis was performed to determine molecular properties like ionization potential, electron affinity, electronegativity, chemical potential, hardness, softness and global electrophilicity index. Local reactivity descriptors were calculated to identify the preferred sites for electrophilic, nucleophilic and radical attacks. The first order hyperpolarizability (β0) and related properties (µ, α, Δα) of the title molecule were also calculated. The thermodynamic properties (heat capacity, entropy, and enthalpy) of the title compound at different temperatures were calculated in gas phase. The present study aims to give a description of the molecular geometry, molecular vibrations, electronic and thermodynamic features of (C5H7N2)(C5H8N2)[AsO4]·H2O. The comparison of chemical reactivity and biological activity have been done by calculating global and local reactivity parameters and performing molecular docking and pharmacokinetic studies.
Synthesis
The single crystals of (C5H7N2)(C5H8N2)[AsO4]·H2O were grown by slow evaporation at room temperature. Details of the growth procedure and single crystal X-ray diffraction study are described [15]. Whereas the crystal structure of the compound has been previously reported, an experimental and theoretical investigation will be carried out in this work with greater detail.
Spectroscopic measurements
Raman spectrum was performed at room temperature using a LABRAM-Jobin Yvon set up. The excitation line was 630 nm from a Neon laser from 400 to 4000 cm-1. The incident laser power was limited to 5 mW to avoid sample heating degradation. The laser beam was focused on to the sample through a 50 x microscope objective. The IR spectrum was recorded from 400 to 4000 cm-1 on a BRUKER spectrometer with a spectral resolution of 2 cm-1.
Computational details
The DFT method using the Gaussian 09 software program [16] was used to perform molecular geometry optimization and vibrational wave number calculations. The DFT approach and effective core potentials (ECPs) (LANL2DZ basis and ECP built-in) have been utilized in order to represent the metal. The B3LYP method with 6-311++G(d,p) basis set was used for all atoms except for the arsenic and nitrogen atoms. The geometry optimizations and frequency calculations of (4-APH)(4-APH2)[AsO4]·H2O were carried out using the Becke’s three-parameter hybrid exchange functional (B3) [17] combined with the Lee-Yang-Parr correlation functional (LYP) [18] in conjunction with the LanL2DZ basis set [19]. Geometric parameters from the theoretical structure were compared with the experimental X-ray diffraction data. The calculated vibrational wavenumbers were assigned using GaussView05 program [20] employed to generate visual presentations and verify the normal mode assignments. Various non-linear optical properties of the title compound such as dipole moment (μ), polarizability (α) and first static hyperpolarizability (β) values were also computed on theoretical computations. The electronic properties such as (HOMO) and (LUMO) energies were determined. The Natural Bond Orbital (NBO) [21] was calculated at B3LYP level using the basis set 6-311++G(d,p). This analysis was done to give clear evidence of stabilization originating from hyper conjugation of various intramolecular interactions. To get insight on the intermolecular H-bonding, the most important AIM topological parameters at bond critical points (BCP) of O-H and O···H contacts have been calculated by using the Multiwfn software [22]. The Molecular Electrostatic Potential (MEP) was also calculated using Gauss View. Additionally, the thermodynamic properties of the title compound were calculated at different temperatures, revealing the correlation between heat capacity (C), enthalpy (H) and entropy (S) with temperatures. The Crystal Explorer 3.1 program [23] was used for Hirschfeld surface analysis of the experimental structure.
In silico molecular docking, drugabbility and pharmacokinetics
The crystal structures of the selected protein targets in pdb format were selected from Protein Data Bank (PDB) (Alpha-synuclein (3q25), Rho-kinase (2f2u)). The ligands attached to the complex proteins were removed and all the polar hydrogen was added, then saved in pdbqt format and used for docking studies. Molecular docking of (4-APH)(4-APH2)[AsO4]·H2O along with arsenic, maltose and 5-(1,4-diazepan-1-sulfonyl)isoquinoline (M77) with human MAOB were investigated using iGEMDOCK (Generic Evolutionary Method for Docking Molecules) [24] on the basis of GEMDOCK pharmacological scoring function [25]. Following, the interactions of the compound with different SARS-CoV-2 virus proteins was realized. We targeted 6LU7, 6M2N, 6M0J and BTF. Crystal structures of spike receptor binding domain of SARS-CoV-2 (PDB 6M0J), was used. For SARS-CoV-2 RNA-dependent RNA polymerase (PDB 7BTF.pdb), cofactors (Zn+2) in reduced condition were removed. For SARS-CoV-2 3CL protease (3CL pro) (PDB 6M2N.pdb), the novel inhibitor was removed. The crystal structure of COVID-19 main protease (PDB 6LU7) in complex with an inhibitor N3 was also used. All proteins were preprocessed than targeted for molecular binding with the compound as previously described [26,27,28]. Preprocessing includes removing water molecules and adding polar hydrogen and Coleman charges [29,30]. Several biological-related parameters were assessed. The analyses include the lipophilicity, druggability, medicinal chemistry and pharmacokinetics based on ADMET (for absorption, distribution, metabolism, excretion and toxicity) properties as previously described [26,27,30].
Geometry optimization
The structure of the title compound Mhadhbi et al. [15], crystallizes in the centrosymmetric triclinic system with P space group; the unit cell parameters are a = 6.570 (5) Å, b = 8.528 (2) Å, c = 12.529 (3) Å, α = 95.83 (3)°, β = 97.149 (4)°, γ = 95.116 (7)° and V = 689.2 (6) Å3. The unit formula (Fig. 1a) is made of two 4-aminopyridinium cations mono and diprotonated ([C5H7N2] +, [C5H8N2]2+), an arsenate anion [AsO4]3- and one water molecule. The different components are connected by a network of N/O–H···O hydrogen bonds. In order to find the optimized geometry, theoretical calculations were carried out by the DFT/B3LYP with LanL2DZ and 6-311++G(d,p) basis sets. The experimental and calculated molecular geometry parameters (bond lengths, bond angles of the title compound) were given in Table S1, showing the observed and calculated bond parameters are compatible. The Fig. 1b represents the corresponding optimized geometry by the DFT calculation. The difference between the optimized and experimental geometries was analyzed in term of Root Mean Square Deviation (RMSD) overlay. The RMSD fits of the bond lengths and bond angles of experimental and calculated geometries are 0.026 Å and 2.946° respectively, which indicate the agreement between the two geometries. As shown in Table S1, a set of calculated geometrical parameters are slightly deviated from the experimental values; this deviation might be due to that fact that the calculations are carried out for a single molecule in the gaseous phase and the experimental results are obtained in the solid state.
The details of the molecular bond parameters are briefly summarized below. The experimentally obtained values of the C-N and C-C bond lengths are in the range of 1.311–1.390 and 1.363–1.423 Å, respectively. It can be seen that the N-C and C-C bond lengths predicted by the B3LYP basis are found to be between 1.341–1.472 and 1.373–1.420 Å, respectively. The experimental values of the C-C-C bond angles in the phenyl rings and N-C-C angles vary in the range of 117.038–120.023° and 117.169–122.805°, respectively. However, the corresponding theoretical values are in the range of 117.441– 121.309° and 119.303–122.945°, respectively. As for the anionic group, each arsenic atom at the center of the tetrahedron is connected to four oxygen atoms. The experimental values of the large As-O bond lengths are 1.631–1.651 Å, whereas the theoretical values of the corresponding bond lengths are 1.719–1.828 Å. On one hand, the experimental O-As-O angles vary between 108.239 and 111.234°. These values are in agreement with the theoretical corresponding angles which vary between 100.085 and 115.848°, respectively. The molecular geometry in gas phase may differ from the solid phase owing to the extended hydrogen bonding and stacking interactions (attractive non-covalent interactions between two aromatic rings). The difference between the theoretical and experimental geometry might be to the fact that calculations were performed using isolated molecule in the gaseous phase to obtain theoretical results and in solid state for experimental results. Thus, it is found that most of the optimized bond lengths and the bond angles are in reasonable agreement with the corresponding experimental values. As seen, the calculated geometric parameters represent good approximation and can be used as a foundation to calculate the other parameters for the compound. There are slight differences since the experimental results belong to the solid phase, whereas the calculated values are related to the gas phase.
Molecular electrostatic potential (MESP) maps
The molecular electrostatic potential (MEP) surface was drawn by the DFT method. The electrostatic potential is used to exhibit the molecular outline, dimension, and electrostatic potential in terms of color grading [31]. The potential is presented in the map of MEP and visualized with different colors as shown in Fig. 2. At DFT level the MEP surface is plotted for the title compound. The color code of these maps ranges from -2.07 10-1 (red) and 2.07 10-1 a. u. (blue). The mapping represents the donor atoms in blue regions with positive potential; the most positive electrostatic potential (nucleophilic site) is localized hydrogen atoms. The acceptor atoms with negative potential in red regions represent the most electronegative potential (electrophilic sites) and it is mainly localized over anionic group. The green or yellow color indicates the neutral region. This graph shows that the electrophilic sites are located around the hydrogen atoms, whereas the nucleophilic sites are located around the oxygen atoms. MEP surface represents a proof of the creation of hydrogen bond [32]; it is defined as a donor acceptor interaction. The negative region plays an important role in forming a hydrogen bond interaction with the protein. This is well correlated with molecular docking study as well as molecular dynamics study. The electrostatic potential of the donor becomes less negative as the acceptor becomes more negative. The contour map of electrostatic potential confirms that the different negative and positive potential sites of the molecule are in accordance with the total electron density surface map.
Natural Bond Orbital (NBO) Analysis
The strength of the interaction between electron donors and the electron acceptors, or the donating tendency which is from electron donors [33] to electron acceptors and hence the degree of conjugation of the system is measured by the value of energy of the hyperconjugative interactions, E(2). In order to evaluate the donor–acceptor interactions, the second-order Fock matrix was carried out in NBO analysis [34]. For each donor (i) and acceptor (j), the stabilization energy E(2) associated with the delocalization i→j is estimated as:
E(2) = qi F(i,j) /( εi - εj)
Where qi is the donor orbital occupancy, εi and εj are diagonal elements and F(i,j) is the off diagonal NBO Fock matrix element between the natural bonding orbitals.
Delocalization of electron density between occupied Lewis type (bond or lone pair) NBO orbitals and formally unoccupied (antibonding and Rydberg) non- Lewis NBO orbitals correspond to a stabilizing donor–acceptor interaction. The NBO analysis has been performed on the compound using NBO 3.1 program as implemented in the Gaussian 09W package in order to elucidate the intramolecular interaction, re-hybridization and delocalization of electron density within the molecule are presented in Table S2. For the title compound, the stabilization energy E(2) values are chemically important and are used to estimate the intramolecular delocalization. Interactions between the bonding orbital s(C15-C16), s(C15-C24) and s(C22 - C24) and the anti- bonding orbital s*(C15 - C24), s*(C15- C16) and s*(C15-N 26) possess medium stabilization energy roughly equal to 5.5 kcal/mol. In addition, the interactions between the p (C4 - C6), p (C9 - C11), p (C16 - C18) and p (C22 - C24) bonding orbitals and antibonding orbitals LP*(1) C8, LP*(1) C8, LP*(1) C15 and LP*(1) C15 lead to an average stabilization energy around 52.5 kcal/ mol. Similarly, the strongest stabilization energies are occurred in p (C4 - C6)→LP (1) N1 and p (C9 - C11)→LP (1) N1 with 118.91 and 119.09 kcal/ mol, respectively. Furthermore, the resonance interaction energies for the donor-acceptor excitations of the LP (N) bonding orbitals to p* antibonding orbitals are LP (1) N1→p*(C4 - C6) 48.1 kcal/ mol, LP (1) N1→p*(C9 - C11) 47.51 kcal/ mol, LP (1) N 20→p*(C16 - C18) 42.93 kcal/ mol and LP (1) N 20→p*(C22 - C24) 41.07 kcal/ mol. On the other hand, the NBO analysis of ((4-APH)(4-APH2)[AsO4]·H2O) clearly explains the evidences of the formations of strong interaction between LP(N) and σ* (As - O) anti-bonding orbitals and are given in Table S2. The strongest stabilization energies are occurred in s*(As30 - O31)→s*(As30 - O33) and s*(As30 - O34)→ s*(As30 - O33) with 165.72 and 167.76 kcal/ mol, respectively. NBO analysis confirms the existence of X-H…Y hydrogen bonds between the different interactions donor-acceptor, as, for example, the hyperconiugative interactions energy between O31-H2 involving the lone pair (LP(1), and LP(3)) on the oxygen atom (O31). The stabilization energy of [LP(1)O31-σ*(N1-H2)] and [LP(3)O31-σ*(N1-H2)] is 8.56 and 12 kcal/ mol, respectively. This result may be justified by the extent of overlap between the lone pair orbitals (LP (1) and LP (3)) of O31 and the σ*(N1-H2). According to NBO results, the strong donor-acceptor interactions occurred in the title compound implies good nonlinear optical properties. Finally, we can conclude that the NBO analysis confirms that the hydrogen bonding in the (4-APH)(4-APH2)[AsO4]·H2O compound leads to its crystal structure.
AIM approach: topological parameters at bond critical points (BCP)
In the AIM theory the nature of the bonding interaction can be determined through an analysis of the properties [35] of the charge density, ρ, and its Laplacian ∇2ρ, local potential energy density (V(r)), local gradient kinetic energy density (G(r)), total energy density (H(r) = (V(r) + G(r)) and the bond energy E at the BCPs, and through the properties of the atoms, which are obtained by integrating the charge density over the atom orbitals [35]. In addition, the ellipticity (ε) at the BCP is a sensitive index to monitor the π -character of bond. The ε is related to λ1 and λ2 which correspond to the eigen values of Hessian and is defined by the relationship: ε = (λ1/ λ2)-1. Hence, the AIM graph displaying all the BCPs in the asymmetric unit is presented in Fig. 3. The topological parameters calculated at BCPs are detailed in Table 1. According to the BCP analysis of Table 1 and Based on the Rozas et al. [36] criterion all of the seven hydrogen bonds are considered weak since the Laplacian and the energy density values are positive. The electron density ρ is low and its corresponding Laplacian ∇2ρ is positive at all BCPs and are in the range of 0.0040 - 0.0367 a.u. and 0.0135 - 0.1217 a.u., respectively. According to Koch and Popelier criteria [37], the hydrogen bonding interaction should have ρ and ∇2ρ values within the range 0.0020 - 0.0400 and 0.0240 - 0.1390 a.u, respectively. Referring to Table 2, the most strong interaction is found for O31···H2 contact (ρ = 0.0367 and ∇2ρ = 0.1217 a.u.) with an energy that is equal to 41.78 kJ. mol-1. In order to investigate the effect of π-electron delocalization in bonds associated with N and O atoms of N-H···O, the analysis of the bond ellipticity is performed. The ellipticities (ε) of bond of aromatic ring at BCP are in range of 0.028-1.629. The ε values confirm the presence of resonance assisted intermolecular hydrogen bonds.
Noncovalent interaction-Reduced Density Gradient (RDG) analysis
To prove the existence of weak interactions [38,39], NCI plots are generated with the plots of the RDG S versus (sign λ2)ρ, where (sign λ2)ρ is the electron density multiplied by the sign of the second Hessian eigenvalue (λ2). The value of (sign λ2)ρ is useful to predict the nature of interaction; for a repulsive interaction (sign λ2)ρ > 0 (steric effect in ring and cage) and for attractive interaction (sign λ2)ρ < 0 (hydrogen bonds). The values close to zero indicating Van der Waals interactions.
To study non-covalent interactions, Johnson et al. [40] developed an approach based on the electronic density and its derivatives named RDG. The RDG were defined using the following equation.

The strength and nature of interactions can be interpreted from the product sign λ2 times ρ, as blue, green, and red color codes are used to describe stabilizing H-bonding, Van der Waals, as well as destabilizing steric interaction, respectively. The results were collected in Fig. 4a and illustrate the attractive, Van der Waals and repulsive interactions in the present structure. The NCI-RDG graph of the title compound is plotted in Fig. 4b. The observed red areas (spots) indicate steric repulsions and are localized mostly in the middle of benzene rings. The observed green and blue areas between the organic and the inorganic parts indicate the existence of Van der Waals and steric effects.
Frontier Molecular Orbital Analysis
In order to evaluate the energetic behavior [41], we carried out the calculations in gas phase and in solvent. The calculated energy values of HOMO and LUMO are around -6.60 eV and 1.40 eV, respectively, in the gas phase and in water. The energies and the pictorial illustration of HOMO, LUMO, HOMO-1 and LUMO+1 frontier molecular orbitals are shown in Fig. 5. The brown color refers to the positive phase, which indicates the nucleophilic site. The negative phase is indicated by green color, and is related to the electrophilic site. Accordingly, the energy gap of HOMO-LUMO explains the eventual charge transfer interaction within the molecule. Furthermore, in going from the gas phase to the solvent phase, the increasing value of the energy gap and molecule becomes more stable and the low values of frontier orbital gap in (4-APH)(4-APH2)[AsO4]·H2O make it more reactive. Additionally, a molecule with a small frontier orbital gap is readily polarizable and normally exhibits high chemical reactivity and low kinetic stability [42-44]. Furthermore, the global chemical reactivity descriptors (GCRD) are another vital technique to understand the chemical properties of a molecule such as chemical hardness (η), chemical potential (μ), chemical softness (S), electronegativity (χ) and electrophilic index (ω). The formula (Eq. 1 to Eq. 5) to obtain GCRD is derived from HOMO-LUMO energies, taking the HOMO energy as ionization potential (I) and LUMO as electron affinity (A) and the data are tabulated in Table 2. The concept of these parameters is related to each other [34,45-47] where:
Chemical hardness (η) = [(ELUMO - EHOMO) / 2] Eq. 1
Chemical softness (S) = [1/2η] Eq. 2
Chemical potential (μ) = [(EHOMO + ELUMO) / 2] Eq. 3
Electronegativity (χ) = [(I + A) /2] Eq. 4
Electrophilicity index (ω) = [μ2 /2η] Eq. 5
Using the above equations, the chemical potential, hardness and electrophilicity index have been calculated and their values are shown in Table 2. The ionization potential value indicates that energy of 6.60 eV in gas phase is required to remove an electron from the HOMO. The lower value of electron affinity shows higher molecular reactivity with the nucleophiles. Higher hardness and lower softness values confirm the higher molecular hardness associated with the molecule. The electrophilicity index helps in describing the biological activity of the compound.
Non-linear optical effects (NLO)
The application of (4-APH)(4-APH2)[AsO4]·H2O in the field of non linear optics was investigated through the hyperpolarizability calculation by analyzing the vibrational modes of the optimized molecular geometry. The calculated values of dipole moment, polarizability and first order hyperpolarizability and their components in gas phase and water solvent are listed in Table 3. However, the values of α and β from Gaussian output are given in atomic units (a.u.) and converted into electronic units (esu) (α; 1 a.u. = 0.1482 ×10⁻²⁴ esu, β; 1 a.u. = 8.6393×10⁻³³ esu). The total dipole moment (μt) and first order hyperpolarizability (βt) are found to be 39.1985 Debye and 2205.2506×10−33 esu, respectively. According to the NLO results, the crystal has a total dipole moment of 28.54 times greater than that of urea. The first order hyperpolarizability is more than 5.91 times greater than that of urea (μ and β of urea are 1.3732 Debye and 0.3728×10⁻³⁰ esu) and 3.22 times that of the reference crystal KDP (βKDP = 6.85×10⁻³¹ esu) [48]. In addition, it is associated with intra-molecular charge transfer that is attributed to electron cloud movement through π - conjugated framework from electron donor to electron acceptor groups. Therefore, the components of hyperpolarizability are useful to understand charge delocalization in the molecule. The maximum charge delocalization occurs along βxxx in the molecule under investigation. According to this result, this compound may exhibit excellent nonlinear optical properties.
Thermodynamic analysis
The computed parameters were summarized in Table 4. On the basis of vibrational analysis at B3LYP/ 6-31G (d, p), the standard statistical thermodynamic functions: heat capacity Cp,mo entropy Smo and enthalpy change Hmo for the title compound were calculated within the temperature range from 100 to 1000 K and as observed in Table S3. From Fig. S1, it can be observed that these thermodynamic functions are increasing with temperature due to the fact that the molecular vibrational intensities increase with temperature [49]. The correlation equations between the thermodynamic functions and temperatures were fitted by quadratic formulas, and R is the corresponding fitting factors (R2) for the thermodynamic properties. The corresponding R2 fitting factor of each thermodynamic quantities Cp,mo, Smo, and Hmo are 0.99956, 0.9998 and 0.99955, respectively. The corresponding fitting equations between thermodynamic properties and temperature are as follows:
Cp,mo = 57.73802+ 1.14384T -5.10116 ´ 10-4 T2
Smo = 295.48957+ 1.44264T -4.09224 ´ 10-4 T2
Hmo = -17.75073+0.19291T+2.8839 ´ 10-4 T2
All the thermodynamic data afford helpful information for the study of thermodynamic energies and estimate directions of chemical reactions according to the second law of thermodynamics in thermo chemical field [50]. Please note that all thermodynamic calculations were done in gas phase and they could not be used in solution.
Hirshfeld Surface Analyses
The molecular Hirshfeld surface [51,52]: dnorm, shape index, curvedness, de and di for the title compound are illustrated in Figs. S2(a-e) and mapped over: dnorm ranges (-0.632 to 1.120 Å), shape index ranges (- 1.000 to 1.000 Å), curvedness (-4.000 to 0.400 Å), de ranges (0.718 to 2.411 Å) and di ranges (0.719 to 2.430 Å), respectively. The examination of the full distribution of intermolecular interactions is shown in 2D map fingerprint plots (Fig. S3). The asymmetric property of the compound is due to the hydrogen bonds and the intermolecular interactions within the crystal. The 2D fingerprints (Fig. S3a) show that the intermolecular, O···H and H···H interactions are the dominant contacts. Fig. S3b represents the O···H/ H···O contacts between the hydrogen atoms located inside the Hirshfeld surface and the oxygen atoms characterized by two symmetrical points located at the top left and right. The largest contribution to the total Hirshfeld area is about (42.4%). Fig. S3c illustrates the interaction H···H. The contribution to the surface hirshfeld about (37.6%) in the surface grouped points which occupy half of surface. Fig. S3d shows the interaction between groups C···H/ H···C. These interactions have a contribution to the surface hirshfeld of (12.4%). The contribution of other intermolecular interactions is found to be in decreasing order: [C···C (3.7%), N···H (2.5%), N···C (1%), C···O (0.2%), N···O (0.1%) and H···As (0.1%)]. Fig. S4 summarized the distribution of individual intermolecular interactions on the basis of HS analysis for the title compound.
Vibrational studies
The experimental and theoretical FT-IR and FT-Raman spectra were shown in Figs. 6 and 7, respectively. Theoretically computed frequencies with their relative intensities, probable assignments and potential energy distribution (PED) are summarized in Table S4. To the assignments, only potential energy distributions (PED) contributions ≥ 10% and the experimental IR spectrum were considered. The theoretical intensities show slight deviations from the experimental values since the theoretical wavenumbers are obtained from the isolated molecule in the gaseous phase and the experimental wavenumbers are obtained from the isolated molecule in solid state.
Arsenate groups vibrations
According to the literature, the isolated arsenate anion [AsO4]3- with Td point group symmetry led to four Raman active normal modes: n1(A1), n2(E), n3(F2) and n4(F2) with average wavenumbers 837, 349, 887 and 463 cm-1, respectively [53]. n1 and n3 involve the symmetric and the asymmetric stretching mode of the As–O bond, whereas n2 and n4 involve mainly O–As–O symmetric and asymmetric bending modes. We have distinguished the four fundamental modes (ν1, ν2, ν3 and ν4) of the [AsO4]3- anion in the wave number region from 300 to 1000 cm-1. In the region, the [AsO4]3- stretching and bending vibrations expected to appear, as well as the modes associated with the internal modes of the organic cations. The band at 850 cm-1 in Raman spectrum is assigned to the asymmetric stretching 𝜈3 mode of the arsenate ion. In IR spectrum, this mode also appears as a single band at 865 cm-1 (with PED contribution of 93%). The band related to the symmetric stretching mode ν1 vibration is located at 817 cm-1 in the IR spectrum while in the Raman spectrum it is absent. The bands concerned with the asymmetric and symmetric bending vibration ν4 and ν2 of the arsenate ion are identified in the 550-700 cm-1 and 300-450 cm-1 frequency regions respectively. The very strong band observed in the Raman spectrum at 667 cm-1 and the strong band at 677 cm-1 in the IR spectrum can be easily assigned to 𝜈4 mode (with PED contribution of 88%). The same bending vibration is predicted at 665 and 677 cm-1 respectively, by DFT method. The symmetric mode 𝜈2 appears in the Raman spectrum as a shoulder band at 410 cm-1. This mode is theoretically calculated at 374 cm-1 by DFT method. As seen from Table S4, all modes associated to the arsenates groups are well reproduced by theoretical method.
C-H vibrations
Heterocyclic aromatic compounds and its derivatives are structurally very close to benzene. The C- H stretching frequency of such compounds falls very nearly in the region 3000 - 3100 cm-1 which is the characteristic region for the ready identification of C–H stretching vibrations. Hence, the both FT-IR and FT-Raman bands were observed at 3095 cm-1 and 3059 cm-1 assigned to CH asymmetric stretching. It is noticeable that asymmetric stretching vibrations occurred at higher wave number. The theoretically calculated harmonic wavenumber at 3230 cm-1 and 3094 cm-1 in B3LYP/6-31G(d,p) basis set respectively with PED contribution of 86%.
N-H vibrations
Generally, NH stretching modes cause to vibrational bands in absorption region above 3000-3500 cm-1. This band in the FT-IR spectrum is observed at 3432 cm-1, but the mode is not observed Raman spectra of the molecule. The theoretically calculated harmonic wavenumber at 3452 cm-1 and 3307 cm-1 in B3LYP/6-31G(d,p) basis set respectively with PED contribution of 97%. On the other hand, the NH2 in plane bending (scissoring) mode are observed as an individual band at 1592-1602 (IR-Raman). The theoretically calculated harmonic wavenumber at 1627 cm-1 and 1599 cm-1 in B3LYP/6-31G(d,p) basis set respectively with PED contribution of 89%.
C=C vibrations
The C=C skeletal stretching vibrations in aromatic rings generally appear at 1430-1625 cm-1
[54-55]. While the C=C stretching modes in the benzene rings of the molecule are observed at 1436 cm-1 in FT-IR and 1435 cm-1 in FT-Raman spectra. The wavenumber values calculated for these C=C vibrations are calculated at 1467 and 1442 cm-1 with 45% contributions of PED, respectively. Also it is observed at 1648 cm-1 in FT-IR spectrum. The theoretically calculated harmonic wavenumber at 1697 and 1668 cm-1 with B3LYP/6- 31G(d,p) basis sets in both FT-IR and FT-Raman spectra respectively.
C-N vibrations
The identification of C-N stretching modes in the side chains is a rather difficult task since there are problems in identifying these frequencies from other vibrations. The vibrational bands observed at 1336 and 1332 cm-1 in FT-IR and FT-Raman spectra are assigned to C-N vibrations. The theoretically calculated harmonic wavenumber at 1333 and 1310 cm-1 respectively with PED contribution of 56%. Additionally, the C-NH and C-NH2 stretching band are observed at 1040 and 1057 cm-1 in IR and Raman spectra. The wavenumber values calculated for these CN vibrations are calculated at 1074 and 1057 cm-1 with 67% contributions of PED, respectively.
O-H vibrations
At high wavenumbers, the IR and Raman spectra show an absorption band centered at 3042 and 3036 cm-1, respectively, which is assignable to the stretching vibration mode of water molecules (O–H). The theoretically computed values using DFT calculations are 3083 cm-1 and 2954 cm-1 (with PED contribution of 91%) are in good agreement with the experimental values.
Molecular docking simulation, druggability and pharmacokinetics
Molecular docking is a powerful computational tool for predicting the binding affinity of a ligand with proteins which is very useful in modern structure based drug designing [26,28]. The binding interactions of the ligand with the target protein or enzyme are generally through intermolecular bonds [27,29,30]. This method is crucial in drug design and it’s is frequently the preferred way for estimating the bioactive conformation of the ligand in the protein binding region [28,56,57]. Using iGEMDOCK program, we can determine the interaction energy of a ligand with a protein (also called free energy binding). Generally, this interaction energy is not found from a single structure. In fact, it corresponds to the average energy of several stable structures. The results reveal four docked poses, so four energy values. The best position that has the lowest energy corresponds to the most stable protein/ligand complex [58,59]. Docking calculations of interaction energies were subsequently clustered in Table 5. Fig. 8 represents the molecular docking of Alpha-synuclein protein (3q25) with the two ligands that are Aresnic and Maltose. Molecular docking led to the following results: the total energies equal to -93.6683 and -107.384 kcal/mol for Aresnic and Maltose interacting with Alpha-synuclein protein, respectively. Likewise, for Alpha-synuclein protein, the Maltose ligand is the strongest binding since it possesses the strongest energy (in absolute value) -107.384 kcal/mol, the van der Waals interaction -55.243 kcal/mol, the strongest averconpair 26.3043 kcal/mol and H-bond interaction -52.1406 kcal/mol. The ligand Aresnic is found with energy equal to -93.6683 kcal/mol. Following the previous observations, a new protein was studied called Rho-kinase (2f2u) in interaction with the following Ligand: Aresnic and 5-(1,4-diazepan-1-sulfonyl) isoquinoline (M77). Localization of the best docked poses of these complexes estimated via docking calculations is given in Fig. 9. Table 5 analysis shows that our compound 5-(1,4-diazepan-1-sulfonyl) isoquinoline takes the highest energy value which is equal to -95.4741 kcal/mol, also it presents the strongest van der Waals interaction -75.5128 kcal/mol) and averconpair 28.2 kcal/mol. According to the docking results, the interactions observed between Alpha-synuclein (and also between Rho-kinase) with the Aresnic ligand show the good efficacy of inhibition of the studied compound, indicating that they are promising inhibitors in the treatment of Alzheimer's diseases and in general way of psychic diseases. Later on, the antiviral potential of the compound was assessed. Four different proteins were targeted: 6LU7, 6M0J, 6M2N and 7BTF. The binding affinities of the complex, its interaction bonds, the closest interacting residues and the distance to closest interacting residues are shown in table 6. The results showed negative binding energies ranging from -3.1 to -4.1 kcal/mol and up to five conventional hydrogen bonds, particularly with 6LU7, which is the SARS-CoV-2 main protease [58,60]. The latter is highly involved in SARS-CoV-2 inducing COVID-19 pathogenesis and even its complication with acute respiratory distress syndrome, which might lead to death [60]. Regarding the measure of the distance to the closest interaction residue, it has been predicted that it ranges between 2.267 A to 2.714 A for 6M0J and 6LU7 respectively, which suggest that the compound is strongly embedded in the different protein pocket regions. These data prove that the compound filled well into the pocket region of the targeted proteins and established conventional hydrogen bonds, electrostatic and hydrophobic bonds, which satisfactory support the potential biological effect of the compound, particularly its antiviral effect as compared with previous published reports [26,59,60]. In fact, it has been reported that several biological and synthesized compounds possessed potential ameliorative effect against SARS-CoV-2 inducing COVID-19 [26,59,60,61]. To rationalize these results and the possible use of its novel organic arsenate templated by 4-aminopyridine compound, its lipophilicity, druggability, medicinal chemistry and pharmacokinetics were assessed. The findings are shown in table 7. The compound showed acceptable consensus Log Po/w and bioavailability score (0.97). While its absorption via both the gastro-intestinal tract and the skin were low (Log Kp = -10.51 cm/s), it was not categorized as blood-brain-barrier (BBB) permeant but it was a substrate of the p-glycoprotein. Cytochrome P450 (CYP) isoforms, such as CYP1A2, CYP2C19, CYP2C9, CYP2D6 and CYP3A4, are commonly used in biotransformation of drugs and xenobiotics [27,30,58]. In this study, the screened CYP enzyme isoforms data indicate that the compound is inhibiting none of these isoenzymes. Thus, suggesting promising pharmacokinetic properties.
The structural, spectroscopic, electronic and thermodynamic investigations on ((4-APH)(4-APH2)[AsO4]·H2O) compound were performed using both experimental and computational methods. The geometric parameters and vibrational frequencies of the compound were determined by DFT method. The calculated and experimental geometrical parameters are in good agreement with the structural crystal structures; the small differences are due to the performance of computation for a single molecule in gas phase. The wave numbers calculated were assigned using potential energy distribution. The MEP exhibits the visual representation of the chemically active sites and comparative reactivity of atoms; these sites give information about the region from where the compound can have intermolecular interactions. The stabilization energy has been calculated from second order perturbation theory. The NBO analysis confirms the hyper conjugation interaction. The non-covalent interactions were studied through AIM and RDG analysis. The HOMO and LUMO energies were calculated and the energy gap was determined as 5.802 eV in gas phase. The Non-Linear Optical (NLO) properties were theoretically calculated and it was found that the predicated first order hyperpolarizability value is greater than that of Urea. The thermodynamic properties of the compound were calculated at different temperatures and the correlations among the properties and temperatures were obtained. These data provides useful information for further study on ((4-APH)(4-APH2)[AsO4]·H2O) with relation to thermodynamic properties. The Hirshfeld surface analysis and finger print plots were examined to understand the intermolecular within the compound. Interestingly, the molecular docking of title molecule suggests that it can bind and inhibit the receptor enzymes. In summary, the correlation between experimental results and computed data are in a good harmony for this compound, which possesses acceptable druggability and pharmacokinetic properties.
Ethics approval and consent to participate Not applicable
Consent for publication Not applicable
Availability of data and materials All data generated or analysed during this study are included in this published article.
Conflict of interest No funds, grants, or other support was received.
Author contributions Conceptualization, NM, NI and HN; Methodology, NM, SD, NI, RB and HN; Validation, NM, JKL, SD, NI, SN, RB, BB and HN-Original draft preparation, NM; Writing-review and editing, NM, NI and HN; Supervision, NI, BB and HN; Funding acquisition, RB, NI, SN, BB and HN.
Acknowledgements The authors extend their appreciation to the Deanship of Scientific Research at King Khalid University for funding this work through a research groups program under Grant Number R.G.P. 2/213/43.
- B. Saparov, D. B. Mitzi, Chemical reviews 116, 4558 (2016).
- A. K. Cheetham, C. Rao, R. K. Feller, Chemical communications 46, 4780 (2006).
- N. Hfidhi, I. bkhairia, D. Atoui, J. Boonmak, M. Nasri, R. Ben Salem, S. Youngme, H. Naïli, Appl. Organomet. Chem., 4793 (2019).
- S. Dgachi, A.M. Ben Salah, M.M. Turnbull, T. Bataille, H. Naïli, J. Alloys Compd., 726, 315 (2017).
- A.M. Ben Salah, H. Naïli, M. Arczynski, M. Fitta, J. Organomet. Chem., 805, 42 (2016).
- N. Mhadhbi, S. Saïd, S. Elleuch, H. Naïli, J. mol. Struct. 1108, 223 (2016).
- N. Mhadhbi, S. Saïd, S. Elleuch, T. Lis, H. Naïli, J. mol. Struct. 16 (2015).
- S. Walha, H. Naïli, S. Yahyaoui, B. F. Ali, M. M. Turnbull, T. Mhiri, S. W. Ng. J. Supercond. Nov. Magn. 26, 437 (2013).
- C. Sanchez, B. Julian, P. Belleville, M. Popall, J.Mater.Chem.15, 3559 (2005).
- X.-H. Lv, W.-Q. Liao, P.-F. Li, Z.-X. Wang, C.-Y. Mao, Y. Zhang, J. Mater. Chem.C 4, 1881 (2016).
- X. Guo, C. McCleese, C. Kolodziej, A. C. Samia, Y. Zhao, C. Burda, Dalton Transactions 45, 3806 (2016).
- T.-B. Song, Q. Chen, H. Zhou, C. Jiang, H.-H. Wang, Y. M. Yang, Y. Liu, J. You, Y. Yang, Journal of Materials Chemistry A 3, 9032 (2015).
- Issaoui N., Ghalla H., Brandan S. A., Bardak F., Flakus H.T., Atac A., Oujia B., J. Mol. Struct. 1135, 209 (2017).
- S. Gatfaoui, N. Issaoui, T. Roisnel, H. Marouani, J. Mol. Struc 1191, 183 (2019).
- N. Mhadhbi, H. Naïli, K. Jarraya, J. Physica E 87, 171 (2017).
- M. J. Frisch, et al., GAUSSIAN 09, Revision A.02, Gaussian, Inc., Wallingford, CT, 2009.
- A.D. Becke, J. Chem. Phys. 104, 1040 (1996).
- C. Lee, W. Yang, R.G. Parr Phys Rev B 37, 785 (1988).
- P.J. Hay, W.R. Wadt, J. Chem. Phys. 82, 299 (1985).
- R. Dennington, T. Keith, J. Millam, GaussView, Version 5, Semichem Inc., Shawnee Mission, KS, 2009.
- E.D. Glendening, J.K. Badenhoop, A.D. Reed, J.E. Carpenter, F. Weinhold, NBO 3.1, Theoretical Chemistry Institute, University of Wisconsin, Madison, WI, Oxford, 1996, ISBN 0198558651, p. 1990.
- Lu, T., Chen, F. Multiwfn: A multifunctional wavefunction analyzer. J. Comput. Chem. 33, 580 (2012).
- M. Turner, J. McKinnon, S. Wolff, D. Grimwood, P. Spackman, D. Jayatilaka, M. Spackman, CrystalExplorer17; University of Western Australia: Crawley, WA, 491 Australia, 2017.
- J.M. Yang, C.C. Chen, GEMDOCK: A generic evolutionary method for molecular docking, Proteins Struct. Funct. Bioinforma. 55, 288 (2004).
- J.M. Yang, T.W. Shen, A pharmacophore-based evolutionary approach for screening selective estrogen receptor modulators, Proteins Struct. Funct. Bioinforma. 59, 205 (2005).
- N. Mhadhbi, N. Issaoui, W.S. Hamadou, J.M. Alam, A.S. Elhadi, H. M. Adnan, Naïli, R. Badraoui, ChemistrySelect (2022) in press. https://doi.org/10.1002/slct.202103592
- K. Hchicha, M. Korb, R. Badraoui, H. Naïli, New J Chem. 45, 13775 (2021). Doi: 10.1039/D1NJ02388H.
- R. Badraoui, M. Saeed, N. Bouali, W.S. Hamadou, S. Elkahoui, M.J. Alam, A,J. Siddiqui, M. Adnan, M. Saoudi, T. Rebai, Calcif. Tissue Int. (2022), in press. https://doi.org/10.1007/s00223-021-00931-3.
- A. Akacha, R. Badraoui, T. Rebai, L. Zourgui, J. Biomol. Struct.Dyn. (2022) in press. https://doi.org/10.1080/07391102.2020.18561878
- R. Badraoui, T. Rebai, S. Elkahoui, M. Alreshidi, V.N. Veettil, E. Noumi, K.A. Al-Motair, K. Aouadi, A. Kadri, V. De Feo, M. Snoussi. Allium subhirsutum L. as a Potential Source of Antioxidant and Anticancer Bioactive Molecules: HR-LCMS Phytochemical Profiling, In Vitro and In Vivo Pharmacological Study. Antioxidants 9, 1003 (2020),
- Sagaama A, Noureddine O, Brandan SA, Jedryka AJ-, Flakus HT, Ghalla H, Issaoui N, Comput. Bio.Chem. 87, 107311 (2020).
- N. Mohan, C.H. Suresh, J. Phys. Chem. 118, 1697 (2014).
- F. Weinhold, C.R. Landis, Valency and Bonding: A Natural Bond Orbital Donor–Acceptor Perspective, Cambridge University Press, Cambridge, 2005.
- T. B. Issa, A. Sagaama, N. Issaoui, Comput. Biol. Chem. 86, 107268 (2020).
- Bader R. F. W., Atoms in Molecules, A quantum Theory, Clarendon Press, Oxford, (1990).
- I. Rozas, I. Alkorta, J. Elguero, Behavior of Ylides Containing N, O, and C Atoms as Hydrogen Bond Acceptors, J. Am. Chem. Soc. 122, 11154 (2000).
- U. Koch, P. Popelier, J. Phys. Chem. A 99, 9747e (1995).
- G. Saleh, C, Gatti, L. Lo Presti, J. Contreras-Garcia, Chemistry 18, 15523 (2012).
- D.L. Lande, S.A. Bhadane, S.P. Gejji, J. Phys. Chem. 121, 1814 (2017).
- E.R. Johnson, S. Keinan, P. Mori-S_anchez, J. Contreras-García, A.J. Cohen, W. Yang, J. Am. Chem. Soc. 132, 6498 (2010).
- I. Jomaa, O. Noureddine, S. Gatfaoui, N. Issaoui, T. Roisnel, H. Marouani, J. Mol.Struc, 1213, 128186 (2020).
- N. Issaoui, H. Ghalla, S. Muthu, H. T. Flakus, B. Oujia, Spectrochimica Acta Part A: Mol. Biomol. Spectrosc. 136, 1227 (2015).
- D.F.V. Lewis, C. Ioannides, D.V. Parke, Interaction of a series of nitriles with the alcohol-inducible isoform of P450: computer analysis of structure-activity relationships, Xenobiotica 24, 401 (1994).
- N. Issaoui, H. Ghalla, S. A. Brandán, F. Bardak, H.T. Flakus, A. Atac, B. Oujia, J. Mol. Struc. 1135, 209 (2017).
- R. G. Parr, R. A. Donnelly, M. Levy, and W. E. Palke, the Journal of Chemical Physics, 68, 3801 (1977).
- R. G. Parr, R. G. Pearson, Journal of the American Chemical Society 105, 7512 (1983).
- P. Geerlings, F. De Proft, and W. Langenaeker, “Conceptual density functional theory,” Chemical Reviews 103, 1793 (2003).
- N. Elleuch, W. Amamou, A.B. Ahmed, Y. Abid, H. Feki, Spectrochim. Acta, Part A 128, 781 (2014).
- J. BevanOtt, J. Boerio-Goates, Chemical Thermodynamics: Principles and Applications, Academic Press, San Diego, 2000.
- R. Zhang, B. Du, G. Sun, Y. Sun, Spectrochim. Acta A 75, 1115 (2010).
- S. Gatfaoui, N. Issaoui, T. Roisnel, H. Marouani, J. Mol. Struc 1191, 183 (2019).
- J.J. Mac Kimon, M.A. Spackman, A.S. Mitchell, Acta Crystallogr., Sect. B: Struct. Sci. 60, 627 (2004).
- K. Nakamoto, Infrared and Raman Spectra of Inorganic and Coordination Compounds Part A; Theory and Applications in Inorganic Chemistry (Wiley, New York), p. 202 (1986).
- M. Durgun, Ü. Ceylan, Ş.P. Yalçın, H. Türkmen, N. Özdemir, İ. Koyuncu, J. Mol. Struct. 114, 95 (2016).
- Y. Sert, M. Karakaya, Ç. Çırak, B. Eskiyurt, M. Kürekçi, J. Sulfur Chem. 36, 450 (2015).
- U. Kragh-Hansen, Pharm. Rev. 33, 17 (1981).
- U. Kragh-Hansen, Biochem. J. 225, 629 (1985).
- R. Badraoui. M. Saoudi, W.S. Hamadou, S. Elkahoui, A.J. Siddiqui, M.J. Alam, A.M.E. Suleiman, M.M. Alreshidi, D.K. Yadav, H. Naïli, H. Ben-Nasr. Pharmaceuticals 15,129 (2022).
- R. Badraoui, M. Adnan, F. Bardakci, M.M. Alreshidi. Molecules, 26(3), 637 (2021).
- H. Ben-Nasr, R. Badraoui. Braz. J. Pharmaceut. Sci. (2022), in press.
- R. Badraoui, M.M. Alrashedi, M.V. El-May, F. Bardakci. J. Biomol. Struct. Dyn. 39, 6842 (2021).
Table 1: Topological parameters (in a.u.) calculated at BCPs : electron density ρ(r), Laplacian of electron density ∇2ρ(r), lagrangian kinetic energy density G(r), energy density H(r), electron potential energy density V(r), ellipticity ε and estimated interaction energy (Eint, in kJ/mol).
|
BCP |
ρ(r) |
∇2ρ(r) |
G(r) |
H(r) |
V(r) |
ε |
-V(r)/G(r) |
Eint |
|
O35....H12 |
0.0040 |
0.0135 |
0.0026 |
0.0008 |
-0.0017 |
1.629 |
0.68 |
-2.25 |
|
O31....H2 |
0.0367 |
0.1217 |
0.0313 |
-0.0086 |
-0.0321 |
0.037 |
1.03 |
-41.78 |
|
O33....H36 |
0.0311 |
0.1020 |
0.0259 |
-0.0004 |
-0.0263 |
0.028 |
1.02 |
-34.17 |
|
O32....H5 |
0.0047 |
0.0154 |
0.0030 |
0.0089 |
-0.0021 |
1.307 |
0.70 |
-2.68 |
|
O32....H19 |
0.0097 |
0.0327 |
0.0069 |
0.0012 |
-0.0057 |
0.055 |
0.82 |
-7.41 |
|
C4....H19 |
0.0049 |
0.0187 |
0.0035 |
0.0012 |
-0.0023 |
0.667 |
0.65 |
-2.95 |
|
C6....H17 |
0.0049 |
0.0162 |
0.0031 |
0.0009 |
-0.0022 |
0.258 |
0.70 |
-2.83 |
Table 2. Global reactivity descriptors and calculated frontier molecular orbital parameters in gas and in solution phase for (4-APH)(4-APH2)[AsO4]·H2O.
|
Parameters (eV) |
TD-DFT |
|
|
Gas |
Water |
|
|
EHOMO |
-6.60366231 |
-6.46107458 |
|
ELUMO |
-0.801647815 |
1.4071014 |
|
|EHOMO - ELUMO| Gap |
5.8020 |
5.0540 |
|
Electron affinity (A) |
0.801647815 |
-1.4071014 |
|
Electrophilicity index (ω) |
2.3621 |
0.8250 |
|
Ionization potential (I) |
6.60366231 |
6.46107458 |
|
Electronegativity (χ) |
3.7024 |
2.5269 |
|
Chemical potential (μ) |
-3.7026 |
-2.5269 |
|
Chemical hardness (η) |
2.9010 |
3.9340 |
|
Chemical softness (S) |
0.1723 |
0.1271 |
The hardness η : η = (I ̶ A) / 2 where A is the ionization potential and I is the electron affinity [A= -ELUMO , I= -EHOMO], the chemical potential μ, : μ = - (I + A) / 2; the softness, S: S=1/2η; the electronegativity χ : χ = (I + A) /2 and, the electrophilicity index ω : ω = μ2 /2η
Table 3: The calculated electric dipole moment m (D) the average polarizability α tot (× 10-24esu) and the first hyperpolarizability β tot (× 10-33esu) for the ((4-APH)(4-APH2)[AsO4]·H2O).
|
Parameter |
Values |
Parameter |
Values |
||
|
In gas phase |
In water |
In gas phase |
In water |
||
|
μx |
-8.2917 |
20.8079 |
βxxx |
238.671722 |
78.2357627 |
|
μy |
2.2315 |
32.9977 |
βxxy |
265204005 |
-262.545483 |
|
μz |
5.4462 |
-3.8353 |
βxyy |
134.420170 |
204.211743 |
|
μ (D) |
10.168234 |
39.198551 |
βyyy |
180.192195 |
-52.2925440 |
|
αxx |
183.635 |
258.756 |
βxxz |
103.177765 |
-40.5568964 |
|
αxy |
8.426 |
-20.279 |
βxyz |
28.6644552 |
-39.1340998 |
|
αyy |
197.755 |
200.127 |
βyyz |
-12.9039043 |
140.539378 |
|
αxz |
-14.771 |
26.332 |
βxzz |
22.7123002 |
-105.628275 |
|
αyz |
24.864 |
-0.115 |
βyzz |
57.4370050 |
138.082739 |
|
αzz |
142.243 |
222.653 |
βzzz |
61.9673746 |
-48.5122610 |
|
α0 (esu) |
174.54451a.u. |
227.17849 a.u. |
β (esu) |
657.78384 a.u. |
255.25802 a.u. |
However, α and β values of the Gaussian output are in atomic units (a.u.), so they have been converted into electronic units (esu) ) (α; 1 a.u. = 0.1482×10⁻²⁴ esu, β; 1 a.u. = 8.6393×10⁻³³ esu).
Table 4: Calculated thermodynamic parameters (at 298.15 K) for ((4-APH)(4-APH2)[AsO4]·H2O) with DFT method.
|
|
Gas |
Water |
|
Thermodynamic parameters |
values |
|
|
SCF energy E (u.a) |
-992.52725 |
-992.61229 |
|
Zero-point vibrational energy (kcal mol-1) |
179.74496 |
180.05624 |
|
Rotational constants (GHz) A B C |
0.23361 0.19277 0.12348 |
0.38219 0.10311 0.09282 |
|
Thermal energy (kcal mol-1) |
194.047 |
194.956 |
|
Specific heat at constant volume Cv (cal mol-1 K-1) |
82.765 |
82.949 |
|
Entropy S (cal mol-1 K-1) |
165.65 |
174.617 |
|
Dipole moment (Debye) |
10.168234 |
39.198551 |
Table 5: Molecular Docking Results of interaction energies in kcal/mol using iGEMDOCK.
|
Protein molecule |
Ligand molecule |
Total energy |
VDW |
H-bond |
Electronic |
AverConPair |
|
Alpha-synuclein (3q25) |
Aresnic |
-93.6683 |
-60.3684 |
-33.2999 |
0 |
26.15 |
|
MALTOSE |
-107.384 |
-55.243 |
-52.1406 |
0 |
26.3043 |
|
|
Rho-kinase (2f2u ) |
Aresnic |
-92.187 |
-66.9125 |
-25.2745 |
0 |
26.75 |
|
5-(1,4-DIAZEPAN-1-SULFONYL)ISOQUINOLINE (M77) |
-95.4741 |
-75.5128 |
-19.9613 |
0 |
28.2 |
Table 6: Ligand and proteins (6LU7, 6M0J, 6M2N and 7BTF) interactions: binding affinities, bonds, closest interacting residues and distance to closest interacting residues.
|
|
6LU7 |
6M0J |
6M2N |
7BTF |
|
Binding energy (kcal/mol) |
-3.1 |
-3.7 |
-4.1 |
-3.9 |
|
Hydrogen bonds (residues) |
5 (2 × Phe185, Gly179, Asn180, Cys85) |
2 (Ile410, Tyr380) |
3 (Thr26, 3WL401, His41) |
4 (Pro677, Glu350, 2×His347) |
|
Electrostatic interactions (residues) |
--- |
--- |
--- |
1 (Arg349) |
|
Hydrophobic interactions (residues) |
--- |
2 (Thr376, Lys378) |
3 (2 × 3WL401, Leu27) |
1 (Arg349) |
|
No. closest interacting residues |
6 |
4 |
4 |
4 |
|
Distance to closest interacting residues (Å) |
2.714 |
2.267 |
2.273 |
2.513 |
Table 7: Lipophilicity, druglikeness, medicinal chemistry and pharmacokinetics of the novel organic arsenate templated by 4-aminopyridine compound.
|
Entry |
(4-APH)(4-APH2)[AsO4]·H2O |
|
Lipophilicity and Druglikeness |
|
|
Consensus Log Po/w |
0.62 |
|
Bioavailability Score |
0.17 |
|
Medicinal Chemistry |
|
|
PAINS |
0 alert |
|
Leadlikeness |
0 alert |
|
Synthetic accessibility |
3.85 |
|
Pharmacokinetics |
|
|
Gastro-intestinal absorption |
Low |
|
BBB permeant |
No |
|
P-gp substrate |
Yes |
|
CYP1A2 inhibitor |
No |
|
CYP2C19 inhibitor |
No |
|
CYP2C9 inhibitor |
No |
|
CYP2D6 inhibitor |
No |
|
CYP3A4 inhibitor |
No |
|
Log Kp (skin permeation) |
-10.51 cm/s |
|
|
|

No competing interests reported.
- floatimage1.png
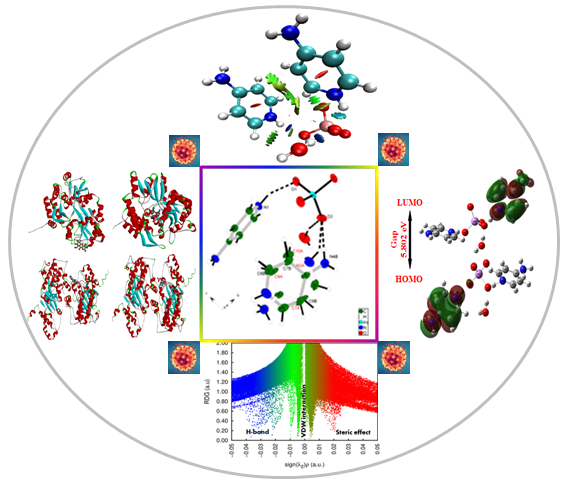
GRAPHICAL ABSTRACT
- supplementaryfiles.docx