The powder-XRD pattern of MIL-125, NH2-MIL-125, and HMF-2 is displayed in Fig. 1. The XRD pattern of as-synthesized MIL-125 and NH2-MIL-125 has good similarities with the previous reports confirming the crystallinity and the framework structure of MOFs [14, 15]. MIL-125 and NH2-MIL-125 show strong diffraction peaks at 6.8, 9.5, and 11.6° indexed as (011), (020), and (121) planes respectively. Integrated MOF HMF-2 showed characteristic peaks of both the MOFs, confirming the heterostructure formation without any accumulation of TiO2 over the framework. FE-SEM images presented in (Fig. $1) show the spherical morphology, whereas MIL-125 and NH2-MIL-125 also exhibit similar morphology to the previous literature [16]. The inset picture depicts the physical appearance of all three MOFs prepared.
Figure 2 discusses the FT-IR spectra of all Ti-MOFs prepared. MIL-125 shows strong absorption in the range 3200–3400 cm− 1 attributed to stretching vibration of a hydroxyl group (-OH) [17]. The band observed at 1620 cm− 1 is due to the bending vibration of N-H moieties in NH2-MIL-125. A strong band at 1530 cm− 1and 1433 cm− 1 can be assigned to vibrational stretching frequencies of the carboxylate group (-COOH). Furthermore, the peaks at 1384 cm− 1 correspond to the stretching vibration of C-N of aromatic amines and 1247 cm− 1 can be ascribed to the characteristic C-H stretching of the benzene ring. To be specific, the intense peaks at 623 cm− 1 and 760 cm− 1 were assigned for Ti-O-Ti [18]. HMF-2 follows a similar trend and carries all characteristic functional groups of contributing MOFs. It is imperative for MOFs to have a porous structure and high surface area for efficient removal of the effluents. Figure 3 represents the N2 adsorption-desorption isotherm of the synthesized MOFs. The corresponding BJH pore size distribution is presented in the inset of Fig. 3. All the MOFs exhibit type I(b) isotherm characteristics of the microporous material having a pore radius in the range of 1.8 to 2.05 nm [19]. The presence of a wider hysteresis loop of MIL-125 and NH2-MIL-125 is observed at 0.4 < p/p0 < 1.0 and 0.5 < p/p0 < 1.0 indicating the hysteresis loops of type H4 associated with the narrow silt pore shape filled with micropores according to IUPAC classification [19]. The unique nature of the microporous metal organic framework was potentially used in the field of gas separation [20]. Table 1 shows the BET surface area of MIL-125, NH2-MIL-125, and HMF-2 to be 986 m²/g,1267 m²/g, and 1102 m²/g respectively. The corresponding pore volumes are 0.061 cc/g, 0.143 cc/g, and 0.109 cc/g respectively. The porous nature of the MOFs implies the presence of more active sites which will facilitate the faster removal of Amox.
Table 1
Surface area and the BJH pore volume of the synthesized MOFs
| MOFs photocatalyst | surface area (m²/g) | pore volume (cc/g) |
| MIL-125 | 986 | 0.061 |
| NH2-MIL-125 | 1267 | 0.143 |
| HMF-2 | 1102 | 0.109 |
Figure 4 depicts the optical absorption spectra of the synthesized MOFs. The individual MOFs show good characteristic absorbance that matches with the reports [12, 21]. MIL-125 and NH2-MIL-125 show the absorption band edge around 350 nm and 490 nm respectively, whereas HMF-2 shows its absorption band edges around 470 nm standing in between the contributing MOFs. The bandgap energy (Eg) of the prepared MOFs was obtained from the tauc plot according to the Kubelka-Munk theory and calculated Eg values for MIL-125, NH2-MIL-125, and HMF-2 are found to be 3.5 eV, 2.4 eV, and 2.5 eV respectively. The integration of NH2-MIL-125 over MIL-125 extends the visible light absorbance of HMF-2 which may facilitate more efficient charge separation and enhanced photocatalytic degradation of Amox. Furthermore, the PL spectra (Fig. $2) of HMF-2 show lower PL intensity than both MIL-125 and NH2-MIL-125 which indicates the decreased rate of recombination, thereby increasing the photocatalytic activity compared to single component MOFs.
The surface composition of the sample HMF-2 analyzed by XPS is depicted in Fig. 5. XPS spectrum of Ti 2p shows two symmetrical Ti 2p1/2 and Ti 2p3/2 peaks at 466.5 eV and 460.8 eV respectively which is attributed to Ti4+ ion present in the MOF framework[22]. The energy difference between the Ti 2p1/2 and Ti 2p3/2 is 5.7 eV which implies the existence of O-Ti-O bonds in the HMF-2. The C1s show two deconvolution peaks at 285.7 eV and 289.3 eV corresponding to the -C-N and -C = O/-COOH group representing the presence of an organic linker [12, 23]. The presence of O1s shows two plausible contributions at 532.6 eV indicating a surface hydroxyl peak and another fitted peak at 530.8 eV for the formation of O-Ti-O in the framework structure [24]. Regarding nitrogen, N 1s spectra show two broad peaks mainly centred at 401.1 eV and 403.6 eV that are attributed to the -NH2 group [23].
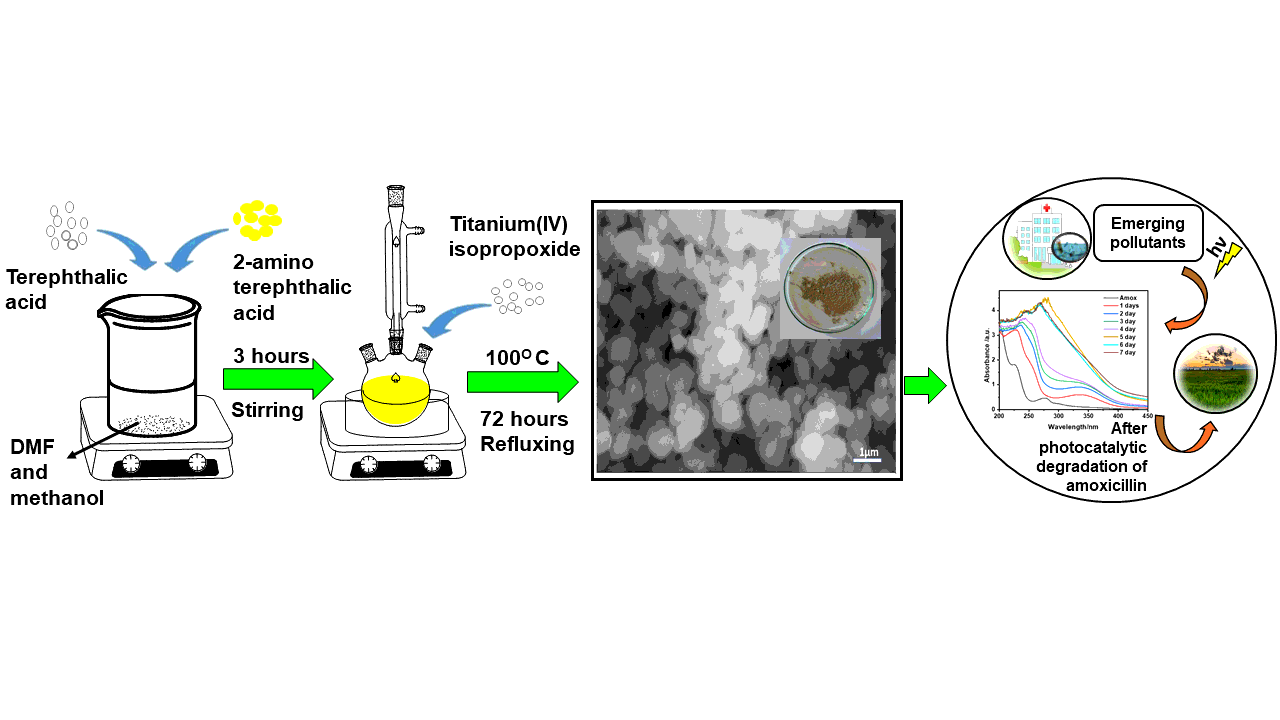
To compare the activity of prepared MOFs, Amox was chosen as a representative antibiotic for the degradation studies. 25 ppm of Amox solution was prepared from pharmaceutical wastewater at pH 7 and irradiated with visible light for a period of 1 to 7 days. Figure 6 represents the periodical degradation of Amox in the form of UV-visible spectra using the synthesized MOFs. Absorbance bands around 230 nm and 272 nm are used as a reference wavelength to compare the structural disintegration of Amox [6]. photocatalytic degradation of Amox with MIL-125 indicates that there is no significant degradation because of its bandgap of 3.5eV which restricts its visible light activity, whereas NH2-MIL-125 shows better degradation compared to MIL-125 because of its extended absorbance in the visible range. The photocatalytic degradation of Amox with HMF-2 also shows degradation in visible light, however, after the first-day the absorbance is red-shifted by 78 nm, indicating the degraded intermediate products formation. The superior activity of HMF-2 in comparison to MIL-125 and NH2- MIL-125 can be attributed to extended visible light absorption and more efficient charge separation on shining the visible light.