Cell Culture and differentiation
Mouse ESCs were cultured and differentiated as previously [22, 23]described. Briefly, murine CGR8 ESC from the European Collection of Cell Cultures (ECACC; No. 95011018) were used in this study. The cells were maintained on (0.2%) gelatinized tissue-culture dishes under feeder-free conditions in a standard ESC culture medium, consisting of Glasgow’s minimum essential medium (GMEM; Invitrogen), supplemented with 10% fetal bovine serum (FBS; GIBCO, Thermo Fisher Scientific,), 2 mM L-glutamine, 100 units/mL leukemia inhibitory factor (LIF-1; Calbiochem), and 50 µM β-mercaptoethanol (β-ME; Invitrogen), as described previously [22, 23].The cells were passaged on alternate days and maintained confluence between 60–70%. ESC differentiation was inducted by the conventional “hanging drop” protocol, as described previously [3]. Briefly, 20-µL hanging drops were made in 10-cm diameter low adhesion dishes from a trypsin-dissociated ESC suspension (2.5 × 10⁴ cells/mL), prepared in differentiation medium (Iscove’s modified Dulbecco’s Medium, IMDM; Life Technologies), supplemented with 20% fetal calf serum, 1% non-essential amino acids, 2 mM L-glutamine, and 100 µM β-ME. Plates were incubated at 37°C, under 5% CO2 in a humidified incubator for 2 days. EBs formed were harvested by washing and were resuspended in differentiation medium. The EBs were incubated at 37°C under 5% CO2 in an incubator under shaking conditions, with a medium change on alternate days.
Construction of Strip2 AM-tag plasmids and Chromatin Immunoprecipitation (ChIP) and ChIP-Sequencing Library Production
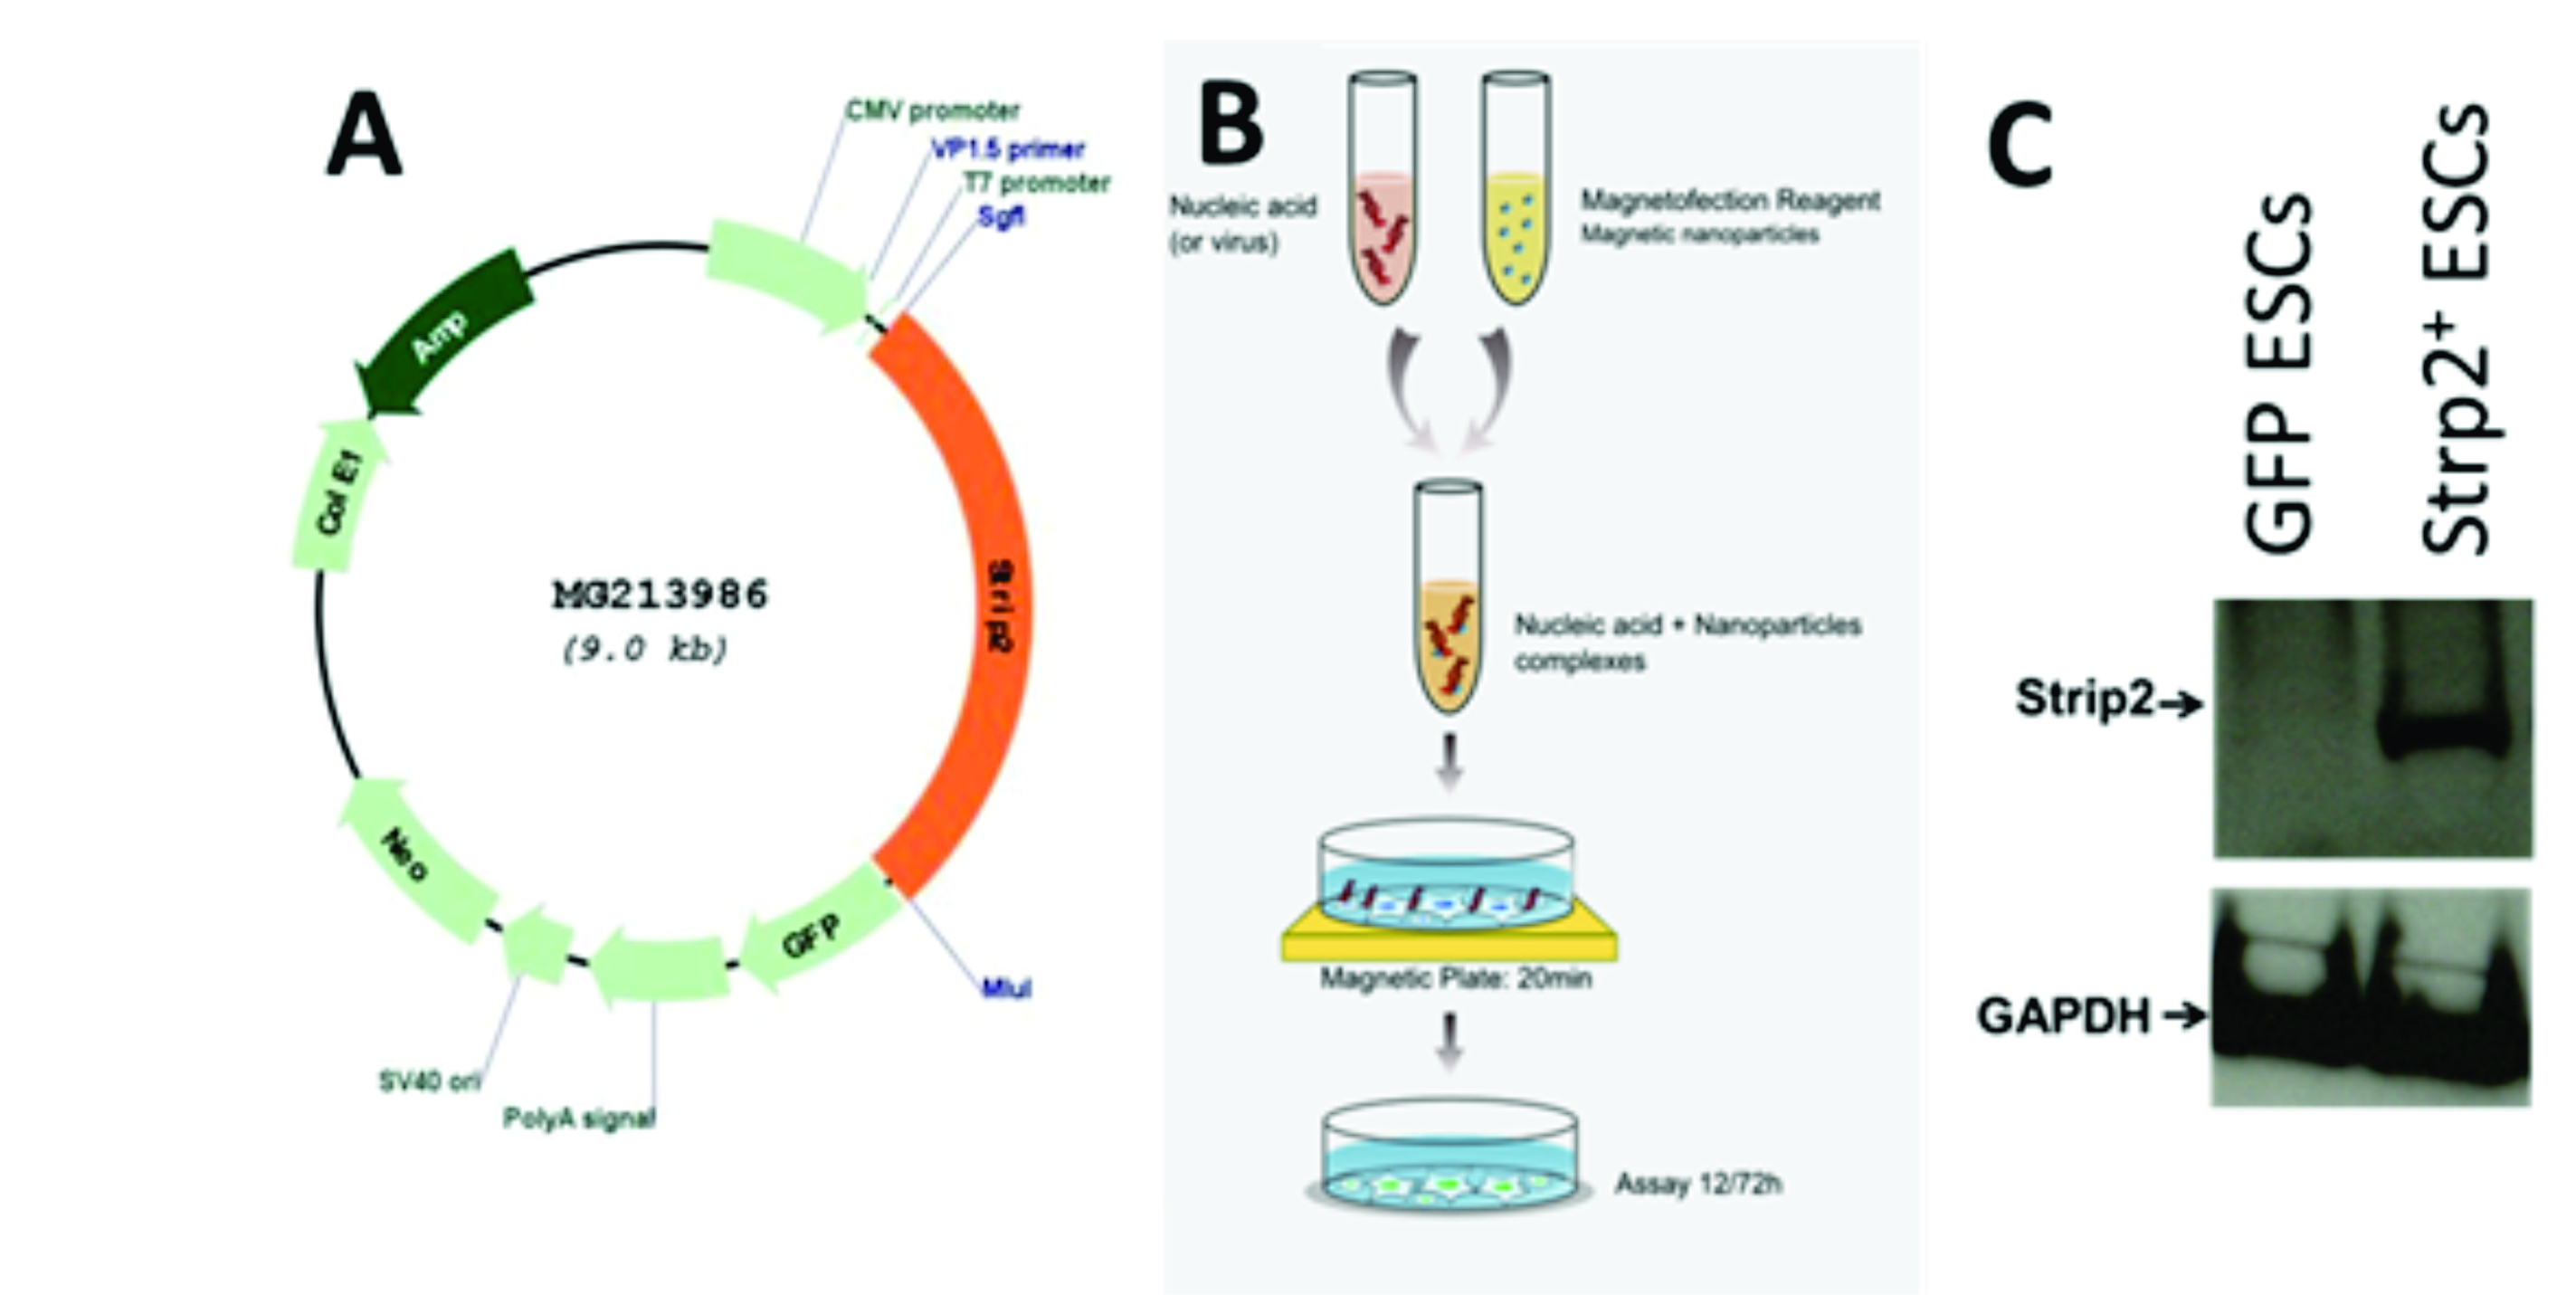
To generate the pAM-1C-Strip2 plasmid, the Strip2 gene was firstly amplified by PCR from (MG213986, pCMV6-AC-GFP vector, Origene) using the appropriate primers. The pAM-1C-empty vector was digested with BglII and HindIII and purified by gel extraction. Using homology directed ligation (Takara #638909) the Strip2 was then ligated into linearized pAM-1C vector. Positive clones of the ESCs overexpression Strip2 (referred as Strip2+-ESCs) were then confirmed by DNA sequencing analysis. The Strip2+-ESCs were transfected using the MagnetofectionTM transfection technology. The pAM-1C-JunD (overexpressing Vector was used as positive control and pAM-1C empty vector was used as negative control). Briefly, transfection cocktail contained 0.5µL plasmid cDNA (Strip2, JunD and empty Vector respectively) and 1.5 µL of magnetic transfection reagent (called MTX) diluted in 50 µL of serum free medium. This mixture was transferred to 0.5 µL CombiMag TM reagent and incubated at room temperature (RT) for 20 minutes (Supp Fig. 1). This solution was evenly applied on ESCs and MTX. Boost was added according to the manufacturer instructions. The selection of the appropriate clones was initiated immediately after 48 hours of transfection by treatment of the cells with 2 µg/ml neomycin to get purified stable transduced overexpressed clones. This process was carried out for 5 passages. The stable transduced cells were validated for Strip2 expression using qPCR. Expression of the eGFP was checked under blue excitation light by fluorescence microscope Axiovert 200 (Zeiss).
The ChIP-Seq analysis was carried out using the active motif protocol (53022). Briefly, cells were cross-linked with fixation solution for 10 min at four temperature (4oC). Chromatin was then sonicated for 10 cycles (30 sec on 30 sec off) using Bioruptor (Diagenode). Ten µg of AM-Tag antibody (pAb) (Active motif, 61677) was added to the sheared chromatin and incubated on end-to-end rotator overnight at 4°C. Next, 30 µl of protein G agarose beads were added to the ChIP reactions and incubated for three additional hours at 4°C. The chromatin was then decrosslinked at 55°C for 30 minutes and then the temperature was increased to 80°C for 2 hours with proteinase K (Active motif). ChIP-seq libraries from ChIP and input DNAs obtained from (Strip2, JunD and empty) were prepared according to Illumina protocol and sequenced with a 2 x 100–bp or 2 x 74-bp strand-specific protocol on a HiSeq 2500 sequencer (Illumina). ChIP-seq sequencing reads were mapped to the mouse genome (mm10 assembly) using BWA [24]. The resulting BAM files were then analysed with MACS2 [25] using Strip2: q ≤ 0.05; fold-enrichment ≥ 5; Broad Region Calling ON settings in order to identify genomic regions significantly enriched in the investigated proteins in comparison to the total genomic input DNA. For Strip2-AM tag Day 0 ChIP-seq, three biological replicates were performed, which showed high Pearson Correlation coefficients (0.98) as determined by the bam-Correlate tool from deep Tools (bins mode and a bin size of 10 Kb across the whole mouse genome). Motif analyses in active and poised enhancers was performed using the SeqPos motif tool (http://cistrome.dfci.harvard.edu/ap/root) [26] using a width of 600 bp and a p value cutoff of 0.001.
Additional bioinformatics analysis
Functionall annotation of Strip2 peaks (i.e., poised, PoiAct, active and primed) was performed with GREAT [27], using the Basal plus extension association rules (Proximal = five Kb upstream, one Kb downstream; Distal = 1000 kb) and the whole mouse genome as background. The top ten most overrepresented terms belonging to various gene annotations (GI Biological Process, GO Molecular Function and InterPro).
Luciferase Assay
Potential interactions of Strip2 with the consensus motif will be investigated using the luciferase assay. Briefly, Strip2 DNA binding domain motif (GGAGAGAAACCTTACAAATG) was purchased from Integrated DNA Technologies (IDT), and cloned after the SV40 promoter which controls the expression of luciferase in the pGL3 minimal promoter vector (Promega) and verified using Sanger sequencing. Luciferase assays will be performed in Strip2+-ESCs, Strip2−-ESCs and transient Strip2 overexpressing ESCs. For this aim 3 × 10⁴ cells per well were seeded into each well of a 96-well plate. 0.5 µg of each pGL3-based vector was transfected into different ESC cell lines using Lipofectamine 2000 and the medium was changed after overnight incubation. After 48 hrs, luciferase assays was conducted using the Dual-Glo (Promega) luciferase assay system and RLU values were determined using the renilla luminescence vector as an internal control for all assays. To calculate changes in luciferase activity driven by the presence of a motif or altered in Strip2−ESCs or in the Strip2 overexpressing ESCs, RLU values were normalized to values for the empty PGL3 vector without a motif.
Co- Immuno-precipitation of Strip2
To identify the interaction partners of Strip2 we have generated an ESC cell line permanently overexpressing Strip2 in undifferentiated WT ESCs. Briefly, generation of the Strip2-Turbo-GFP-fusion overexpressing WT ESCs (next referred transient Strip2 overexpressing ESCs ) as was performed by the MagnetofectionTM transfection technology using a plasmid with the cDNA cassette encoding for Strip2 and the DNA cassettes for GPF fusion construct and puromycin resistant cassette (Catalogue number: MG213986, pCMV6-AC-GFP, Origene) as before mentioned. In parallel a control ESC cell line has been generated using a control plasmid without the Strip2 cDNA but with the eGFP and neomycin cassette (next referred as GFP-F + ESCs). Transient Strip2 overexpressing ESCs were passaged for 5 days under standard cell culture conditions (37oC, 5% CO2). To identify only specific interactions of Strip2 to other proteins GFP-F + ESCs were used in parallel. Protein extraction and Immuno-precipitation was performed using the chromotek TurboGFP-Trap Agarose Kit (tbtak-20) according to the instruction of the kit. The cell extract was prepared using RIPA buffer. The cell lysate was mixed with TurboGFP-Trap-A beads and equilibrated for 1 hour at 4oC by end-over-end shaker. After incubation, the samples were washed three times, and then the specific Strip2 bound proteins were eluted using a buffer. The eluted proteins were further analyzed by mass spectrometry.
Transfection of Vectors into Undifferentiated ESCs and Generation of a Constitutive Strip2-Silenced ESC Line
The shRNA expression vector pGFP-V-RS, targeting mouse Strip2 (TR508344A plasmid) and the scrambled plasmid (TR30013) were purchased from OriGene. The shStrip2 target sequence on its mRNA was 5′ GCAAGACACTAAGGAATGGCTGGAGTTGG 3′, which corresponds to nucleotides 365–393. The scrambled plasmid (TR30013) contains a non-active scrambled sequence cassette (5′ GCACTACCAGAGCTAACTCAGATAGTACT3′). The pGFP-V-RS control, the shRNA vector (TR508344A plasmid), and the scramble shRNA vector (TR30013) were linearized. Generation of the cell lines was performed, as described previously. Briefly, 25 µg of linearized vector was transfected into 106 CGR8 cells, suspended in phosphate-buffered saline (PBS), free of Ca2+ and Mg2+ salts, using a Bio-Rad Gene Pulser Electroporation System (Bio-Rad). The electroporation conditions were 500 µF and 240 V, as described previously. The electroporated cells were cultivated on gelatinized tissue culture flasks for 2 days and eventually selected for treatment with 2 µg/mL puromycin. On day 10 of selection, green fluorescence was monitored under a blue excitation light through a fluorescence microscope. Afterward, the resistant clones were picked for further experiments and amplified following standard ESCs culture conditions. The clones were passaged at least four times before being used in experiments to attain a stable gene expression profile. The shStrip2 cell line generated with the TR508344A plasmid was used to study gene expression changes during differentiation of mESCs (ESCs, d4 and d16).
Histone H3 (K9) Methyltransferase Activity Assay
Nuclear extracts were prepared from undifferentiated Strip2−-ESCs, 4 day EBs differentiated and 16-day EBs as well as from the appropriate control Strip2+-ESCs and the 4-day and 16-day-EBs using Nuclear Extraction Kit (ab113473; Abcam, Cambridge, UK) by following the manufacturer’s protocols. The histone methyltransferase activity of the nuclear fractions of differentiating Strip2−-ESCs and differentiating Strip2+-ESCs has been determined using histone methyltransferase H3 (K9) activity quantification assay Kit (ab113453; Abcam) following the manufacturer’s protocols. Histone H3 acetylation was determined by a histone H3 acetylation assay kit (ab115102; Abcam). The absorbance at 450 nm was measured using a plate reader. Methyltransferase activity was calculated by the formula: activity [OD/h/mg] = (Sample OD – blank OD) / (protein amount [µg] × incubation hour). Histone acetylation activity was calculated by formula: [ng/mg protein] = (Sample OD – blank OD) / (Slope) X 1000.
SILAC labeling: Quantitative proteomics applying the „stable isotope labeling by/with amino acids in cell culture“(SILAC) methodology
We performed quantitative proteomics applying the „stable isotope labelling by/with amino acids in cell culture“(SILAC) methodology to identify proteins dysregulated in differentiated Strip2−-ESCs in comparison to differentiated Strip2+-ESCs. For this aim we cultured the Strip2+-ESCs, with SILAC DMEM containing Arginine and Lysine “heavy” and light isotopes of both amino acids and supplemented with GlutaMAX (1%, v/v). The “heavy” SILAC DMEM medium consisting of 50mg of 1-Arg-10 = L-[13C615N4] Arg. HCl, 25mg of 2-Lys-8 = l-[13C615N2]Lys.HCl and 100 mg proline in 500 ml DMEM medium. The composition of the “light” SILAC DMEM medium is similar but the heavy amino acids were replaced with the light (50mg/500ml 1-Arg-0 = l-[12C614N4]Arg.HCl, 25mg/500ml 2-Lys-0 = l-[12C614N2]Lys.HCl). The “heavy” and “light” medium incubated Strip2−-ESCs (heavy) and Strip2+-ESCs (light) have been cultured for 5 passages in undifferentiated state before generating the 4-day and 16-day-EBs, respectively. The SILAC mass spectroscopy from the isolated undifferentiated Strip2+-ESCs and Strip2−-ESCs as well as from the Strip2+-EBs and Strip2−-EBs was analyzed at CECAD/CMMC Proteomics Facility, University of Cologne, in collaboration with Dr. Christian Frese (http://www.cecad.uni-koeln.de/research/core-facilities/proteomics-facility/mass-spectrometers/).
All samples were analysed on a Q-Exactive Plus (Thermo Scientific) mass spectrometer that was coupled to an EASY nLC 1000 UPLC (Thermo Scientific) chromatograph. Peptides were loaded with solvent A (0.1% formic acid in water) onto an in-house packed analytical column (50 cm × 75 µm I.D., filled with 2.7 µm Poroshell EC120 C18, Agilent) and chromatographically separated at a constant flow rate of 250 nL/min using 60 or 150 min gradient of 5–30% solvent B (0.1% formic acid in 80% acetonitrile). The mass spectrometer was operated in data-dependent acquisition mode. The MS1 survey scan was acquired from 300–1750 m/z at a resolution of 70,000. The top 10 most abundant peptides were isolated within a 2 Da window and subjected to HCD fragmentation at normalized collision energy of 27%. Precursors were dynamically excluded for 20 sec.
SILAC Data analysis
Bioinformatics data analyses of all raw data from mass spectrometry were processed with Maxquant (version 1.5.3.8) using default parameters (ref pubmed 27809316). Briefly, MS2 spectra were searched against the Uniprot MOUSE.fasta database, including a list of common contaminants. False discovery rates on protein and PSM level were estimated by the target-decoy approach to 0.01% (Protein FDR) and 0.01% (PSM FDR) respectively. The minimal peptide length was set to 7 amino acids and carbamidomethyolation at cysteine residues was considered as a fixed modification. Oxidation (M) and Acetyl (Protein N-term) were included as variable modifications. For proteome quantification corresponding SILAC labels were selected. A minimum ratio count of 2 was required. For Co-IP data the match-between runs option and LFQ quantification was enabled. For SILAC data the re-quantify option was enabled. The Maxquant output was processed as follows: Protein groups flagged as „reverse“, „potential contaminant“ or „only identified by site“ were removed from the data set. Further analysis was carried out with metascape (Co-IP data) or R and metascape (SILAC data). For SILAC data, proteins with less than 4 valid values were filtered out. Protein SILAC ratios were log2 transformed and normalized to the median. For every time point a one sample t-test was performed. Proteins with a p value < 0.05 and log2 change <-1 or > 1 were considered significantly changing and subjected to profile clustering (k-mean cluster analysis), which were generated using the z-scored mean values per group. For Co-IP data, proteins with less than 2 valid values in at least one of the conditions were filtered out. LFQ values were log2 transformed. Missing values were replaced by imputation (width 0.3, down shift 1.9). A two sample t-test was used to determine significantly enriched proteins. Potential contaminants were annotated based on the Crapome repository [28].
Proximity Ligation Assay (PLA)
All PLA reagents were purchased from Duolink (Sigma-Aldrich, St. Louis, MO, USA). PLA was performed according to manufactures’ instructions. Briefly, differentiating cells from different time point (0-day, 1-day- and 4-day EBs) of Strip2−- and Strip2+ESCs were fixed with 4% paraformaldehyde, incubated with PBS containing 0.1% Triton X-100, and blocked with Blocking Solution for 60 min. Cells were incubated with primary antibodies (Trim28 and Strip2, ZFP57 and Strip2) at 4°C overnight. After washing the cells three times with PBS-T, cells were incubated with oligonucleotide-conjugated secondary antibodies (PLA Probes) PLUS and MINUS for 1 h at 37°C. Followed by washing with PBS-T and incubated with a ligation mixture (Detection Reagent Red) for 30 min at 37°C. Cells were washed and incubated with an amplification mixture (Detection Reagent Red) for 100 min at 37°C. After amplification, cells were washed and rinsed in distilled water. The nuclei were stained with DAPI. Images were captured with an inverted fluorescence microscope (Zeiss, Axiovert 200).
Statistical Analysis
If not otherwise indicated in the text, then analysis was performed using a one-way pairwise ANOVA test or t-test and p values < 0.05 were considered statistically significant.