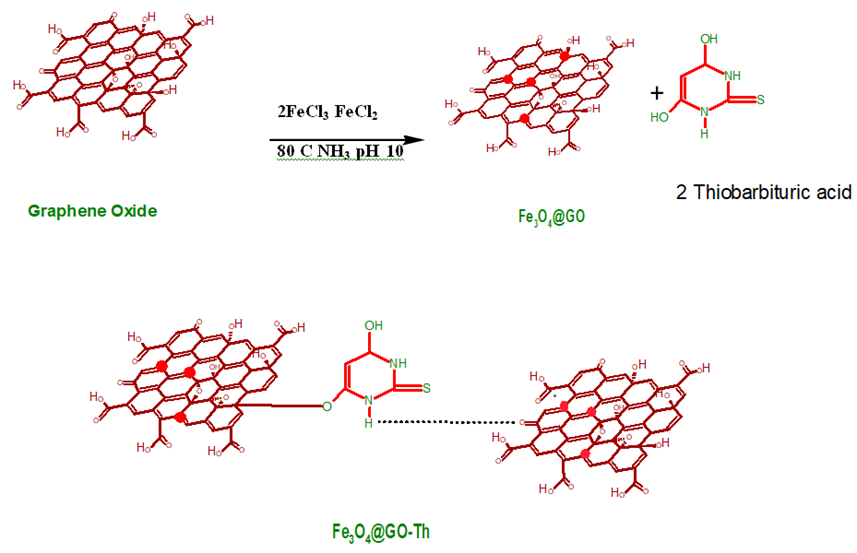
Characterizations
FT-IR
The sharp band obtained at 3392 cm− 1 can be attributed to the N − H stretching which overlaps with O-H vibrations, whereas the band at 1594 cm− 1 is corresponding to the N-H bending and C = C stretching vibrations Fig. 1 (Islam and Chauhan 2022). Moreover, the peak appeared around 1398 cm− 1 specified for the C-N stretching (Islam et al. 2020; Islam and Chauhan 2022). Additionally, the peak in the range of 1224 − 1116 cm− 1 are assigned for C-S, N-C = S, COC bond. The enwrapping of Fe3O4 nanoparticles was indicated by Fe-O band appeared at 590 cm− 1 (Nakamoto et al. 2009). All these facts supported the successful synthesis of Fe3O4@GO-Th binary composite. The Far IR spectrum (Fig. S1) witnessed the peaks obtained after sorption of Cd(II) with different ligand functionalities such as Cd-N, Cd-S, Cd-O were lies in the region 258 cm− 1, 508 cm− 1, 670–690 cm− 1, respectively (Nakamoto et al. 2009).
SEM-TEM-EDS
The surface morphological structure of the synthesized Fe3O4@GO-Th binary composite was investigated by SEM with EDS and TEM images of samples (Fig. 2A-C). The SEM reflected the disordered covering of a ligand onto wrinkled few layered sheets of GO that will result in a large surface area with high adsorption capacity. The TEM images showed the anchoring of the ligand 2-thiobarbituric acid and Fe3O4 particles onto the GO sheets. Moreover, EDS was performed to identify the presence of C, O, N, Fe, and S in Fe3O4@GO-Th. The appearance of S and N is attributed to the successful functionalization of GO with a ligand 2-thiobarbituric acid. The Fe signal could indicate the successful enwrapping of Fe3O4 nanoparticles that are responsible for contributing magnetic property.
XRD
The characteristic peak of the synthesized composite appeared at 2θ 15.3o with an amorphous phase signified the successful synthesis of Fe3O4@GO-Th binary composite. Moreover, the peaks for Fe3O4 nanoparticles, a cubic spinel, were appeared at 2θ 30.2, 35.5, 42.7, 53.8, 57.3, 62.8 which are almost similar with the existing pattern (JCPDS Card 019–0629) shown in Fig. S2A.
TGA
The one of the evidence for the successful coupling of a ligand onto GO surface to form a binary composite came from TGA spectrum Fig. S2 B. The compound is thermally stable and showed a slight weight loss at a temperature around 28.52–74.85 oC due to physisorbed residual solvents and water molecules from Fe3O4@GO-Th. The next stage decomposition occurred around 527.92-562.62 which is attributed to the loss of weak linkages of GO and ligand may also due to the rupture of carbon skeleton of the binary composite. Furthermore, the disruption of existing thermally stable groups including magnetic nanoparticles was obtained around 590.32-696.04. After wards, no degradation was observed. This implies that Fe3O4@GO-Th has the ability to resist a high temperature, indicating the thermal stability under strong conditions, which allowed them to serve as potential sorbent in broader application temperature ranges.
Moreover, composite has a high t-Plot external surface area of 93.90 m2 g− 1with the desorption total pore volume of 0.058678 cm³ g− 1.
Raman
The Raman is the non-destructive technique for characterizing the carbon products. To identify the defects, a disordered structure of GO exhibited two peaks in Fig. 3A, one is corresponding to graphitic peak at 1592 cm− 1 with sp2 carbon domain and another is distorted peak at 1350.5 cm− 1 (Gao et al. 2012) with partially distorted structure of sp2 domain. In contrast, the Fe3O4@GO-Th nanocomposite show some shifting in both peaks i.e. distorted appeared at 1338 cm− 1 and while graphitic peak appeared at 1597.8 cm− 1 and another extra peak appeared between 696.5-789.06 cm− 1 is characterized for successful coupling of a ligand 2-thiobarbituric acid with GO resulting a binary composite (Fig. 3B).
Optimization Of Experimental Parameters
The pH value of the solution has significant influence on the overall performance by protonation and deprotonation of the active sites of the Fe3O4@GO-Th. Therefore, the effect of pH on different metal ions (Cd(II), Pb(II), Co(II), Ni(II), Cu(II), and Zn(II)) sorption was studied under different pH ranges (1.6-8.0) as described in Fig. S3. Metals were not study above pH 8 as they undergo co-precipitation or hydroxide formation (Islam et al. 2020). It is worth mentioning that among studied metal ions Cd(II) showed maximum adsorption capacity. However, at high acidic value the adsorption capacity for Cd(II) was very less, because of the competition between metal cations and hydronium ions. When the pH was enhanced, the surface charge of Fe3O4@GO-Th becomes negative, resulting to the decrease in the competing effect of H+ ions, which prompted an increase in the sorption of metal ions onto sorbent and thereby obtain maximum capacity at pH 5.6. Therefore, pH 5.6 was optimized for further studies. The point of zero charge (pHpzc) study was conducted to understand the surface chemistry of Fe3O4@GO-Th for Cd(II) sorption (Islam and Chauhan 2022). If pH is above pHpzc, the surface is negatively charged and tends to bind with positively charged moieties, whereas those with pH lower than pHpzc, the surface is positively charged and could adsorb negative species. In this study, Fe3O4@GO-Th had a pHpzc of 3.5 which inferred the surface to be negatively charged. Contact time is one the influential adsorption parameters, as the initial rate of adsorption was appreciable fast and attained more than 50% sorption within 4 min, then gradually slows down and does not show any further increment in the capacity after 12 min (Fig. S4A). The 12 min was appreciable for an analyte to achieve accessibility towards the active functionalities in order to attain the saturation level. The effect of initial concentration was evaluated under different concentrations which ranged from 10-1100 µg mL− 1 at a fixed pH and time, the rise in the sorption capacity for Cd(II) was seen with the increase in concentration. However, the increment is very slow after 900 µg mL− 1, which could be attributed to the fact that, initially, all sites were freely available for binding with active sites of Fe3O4@GO-Th and then gradually the binding sites gets saturated resulting to the slower rate and then no further increment in capacity was seen.
Kinetics Studies
The kinetics experimental data was fitted in pseudo first order, and pseudo second order to know the adsorption mechanism. The equations and kinetic parameters are given in Table S1and Fig. S4 B-C which indicated that pseudo second order as the best fit with higher R2 value and also witnessed good agreement between the calculated and experimental capacity, predicting a chemisorption process.
Isotherms Studies
To understand the relationship of equilibrium concentration of metal ion in the bulk and amount adsorbed at the surface, isotherm modelling was performed. In the present study four isotherm models (Table S2 A) including Langmuir, Freundlich, Jovanovik, and Sips were tested under three different temperatures 293 k, 303 k, 313 k to describe the sorption isotherms as shown in Fig. 4 (A-C). Based on maximum R2 value and minimum error analysis the best isotherm model for non-linear analysis was evaluated (Foo and Hameed 2010) as presented Table 1. The six studied error analysis (Table S2 B) includes reduced chi-square (χ2), residual root mean square error (RMSE), sum of the absolute errors (EABSs), composite functional error (Hybrid), average relative error (ARE), and Marquardt’s percent standard deviation (MPSD). The Freundlich model describes the best fit. Additionally, the Sips model incorporated the feature of Langmuir and Freundlich which is described based on ms value, if this value is close to unity then it supports Langmuir else Freundlich if the value is close to zero. Herein, the value is approaches to zero hence supported the Freundlich model. These facts attributed that the surface of Fe3O4@GO-Th exhibits heterogeneity with varied affinity. The different types of interactions may involve electrostatic or coordinate-interactions which results in heterogeneous surfaces of the sorbent.
Table 1
Isotherm modeling parameters for adsorption of Cd(II) onto Fe3O4@GO-Th
| Models | Parameters 293K | 303K | 313 K |
| Langmuir \({\text{Q}}_{\text{e}}= \frac{{\text{Q}}_{\text{m}\text{L} }{\text{K}}_{\text{L}}{\text{C}}_{\text{e}}}{1+{\text{K}}_{\text{L}}{\text{C}}_{\text{e}}}\) | KL (L mg− 1) \({\text{Q}}_{\text{m}\text{L} }\)(mg g− 1 ) RMSE Reduced χ2 ARE MPSD EABS HYBRID R2 | 0.004 104.09 6.67 44.59 8.95 27.35 7.94 95.65 0.953 | 0.005 109.22 7.28 53.08 9.37 30.18 11.78 178.40 0.938 | 0.01 110.45 9.73 94.72 9.24 31.95 14.10 248.14 0.916 |
| Freundlich \({\text{Q}}_{\text{e}}= {K}_{F}{C}_{e}^{\frac{1}{{n}_{F}}}\) | KF(mg g− 1)(L mg− 1/n) nF RMSE Reduced χ2 ARE MPSD EABS HYBRID R2 | 4.71 2.32 3.19 10.19 1.74 10.00 0.30 16.76 0.987 | 7.46 2.68 2.74 7.50 0.80 5.54 0.26 12.87 0.991 | 13.00 3.27 3.72 13.88 1.16 7.77 0.40 23.47 0.985 |
| Jovanovic \({Q}_{e}= {Q}_{mJV} \{1-\text{exp}\left(-{K}_{JV}{C}_{e}\right)\}\) | QmJV KJV RMSE Reduced χ2 ARE MPSD EABS HYBRID R2 | 85.06 0.003 8.34 69.55 12.44 34.17 13.29 155.81 0.927 | 92.5 0.004 9.26 85.83 12.58 36.05 18.95 276.16 0.915 | 98.28 0.006 12.82 164.37 12.21 38.13 22.76 394.28 0.854 |
| Sips \({Q}_{e}= \frac{{K}_{s}{C}_{e}^{{m}_{s}}}{1+{\alpha }_{s}{C}_{e}^{{m}_{s}}}\) | ms (J mol− 1) Ks RMSE Reduced χ2 ARE MPSD EABS HYBRID R2 | 0.42 4.71 3.56 12.74 1.74 11.18 0.3 16.75 0.984 | 0.37 7.46 2.74 9.009 0.80 6.07 0.26 12.87 0.989 | 0.30 13.00 3.72 16.67 1.16 8.51 0.40 23.48 0.982 |
| All abbreviation are given in Table S2A, and S2B |
Adsorption Thermodynamics
The thermodynamic adsorption behaviour of Cd(II) onto the surface of Fe3O4@GO-Th was studied as reported earlier (Islam and Chauhan 2022). Furthermore, different thermodynamic parameters including Gibbs free energy (∆G), enthalpy change (∆H) and entropy change (∆S) were elucidated (Islam and Chauhan 2022) to evaluate the feasibility and spontaneity of the sorption as given in Table S3. The negative value of ΔG inferred that the adsorption of Cd(II) onto Fe3O4@GO-Th was found to be feasible and spontaneous at all studied temperatures and the values lied in the range of -7.80 to -9.28 kJ mol− 1. Moreover, the positive ∆H suggested the adsorption process to be endothermic in nature. Hence, increase in temperature increases the rate of adsorption as predicted by isotherm. The ∆S with positive value witnessed the increase in disorderness/randomness on the solid-solution interface.
Selectivity Studies
The selectivity study was performed to checked the selective removal of Cd(II) in the presence of interfering ions such as Ni(II), Cu(II), Zn(II), and Pb(II) as given in Fig. 5. The results predicted that for equal ratio of analyte and interfering ions, the Cd(II) showed higher % removal as well as preferential affinity to the active binding sites. On increasing the concentration of interfering ions, the % removal efficiency of interfering ions found to increase to a certain extent, as Zn (II) showed co-sorption with Cd(II) and interfere to some extent but does not influence the overall % removal of Cd(II). It is also important to note that Cd(II) is a soft Lewis acid while Ni(II), Cu(II), Zn(II), and Pb(II) are borderline [Pearson 1963; Pearson 1988] and also Fe3O4@GO-Th possesses S as a soft Lewis base which follow the HSAB principle of binding. Hence, the Fe3O4@GO-Th showed selective removal of Cd(II) even in the presence of concomitant ions.
Regeneration And Desorption
Regeneration is a significant parameter to check economic efficiency and practical utility of the sorbent. In order to regenerate the Fe3O4@GO-Th, different types of eluting agents of 1M concentrations each including HCl, HNO3, CH3COOH, NH3 were selected for the desorption of Cd(II). The obtained results revealed that 1 M of HCl provide maximum desorption under optimum conditions. Therefore, 1M HCl was chosen as eluting agent as it will not disrupt the structure of Fe3O4@GO-Th. As a result it can be reused up to 4 cycles after adsorption-desorption process with no significant loss % in the adsorption efficiency after 4 cycles. Thus it shows high stability of sorbent and property.
Application To Real Samples
The practical utility of the synthesized binary composite Fe3O4@GO-Th was investigated for the removal of Cd(II) from various industrial wastewater samples. The Cd(II) showed > 96% removal in the real samples including electroplating wastewater, battery wastewater, tannery wastewater, and Ganga river water as shown in Table 2. Thus, it can be inferred that the synthesized binary composite is good for wide range of practical applications.
Table 2
The results of % Removal of Cd(II) from various environmental water samples
| Samples | Before sorption (µg L−−1) | After sorption (µg L−−1) | % Removal |
| Battery wastewater | 7.32 ˟102 | 8.04 | 98.90 |
| Tannery wastewater | 7.74 ˟102 | 22.1 | 97.14 |
| Electroplating wastewater Ganga river water | 11.5 6.14 | aND 0.19 | 100.0 96.84 |
| Tap water | 3.76 ˟102 | aND | 100.0 |
| a Not detected (not detected is assume to calculate % removal) |
Comparison Of Feo@go-th With Other Sorbents
The Cd(II) is considered as hazardous substance and showed adverse impact on environment and human health. Therefore, the removal of Cd(II) is necessary from environment. The adsorption capacity of Fe3O4@GO-Th for Cd(II) was compared with the other adsorbents and found that the presently synthesized sorbent demonstrated remarkable adsorption capacity, exhibits fast adsorption kinetics ease of separation, promoted competitiveness, cost-effectiveness, and has excellent affinity for Cd(II) in wastewater samples Table 3.
Table 3
Summary of Previously Reported Solid-Phase-Extraction Studies for Cd(II) removal
| Adsorbents | pH | Time (min) | Adsorption capacity (mg g− 1) | References |
| Fe3O4@GO-Th Cd(II)-GMA | 5.6 5.6 | 12 15 | 95.54 34.84 | This work (Islam and Chauhan 2022) |
| LDH@GO-SH | 6 | - | 102.77 | (Liao et al. 2021) |
| LDH-GO@Fe(II) GMA-DVB-DETA-GO GO@As GO-Ch GO-nanosheets | 6 8 7.5 6 4 | 24 h 30 60–180 60 120 | 28.98 38.78 121.95 107.8 44.64 | (Liao et al. 2019) (Islam and Kumar 2016) (Moghaddam et al. 2019) (Azizkhani et al. 2018) (Xue et al. 2015) |
| Cd(II)-AAAPTS | 5 | 5 | 24.7 | (Ghanei-Motlagh and Taher 2017) |
| Cd(II)-DMIIP | 6 | 30 | 41.69 | (Xie et al. 2020) |
| Cd(II)-carboxymethyl chitosan Cd(II)- SOS silica Cd (II)- Methacrylic acid Cd(II)-AECS | 5 6 6 6 | 10 - 30 60 | 20.7 41.21 62.9 26.1 | (Lü et al. 2013) (Yang et al. 2020) (Jagirani et al. 2020) (Wang et al. 2019) |