Research Material
The lncRNA expression profile of IPEC-J2 was compared between the IPEC-J2 infected with TGEV (n = 2) and Mock group (n = 2). To identify lncRNAs expressed in TGEV infected IPEC-J2, cDNA libraries were constructed and sequenced on the HiSeq 2500 Illumina platform (Illumina, San Diego, CA, USA).
Strand-specific library construction and sequencing
IPEC-J2 cells were infected with TGEV at 1 MOI for 24 h (indicated by T1 and T2). Meanwhile, the mock infection (indicated by M1 and M2) was carried out. Total RNA was extracted with Trizol reagent (Invitrogen, Carlsbad, CA, US). After total RNA was extracted, ribosomal RNAs (rRNAs) were removed to retain mRNAs and ncRNAs. Following the purification, the enriched mRNAs and ncRNAs were iron-fragmented at 95℃. Then, reverse transcriptase and random primers were used to generate the first strand cDNA from the cleaved RNA fragments. The second strand DNA was amplified by PCR, QiaQuick PCR extraction kit was used to purify the cDNA fragments, then these fragments were end repaired, poly(A) added, and ligated to Illumina sequencing adapters. The second-strand cDNA was digested by Uracil-N-Glycosylase (UNG), the products were size selected by PCR amplified, agarose gel electrophoresis, and sequenced using Illumina HiSeqTM 2500 system (Illumina, USA).
Alignment with reference genome
Reads containing adapters, low quality reads, and rRNA reads were removed. The remaining reads of each sample were then mapped to Sus Scrofa reference genome (Sus Scrofa 10.2) by TopHat2 (version 2.0.3.12), respectively.
Transcripts reconstruction
Cufflinks (V2.2.1), which preferring to the program reference annotation-based transcripts (RABT), was used to reconstruct the transcripts. The influence of low coverage sequencing was fixed through Cufflinks constructing faux reads based on reference. During the end of assembly, similar fragments were removed from all of the reassembled fragments by aligning with reference genes. Then we used Cuffmerge to merge transcripts from different replicates of a group into a comprehensive set of transcripts, and then the transcripts from multiple groups were merged into a finally comprehensive set of transcripts.
Identification and annotations for novel transcripts
To identify the novel transcripts, all of the reconstructed transcripts were aligned with reference genome and divided into twelve categories using Cuffcompare (V2.2.1). We used the following parameters to identify reliable novel transcripts: the length of transcript was longer than 200 bp and the exon number was more than 2.
Classification, Characterization, and Validation of lncRNAs
Two softwares Coding-Non-Coding Index (CNCI) (https://github.com/www-bioinfo-org/CNCI) [42] and Coding Potential Calculator (CPC) ( http://cpc.cbi.pku.edu.cn/) [43] were used to assess the protein-coding potential of new transcripts by default parameters. The intersection of both results were chosen as long non-coding RNAs.
Quantification of lncRNA abundance
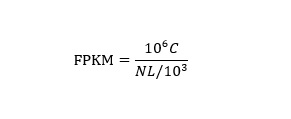
LncRNA abundance was quantified by RSEM (V1.2.8) and normalized to Fragments Per Kilobase of transcript per Million mapped reads (FPKM). The formula is shown as follow (see Formula 1 in Supplementary Files).
C, the number of fragments that are mapped to transcripts; N, the total number of fragments that are mapped to reference genes; L, the number of base pairs of transcript.
Significance analysis of lncRNAs
The edgeR package (http://www.r-project.org/) was used to identify differentially expressed lncRNAs. A fold change ≥2 and ≤ 0.5, plus a false discovery rate (FDR) <0.05, were identified as significant differentially expressed lncRNAs.
miRNA precursor Prediction
LncRNAs can be spliced into multiple small RNAs which function as post-transcriptional regulators. To find potential miRNA precursors, lncRNAs were aligned to miRBase (version 21). Those with identity more than 90% were selected.
LncRNA-miRNA interaction
Based on the sequences of lncRNAs, three softwares RNAhybrid (v2.1.2) + svm_light (v6.01), Miranda (v3.3a) and TargetScan (Version:7.0) were used to the candidate target genes. The interaction networks among lncRNA and miRNA were built and visualized using Cytoscape (v3.5.1) (http://www.cytoscape.org/).
LncRNA cis-regulation Analysis
One of the functions of lncRNAs is cis-regulation of their neighboring genes on the same allele. The up-stream lncRNAs which have intersection of promoter or other cis-elements may regulate gene expression in transcriptional or post-transcriptional level. The downstream or 3’UTR region lncRNAs may have other regulatory functions. LncRNAs, which are classified as located in an “unknown region” in Cuffcompare (V2.2.1) were annotated as up-or downstream of a gene. LncRNAs in up/down stream of a gene were likely to be cis-regulators. The interaction networks among lncRNA and up-or downstream genes were built and visualized using Cytoscape (v3.5.1) (http://www.cytoscape.org/).
Antisense lncRNA Analysis
In order to reveal the interaction between antisense lncRNA and mRNA, the software RNAplex [44] (http://www.tbi.univie.ac.at/RNA/RNAplex.1.html ) was used to predict the complementary correlation of antisense lncRNA and mRNA.
GO and KEGG analysis of differentially expressed lncRNAs
GO database (http://www.geneontology.org/) and KEGG database (http://www.genome.jp/kegg/) were used to annotate the pathways. The calculating formula is the same as the previous study [16].The interaction networks among lncRNAs, miRNAs, mRNAs or proteins were built and visualized using Cytoscape (v3.5.1) (http://www.cytoscape.org/).
Quantification of lncRNAs, miRNAs, and mRNAs using qRT-PCR
According to the manufacturer′s instructions, TRIzol reagent was used to extract the total RNA of IPEC-J2 cells, then reverse transcription was carried out using M-MLV reverse transcriptase (Invitrogen, US). qRT-PCR was performed on iQ5 qRT-PCR System (Bio-Rad, US). The primers are shown in additional file 10:Table S10.
Western blot analysis
RIPA lysis buffer containing phenylmethylsulfonyl fluoride (PMSF) was used to treat samples to extract the protein, then using BCA Protein Assay Reagent (Pierce, US) to measure the protein concentration. Proteins were separated on sodium dodecyl sulfate-polyacrylamide gel electrophoresis (SDS-PAGE) and transferred onto polyvinylidene difluoride (PVDF) membranes (Millipore, US) subsequently. Block the PVDF membrane with 5% non-fat milk for 2 h at room temperature and then incubate the PVDF membrane with Phospho-NF-κB p65 (p-p65) Rabbit monoclonal antibody (CST, US) overnight at 4℃ and Horseradish peroxidase (HRP)-conjugated secondary antibody (Pierce, US ) at room temperature for 1 h subsequently. In the last step, the membrane was developed with enhanced chemiluminescence (ECL) (Promega, US).
Statistical analysis
SPSS 16.0 was used for statistical analysis. The data are presented as the means ± SEM. Statistical significance was analyzed by unpaired Student′s t-test. p < 0.05 was defined as statistical significance.