Identification of prognostic inflammation-related genes
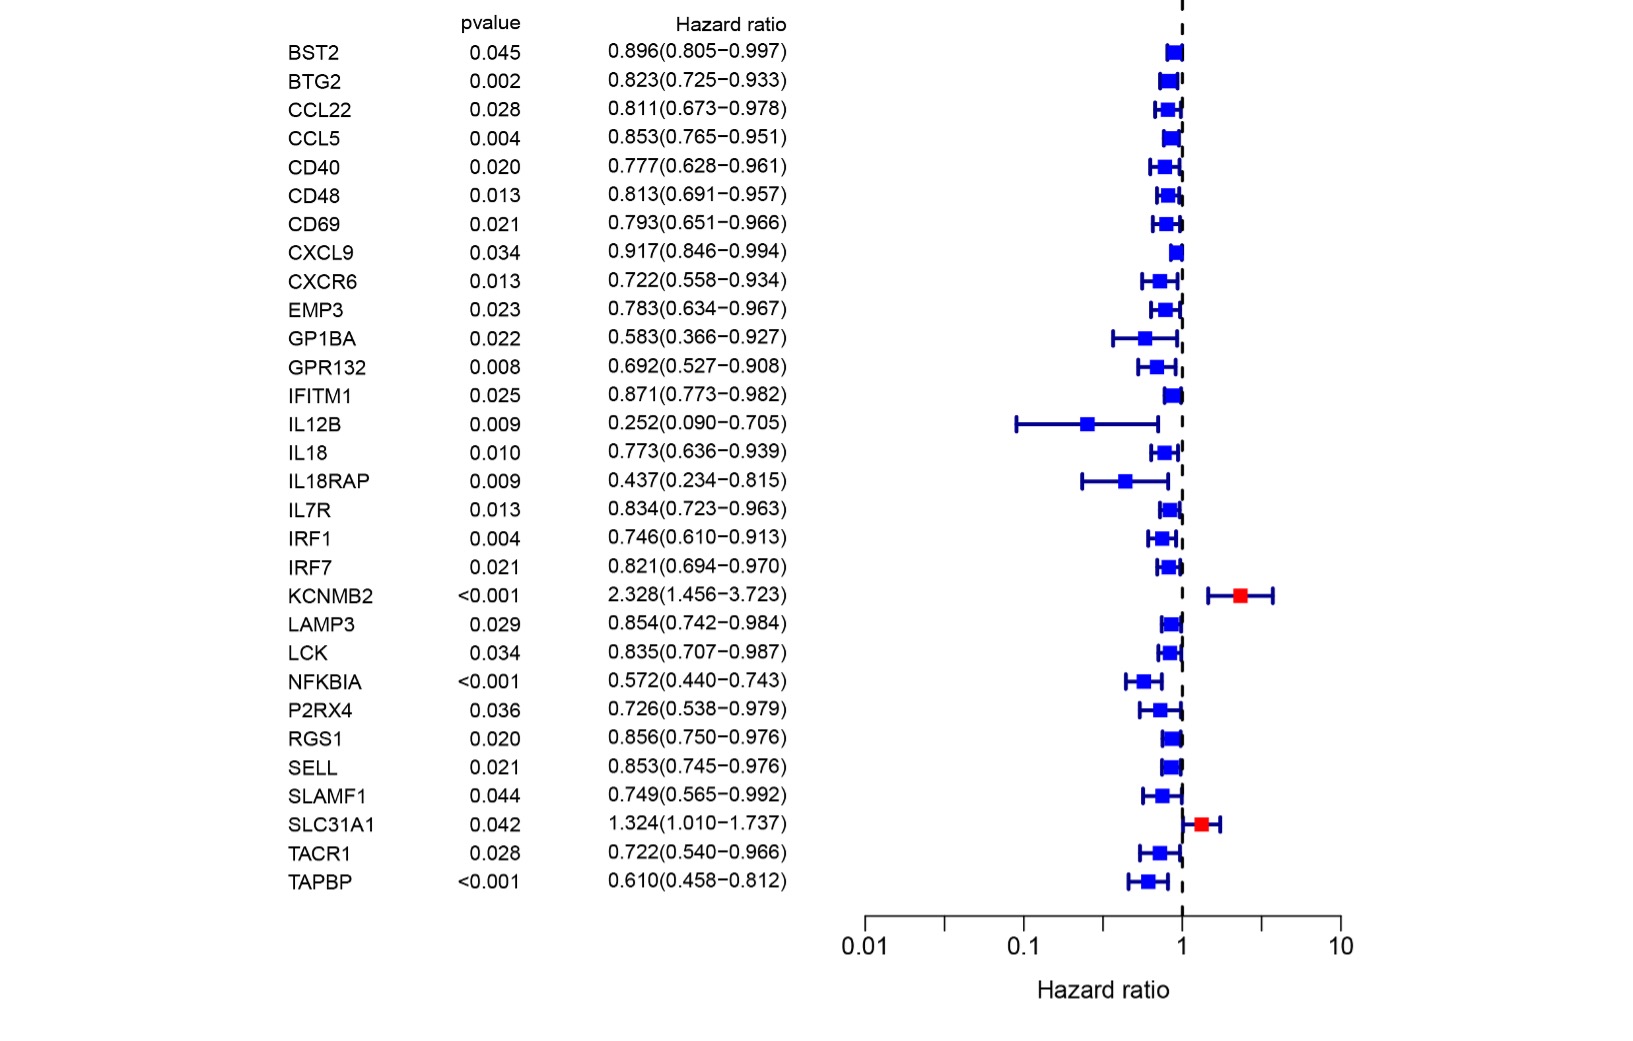
To construct a prognosis prediction model in breast cancer, we downloaded the human inflammatory response gene set from the GSEA database, which included 200 inflammation-related genes (IRGs), and then further analyzed it. The expression levels of these inflammatory genes in breast cancer tissues and para-cancerous tissues were obtained from the TCGA database, and screened out 56 differentially expressed inflammatory genes (DEGs). A univariate Cox analysis of all the IRGs showed that 30 IRGs were related to overall survival with p<0.05 in the TCGA cohort (Fig S1). Then, a total of 11 differently expressed inflammation-related genes were identified by intersecting with the 56 DEGs and 30 inflammation-related genes which were shown in the Venn diagram (Fig 1A). The expression of 9 up-regulated genes (TACR1, IRF7, BST2, IFITM1, LAMP3, SELL, CXCL9, IL12B, IL12B, GPR132, IL18) and 2 downregulated genes (KCNMB2, TACR1) in breast cancer were visualized using a heatmap (Fig 1B). A univariate Cox regression analysis revealed that the genes correlated with breast cancer, including 10 risk genes (Hazard ratio > 1) and one protection gene (Hazard ratio < 1) (Fig 1C). Nearly all of the prognostic signature genes were positively correlated and the correlation among these genes is displayed in Fig 1D.
Construction and validation of a prognostic model in breast cancer
To investigate the relationship between IRGs and prognosis in breast cancer patients, we constructed a prognostic risk prediction model based on the above-mentioned 11 univariate results through the LASSO algorithm analysis. And the 10-fold cross-validation was used to determine the optimal values of tuning parameter, and the results supported that the 7 IRGs were the most robust markers (Fig 2A). These LASSP coefficients were shown in Figure 2B and there were no zero coefficients in it (Fig 2B). Seven IRGs, including GPR132, IFITM1, IL12B, IL18, IRF7, KCNMB2, and TACR1, were obtained to construct a nomogram to predict the 1-year, 2-year, and 3-year survival of breast cancer patients (Fig 2C). The total score was obtained by accumulating the scores of each gene and the vertical lines were drawn downward at the corresponding point of the total score to determine the relative survival rates of 1-year, 2-year, and 3-year. According to the median risk score, patients were divided into low-and high-risk groups. We performed the Kaplan-Meier analysis and ROC analysis to predict the power of the IRGs’ signature and compare the difference between the two groups. The KM curves showed a significant difference between the two groups and demonstrated that the patients with higher risk scores tended to have poorer prognosis and survival (Fig 2D). Moreover, the area under the curve of ROC curves (AUCs) at 1, 2, and 3 years were 0.640, 0.604, and 0.628, respectively (Fig 2E). The results indicated the good sensitivity and specificity of the prognostic model.
Further Validation of the IRGs Risk Prediction Model.
To further assess the stratification capability of the IRGs risk prediction model which was constructed based on the TCGA cohort, we divided breast cancers into high- and low-risk groups according to the median risk score. Then we plotted the distribution map of patient survival status and risk score (Fig 3A). The distribution plot of risk scores showed more death in the high-risk group. And survival status of patients showed an obvious better prognosis in the low-risk group in the scatter plot. The principal component analysis (PCA) and t-distributed stochastic neighbor embedding (t-SNE) were utilized to confirm the reliable clustering ability of the risk score. The plots showed that breast cancer patients of different risk groups were distributed in two directions, indicating that the expression of 7 genes in the model can effectively classify breast cancer patients into high- and low-risk groups (Fig 3B). The univariate and multivariate Cox proportional hazard regression analysis was performed to further explore the independent prognostic value of the inflammation-related gene prognostic risk model. Univariate analysis indicated that age (p < 0.001) and pathological (stage) (p < 0.001) were significantly correlated with the overall survival. And the further multivariate analysis showed that age (p < 0.001), pathological (stage) (p < 0.001) and lymph node status (N) (p < 0.001) were significantly correlated with the overall survival (Fig 3C, D). The hazard ratio (HR) of risk score and 95% CI were 2.783 and 1.737-4.457 in univariate Cox regression analysis (P<0.01), and 3.129 and 2.065-4.741 in multivariate Cox regression analysis (P<0.01), which suggested that the risk score of the model was a powerful independent predictor of the prognosis in breast cancer patients.
Evaluation of tumor microenvironment based on IRGs
To clarify the correlation between the risk score and immune status, the single sample gene set enrichment analysis (ssGSEA) was used to quantify 16 immune cell subsets and 13 immune-related functions. In the TCGA cohort, the results showed that the immune cell infiltration status was generally high in the low-risk groups, and the immune-related pathway was also upregulated in the low-risk groups (Fig 4A, B). From the results, we can conclude that the immune response is more active in the low-risk group than in the high-risk group, and the poor prognostic of breast cancer patients in the high-risk group may be correlated with negative immune regulation. According to the distribution of immunophenotyping of different types of tumor samples in the TCGA database, the levels of risk scores in 5 immune typed were displayed through the one-way ANOVA analysis (Fig 4C). Then we further researched the intrinsic function of IRGs and their related signal transduction pathway through GSEA, the results demonstrated that the pathways were differentially enriched between low- and high-risk groups (Fig 4D). Immune status and stroma cells played an important role in the tumor microenvironment, to clarify the impact of the tumor microenvironment on the prognosis of breast cancer patients, we performed a correlation analysis of the risk score and tumor microenvironment. The results demonstrated that the risk score was negatively correlated with immune cell infiltration (P<0.001, R=-0.36) and stroma cells (P<0.001, R=-0.7) (Fig 4E). And also, spearman correlation tests were performed based on stem cell score (DNAss) and stem cell score (RNAss) to explore the relationship between risk scores and cancer stemness scores, and the results showed a positive correlation between RNAss and risk score (r=0.16, p < 0.05) (Fig 4F). Therefore, the risk score of the prognostic model may be significantly correlated with the activity of cancer stem cells.
The relationship between IRGs and drug sensitivity
Through the NCI-60 database which was assessed via the CellMiner interface (https://discover.nci.nih.gov/ cellminer), we explored the effect of IRGs on drug sensitivity and obtained 16 drugs with statistically significant differences (Fig 5). The results showed that the expression of KCNMB2 was positively correlated with the sensitivity of Isotretinoin, Imuiquimod, Megestrol acetate, Fluphenazine, and Fulvestrant. It represented that the higher the expression of KCNMB2, the stronger the sensitivity to the above drugs. The expression of IL-18 was negatively correlated with the sensitivity of Pipamperone, Bortezomib, Actinomycin D, Estramustine, Vemurafenib, Vinblastine, Raloxifene, Arsenic trioxide, and Lomustine. In addition, the expression of IFITM1 has a positive correlation with Imatinib, and GPR has a negative correlation with Osimertinib. The analysis demonstrated that our risk score calculation model could effectively predict the sensitivity of cancer cells to these drugs and could lead to more precise drug use in clinical.
