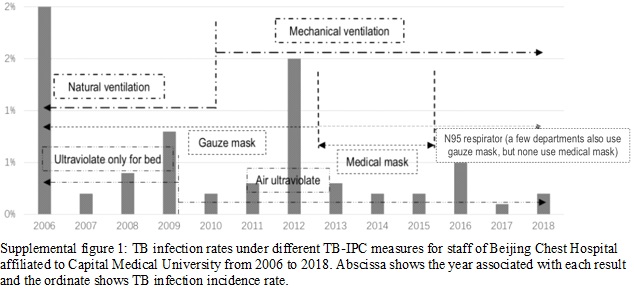
Supplemental figure 1 shows TB infection rates every year from 2006 to 2018. Notably, in spite of changing TB-IPC measures over time, masks were used as personal protective equipment for most of the study period. However, prior to 2012, staff wore gauze masks when at risk of TB exposure. From 2013 to 2015, medical masks replaced gauze masks in most department but still some department use gauze mask, and in 2016 medical N95 respirators replaced medical masks in most department but also some department still use gauze mask for its reusability (supplemental figure 1). Although ultraviolet irradiation and ventilation were used for environmental TB control prior to 2009, ultraviolet germicidal irradiation (UVGI) treatment during that time was only used for bed sterilization after patient discharge; since 2010, UVGI fixtures have been used daily. Regarding ventilation, prior to 2010 ventilation was based on natural air exchange, while in 2011 natural ventilation systems were replaced with mechanical ventilation systems. In figure 1, although natural ventilation was replaced by mechanical after 2011, mechanical ventilation was mainly used in department which deeply exposed to TB, other departments with slight exposure still used natural ventilation.
Each year new employees joined in the hospital staff and older employees retired. The sample size from 2006 to 2018 was 977, 941, 945, 953, 941, 943, 965, 943, 941, 941, 947, 974 and 976, respectively. The baseline of TST /IGRA positive was 20 in 2018, and these 20 cases was excluded in the next period. The HCW who had TST /IGRA conversion from 2006 to 2018 was 20, 4, 8, 2, 3, 14, 3, 2, 2, 5, 1 and 2, respectively. For the timely detection of TB infection by CT, none of these HCW who had TST /IGRA conversion developed to sputum-positive TB patients. Table 1 shows staff and TB-IPC characteristics in 2018, with distribution of variables for each category (age, sex, duration, education, income, respirator, ultraviolet, and ventilation) and staff proportions as shown. Workers who left prior to 2018 included retired workers (reaching retirement age) and resigned workers (because of family or personal reason). For the ones leaving their position only cover a little percent of the whole staff in our hospital, the mean value of each variable in each year doesn’t vary. In table 1, 69% of staff are undergraduate, including nurses, housekeeping, management staff, clerical workers, maintenance workers, security personnel, ancillary workers, some radiology technicians, pharmacists and laboratory workers.
Table 1: Characteristics of all the staff and different TB-IPC measures in Beijing Chest Hospital in 2018.
|
Variable
|
Mean or number (%)
(n=977)
|
|
Age
|
|
40
|
|
Sex
|
Male
|
282 (28.9%)
|
|
Duration of working time
|
|
16 (1.6%)
|
|
Education
|
Less than undergraduate
|
75 (7.7%)
|
|
|
Undergraduate
|
675 (69.1%)
|
|
|
Graduate and postgraduate
|
226 (23.1%)
|
|
Income
|
Equal and under average
|
611 (62.5%)
|
|
|
Above average
|
365 (37.4%)
|
|
Respirator
|
No respirator
|
584 (60.1%)
|
|
|
Gauze mask
|
177 (18.1%)
|
|
|
Medical mask
|
0 (0%)
|
|
|
High-level N95 respirator
|
215 (22.0%)
|
|
Ultraviolet
|
No ultraviolet
|
215 (22.0%)
|
|
|
Ultraviolet only for bed
|
0 (0%)
|
|
|
Air UVGI
|
761 (77.9%)
|
|
Ventilation
|
Natural ventilation
|
733 (75.0%)
|
|
|
Mechanical ventilation
|
243 (24.9%)
|
According to the aforementioned changes in TB-IPC measures, the period from 2006 to 2018 could be divided into early TB- IPC (2006-2010), intermediate TB-IPC (2011-2014), and enhanced TB-IPC (2015-2018) time periods (Table 2). Before 2010 (early TB-IPC period), TB-IPC measures included gauze masks, natural ventilation, and UV treatment only of beds. From 2011 to 2014 (intermediate TB-IPC period), medical masks, mechanical ventilation, and UVGI were used. After 2015 (enhanced TB-IPC period), medical masks were replaced with medical N95 respirators. Average TB infection rates per year for each TB-IPC period are shown in Table 2. In the enhanced TB-IPC period, a significant reduction in TB infection incidence rate was observed relative to incidence during the early TB-IPC period, when only limited TB-IPC measures were available.
Table 2: The TB infection rate in different period was compared by SPSS software. The period from 2006 to 2018 could be divided into early TB-IPC (2006-2010) and enhanced TB-IPC (2015-2018) according to the change of TB-IPC measure. The early TB-IPC (2006-2010) was set for reference group.
|
|
The average TB incidence rate per year in TB exposed environment (‰)
|
P value
|
|
Early TB-IPC
(2006-2010)
|
32.1
|
|
|
Intermediate TB-IPC
(2011-2014)
|
24.4
|
0.350
|
|
Enhanced TB-IPC
(2015-2018)
|
11.3
|
0.002
|
The prevalence of TB infection was analyzed against variables of age, gender, duration, workers’ education, income, respirator, ultraviolet, and ventilation, with univariate cox regression results presented in Table 3. Age, duration, department, income, respirator, ultraviolet, and ventilation were selected as potential predictors of nosocomial TB transmission (P<0.1).
Table 3: Factors associated with TB infection incidence analyzed by univariate cox regression analysis.

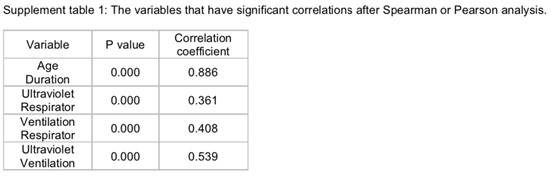
Bivariate correlations were analyzed using Pearson or Spearman tests (Supplement table 1). Age and duration were highly correlated, with a Pearson correlation value of 0.886 (P=0.000). To control the interaction between these two variables, only duration was chosen for the next multivariable analysis. Correlations between ultraviolet and respirator and between ventilation and respirator were low (0.361 and 0.408, respectively, P=0.000). As ultraviolet and ventilation showed a mid-level correlation (Spearman correlation value of 0.539, P=0.000), they were both selected for multivariable cox regression. No associations were found between other pairs of variables.
Next, multivariable cox regression analyses including duration, income, respirator, ultraviolet, and ventilation were performed (table 4). Although a significant predictor in univariable cox regression, duration showed no significant influence on TB infection (P>0.05), while income was a protective predictor (P<0.05), with an OR value of 0.499 (95%CI 0.273 to 0.915). Respirator was stratified into no respirator, gauze mask, medical mask, and medical N95 respirator, with no respirator serving as reference category to yield OR values for gauze mask, medical mask, and medical N95 respirator of 233.093 (P=0.000), 46.580 (P=0.000), and 0.000 (P=0.969), respectively. Notably, these results indicate that use of gauze masks and medical masks are risk factors for TB infection, while a result of P>0.05 obtained for medical N95 respirator indicated an insignificant correlation with risk. Nevertheless, use of a medical N95 respirator conferred excellent protection, with 0% TB infection observed for those using this device. Meanwhile, using no ultraviolet irradiation as the reference category, use of an air UVGI system protected against TB infection, with an OR value of 0.058 (P=0.000); using no ventilation as a reference variable, both natural ventilation and mechanical ventilation showed protective influences against TB infection (P=0.05). However, comparison of protective effects of natural versus mechanical ventilation demonstrated that natural ventilation had a greater protective effect against TB infection (P=0.000, OR: 0.222). This result prompted hospital maintenance workers to test mechanical ventilation systems carefully to detect contamination with TB-causing bacteria. Subsequently, results of testing led to recommendations that more frequent replacement of filter screens be incorporated into routine maintenance procedures for these systems.
Table 4: Multivariable statistics of TB infection incidence survival by cox regression analysis.
