3.1. Linear models assessed
In this study, the variations of X- and Y-axis coordinates of sixteen selected peaks were investigated and plotted as a function of moisture content. This means, not the changes in the spectrum heigh at the specified and fixed positions were measured (Fig. 1b), but the cautious evaluation on the real maxima coordinates of sixteen selected peaks has been conducted. Therefore, the approach presented relevantly differs from previously performed studies (Célino et al. 2014; Hou et al. 2014; Yuan et al. 2019; Consumi et al. 2021). It accounts the movements of the absorption bands’ maxima along both the axes of frequency and absorbance, as well as considers sixteen different peaks attributed to chemical groups embodied in cellulose structure.
Furtherly, as every cellulose IR analysis performed was accompanied by a short and precise Karl-Fischer titration experiment, the moisture content of each biopolymer sample has been successfully established. Then, the coordinates of absorption bands’ maxima were plotted as a function of water content in cellulose specimens. Consequently, to reduce the studied dependencies to a linear form, the regression adjustment has been performed separately for each peak. The results of the carried out investigation for three different models (simple linear, semilogarithmic, power) have been gathered in Table 2. The adjusted coefficient of determination (R2) was given for each model analysed. Furthermore, in case of absorbance-based models that exhibited R2 > 90% the standard error of calibration (SEC) was presented as well. Importantly, an external validation has been performed with ten additional IR-Fischer titration data packages.
From the information presented in Table 2, it is clearly visible that ATR FT-IR technique has a great potential as a tool in quantitative determination of water content in cellulose. It might be concluded that the absorbance-based simple linear model favourably described the gathered data, because R2 assigned to the simple linear fits for all peaks investigated exhibited a value higher than 90%. Therefore, the remaining semilogarithmic and power models have not been taken into consideration. Yet, regarding the wavenumber-based models, all three fits were investigated and none of them exhibited a value of R2higher than 90%, hence, they did not describe the data with a sufficient reliability. Further description of the models analysed in this study, as well as the observed changes of the peaks’ coordinates with raising moisture content of cellulose have been presented in the subsequent sections of the article.
Table 2
Quality parameters for models’ calibration and external set validation for the models selected (p-value for each regression on the level < 0.5); SEC – standard error of calibration, SEP – standard error of prediction, R2 – adjusted coefficient of determination.
|
Peak no.
|
Absorbance-based simple
linear model
|
Wavenumber-based calibration
|
|
Calibration
|
External validation
|
|
SEC [-]
|
R2 [%]
|
SEP [wt.%]
|
R2 [%]
|
Simple linear model R2 [%]
|
Semilogarithmic
model R2 [%]
|
Power model
R2 [%]
|
|
1.
|
0.02
|
96.9
|
0.5
|
99.2
|
10.6
|
10.2
|
10.2
|
|
2.
|
0.02
|
96.3
|
0.5
|
99.1
|
70.0
|
75.6
|
75.6
|
|
3.
|
0.02
|
96.8
|
0.5
|
99.1
|
65.7
|
64.9
|
64.9
|
|
4.
|
0.008
|
95.9
|
0.4
|
99.5
|
13.4
|
9.8
|
9.8
|
|
5.
|
0.04
|
92.0
|
0.6
|
98.8
|
41.4
|
46.4
|
46.4
|
|
6.
|
0.04
|
92.8
|
0.6
|
98.9
|
64.0
|
69.0
|
69.0
|
|
7.
|
0.02
|
94.0
|
0.5
|
99.1
|
9.6
|
16.4
|
16.4
|
|
8.
|
0.009
|
95.6
|
0.5
|
99.3
|
30.1
|
50.3
|
50.3
|
|
9.
|
0.004
|
93.1
|
0.5
|
99.3
|
66.4
|
66.7
|
66.7
|
|
10.
|
0.006
|
97.0
|
0.4
|
99.5
|
4.8
|
3.7
|
3.7
|
|
11.
|
0.005
|
96.5
|
0.4
|
99.5
|
45.4
|
51.2
|
51.2
|
|
12.
|
0.005
|
96.4
|
0.4
|
99.5
|
41.8
|
48.6
|
48.5
|
|
13.
|
0.004
|
96.3
|
0.4
|
99.5
|
46.4
|
50.5
|
50.5
|
|
14.
|
0.005
|
92.6
|
0.7
|
98.3
|
2.3
|
1.8
|
1.8
|
|
15.
|
0.005
|
94.9
|
0.5
|
99.2
|
58.3
|
49.0
|
49.0
|
|
16.
|
0.008
|
98.7
|
0.3
|
99.8
|
6.1
|
8.0
|
8.0
|
3.2. Absorbance-moisture content dependency
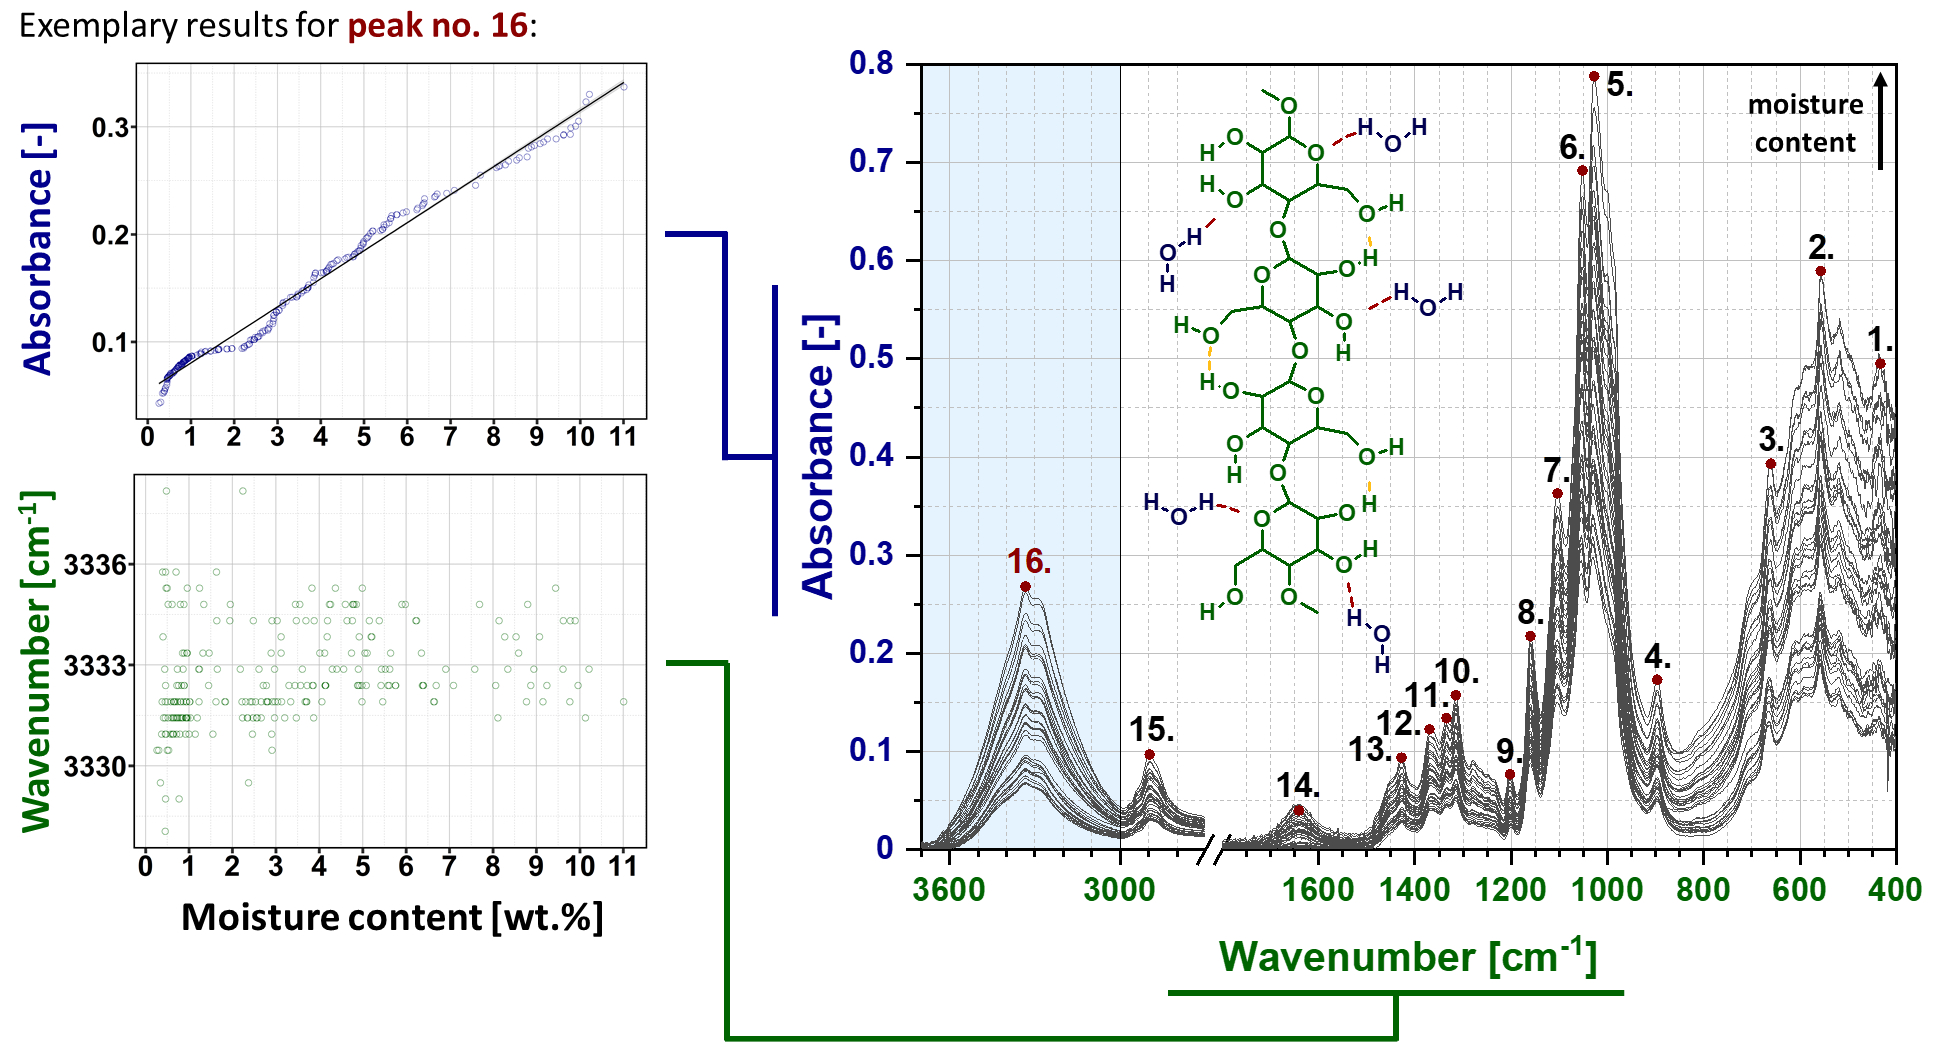
Figure 2 reveals the experimental data regarding the changes in the absorbance values (height of the peak) assigned to sixteen maxima visible in IR spectrum of cellulose fibres. Additionally, the black lines represent the regression functions that coefficients of determination (R2) and standard errors of calibration (SEC) have been shown in Table 2.
Firstly, giving a closer look at Fig. 2, in all 16 cases, the absorbance is lower around moisture content of approx. 2wt.%, then higher from 3-8wt.%, and again lower than predicted by the linear model. This might be caused by an uncontrolled re-equilibration process before carrying out new measurement. For a short time, the specimens are exposed to ambient conditions before each recording, and that this allows a re-equilibration (and thus deviation) with the ambient humidity. The other possibility could be the sensitiveness of the selected analytical techniques for the slight changes in cellulose moisture content.
Karl-Fischer titration. Experimentally measured band absorbance (dark blue) and mathematically adjusted regression (black) with marked confidence area (grey).
However, from Fig. 2 it might be also easily perceived that absorbance of all 16 peaks analysed is changing significantly while the moisture content in cellulose specimens elevates. The similar phenomenon has been observed by some other scientists (Célino et al. 2014; Hou et al. 2014; Yuan et al. 2019; Consumi et al. 2021). However, in this study the raise in the height of each peak recorded have been successfully described with linear functions exhibiting R2 > 90%. High value of adjusted determination coefficient means the models applied reliably reflected the experimental data.
Interestingly, signals originated from both oxygen-embodying (peaks no.: 1, 3, 4, 5, 6, 8, 9, 11, 16) and oxygen-lacking (peaks no.: 2, 7, 10, 12, 13, 15) chemical groups responded to the variations in moisture content in cellulose fibres. It is not surprising that changes in the maxima assigned to oxygen-rich chemical moieties, being able to form hydrogen bonds with water molecules, altered during the water absorption process (Mihranyan et al. 2004a). Because of the changes in cellulose-water interactions, the investigated chemical groups vibrate differently and differently react to the infrared radiation. Hence, absorbance/wavenumber shifts of the peaks could have become visible in IR spectrum (peaks no.: 1, 3, 4, 5, 6, 8, 9, 11, 16).
However, it is not certain what kind of mechanism stands behind the recorded variations in absorbance/wavenumber of the peaks assigned to non-polar CH2 and C-H chemical groups that are not able to directly interact with water molecules (peaks no.: 2, 7, 10, 12, 13, 15). Nevertheless, Celino et al. (Célino et al. 2014) proposed a theory that could bring some elements of understanding. The changes observed might be favourably described with the surrounding signals originated from oxygen-embodying chemical moieties. The shoulders of the maxima assigned to carbon- and oxygen-rich chemical groups overlap, thus, affecting the shape, as well as the height of the peaks visible in IR spectrum.
Another explanation has been proposed by Yuan et al. (Yuan et al. 2019) who concluded that IR spectrum might also react to the cellulose chain stiffening caused by moisture absorption. The scientists referred that the changes in the macromolecule’s stiffness might contribute to the shifts along both absorbance and frequency axes (due to the differences in the strength of a certain bonding).
Furtherly, the attention should be drawn to some interesting results that have been shown in Fig. 2n. Peak no. 14 is generally assigned to the moisture absorbed in cellulose (water content) (Oh et al. 2005b). Importantly, this maximum is not present in IR spectrum of the biopolymer in a dried state. Therefore, its appearance could be only related to the water absorbed by cellulose fibres. Consequently, it should precisely reflect the amount of moisture bonded to cellulose. However, an opposite effect could have been observed. Peak no. 14 exhibits one of the lowest values of adjusted determination coefficient R2 = 92.6% and the highest standard error of calibration SEC = 0.05 (Table 2). This observation could be explained with the nature of the peak. This spectral range is fragile to the atmospheric moisture (Weise et al. 1996). Hence, it is difficult to describe changes in the absorbance of peak no. 14 with a mathematic model because of the moisture present in the air. However, this test could be repeated in a moisture-free atmosphere. Probably, the obtained results would be more reliable. Nevertheless, such a complex measuring system would not find much use in practice.
Furtherly, maxima visible in IR spectrum are the common effect of many smaller signals that overlap. Therefore, their position and height are determined by many different interactions (Bledzki et al. 2002; Łojewska et al. 2005; Kondo et al. 2016), e.g. hydrogen bonds (Peršin et al. 2011), van der Waals forces (Missoum et al. 2013). Theoretically, these interactions may stabilize the peak’s position. If assume that peaks consisting of multiple signals and separated from the remaining absorption bands (restricted overlapping with neighbouring maxima) describe water uptake more reliably, a mathematical model assigned to an alone absorption band that might be deconvolved into different signals (especially corresponding to water-cellulose hydrogen bonds) should more accurately describe the changes in cellulose moisture content. Interestingly, this theory has found a confirmation in practice. The highest value of the adjusted coefficient of determination (R2 = 98.7%) has been recorded for partially separated peak no. 16 that could be successfully deconvoluted into three types of hydrogen bonding: intramolecular, intermolecular (Łojewska et al. 2005; Oh et al. 2005a). Most likely, the position of this peak is stabilized with three species of interactions that might be affected by the presence of water molecules. Then, the outcome is a describable and observable peak’s shift along the Y axis.
Next, all investigated models have been validated with external experimental data set. The results of the validation performed are presented in Table 2 and Fig. 3. The mathematical functions developed in this study revealed the satisfactory similarity between the newly recorded data and the values predicted with the linear functions. The coefficients of determination for validated models exhibited values from 98.3–99.8% with the best fit for peak no. 16.
However, it would be also worth considering whether it is reasonable to use only one absorption band to determine the water content of natural cellulose fibres, or whether the results calculated from the different absorption bands should be averaged. Therefore, additional calculations were made. The determined moisture contents obtained from the 16 absorption bands were averaged for each experimental point. Then, external validation was performed. The adjusted coefficient of determination was at the level of R2 = 99.5%, and the standard SEP prediction error – SEP = 0.4wt.%. These values indicate a slightly lower accuracy of such a method along with the determination of the moisture content in cellulose for, e.g., peak no. 16. Thus, proving once again the accuracy of the determinations made using this absorption band.
Additionally, a multivariate multiple regression analysis has been performed. This approach allowed to determine the relationship between the moisture content of cellulose fibres and the absorbance of multiple peaks recorded in IR spectrum. The results of the performed analysis have been presented in Table 3. It is visible that the mathematical model proposed has been characterized by the good correlation between the variables (coefficient of determination for calibration R2of approx. 99%) and the lowest recorded SEP = 0.2wt.%, indicating the sufficient and reliable description of the data analysed. Moreover, peak no. 16, with the p-value < 0.001, showed the highest significance in the investigation performed. This means, it might be favourably used alone in cellulose moisture content analysis.
Table 3
Quality parameters for multivariate multiple regression; SEC – standard error of calibration, SEP – standard error of prediction, R2 – adjusted coefficient of determination, p-value: - > 0.1, * < 0.05, ** < 0.01, *** < 0.001.
|
Peak no.
|
|
Significance (p-value)
|
Multivariate model statistics
|
|
Coefficients \({\beta }_{k}\) [-]
|
Calibration
|
External validation
|
| |
SEC [wt.%]
|
R2 [%]
|
SEP [wt.%]
|
R2 [%]
|
|
-
|
\({\beta }_{0}\) = -1.2
|
***
|
|
|
|
|
|
1.
|
\({\beta }_{1}\) = 3.5
|
-
|
0.3
|
98.9
|
0.2
|
99.5
|
|
2.
|
\({\beta }_{2}\) = -4.4
|
-
|
|
3.
|
\({\beta }_{3}\) = 5.0
|
-
|
|
4.
|
\({\beta }_{4}\) = -4.8
|
-
|
|
5.
|
\({\beta }_{5}\) = 8.7
|
-
|
|
6.
|
\({\beta }_{6}\) = -25.5
|
-
|
|
7.
|
\({\beta }_{7}\) = 77.4
|
**
|
|
8.
|
\({\beta }_{8}\) = -84.9
|
*
|
|
9.
|
\({\beta }_{9}\) = -6.5
|
-
|
|
10.
|
\({\beta }_{10}\) = -171.6
|
*
|
|
11.
|
\({\beta }_{11}\) = 209.6
|
-
|
|
12.
|
\({\beta }_{12}\) = -37.9
|
-
|
|
13.
|
\({\beta }_{13}\) = -2.5
|
-
|
|
14.
|
\({\beta }_{14}\) = 32.1
|
*
|
|
15.
|
\({\beta }_{15}\) = -9.5
|
-
|
|
16.
|
\({\beta }_{16}\) = 54.0
|
***
|
The data collected above undoubtedly indicates the information collected with ATR FT-IR technique could be successfully correlated with volumetric measurements of moisture content in cellulose (e.g., Karl-Fischer titration). Consequently, ATR FT-IR method might be favourably regarded as a quantitative technique for the determination of moisture content in cellulose fibres.
3.3. Wavenumber-moisture content relationship
Additionally, this is the first study that have deeply investigated the wavenumber-moisture content relationship and the possibility of the mathematical models adjustment (Célino et al. 2014; Hou et al. 2014; Yuan et al. 2019; Consumi et al. 2021). The gathered experimental points plotted as a function of moisture content in cellulose have been shown in Fig. 4. Similarly, as in the previous subsection, the dots reflect the recorded data plotted as a function of moisture content. However, this time, adjusting of any regression was not possible. According to the data presented in Table 2, none of the investigated models (linear, semilogarithmic, power) did exhibit a sufficient value of adjusted determination coefficient (R2 < 90%), hence, indicating inaccurate description of experimental data.
Although the linear regression models were unable to sufficiently reflect the collected experimental points, the data presented in Fig. 4 contains some important scientific information and deserves a brief discussion. It might be easily noticed that the behaviour of the maxima differs. Some peaks shift along X axis (peaks no.: 2, 3, 4, 6, 9, 11, 12, 13, 15), while the others remain relatively unchanged (peaks no.: 7, 10, 16) or exhibit specified positions irrespective of the moisture content (peaks no.: 1, 8, 14).
Most likely, the shifts described above might be related to the water-cellulose intermolecular interactions and different responses of the specified chemical groups to these attraction forces (Gao et al. 2005; Sun 2008). To better describe these relationships, it is worth to analyse the following equation (Eq. 6) that determines the frequency of vibrations of chemical groups \(\nu\) in IR spectrum (based on the spring action) (Rathod et al. 2017):
$$\nu =\frac{1}{2\pi \bullet c}\sqrt{\frac{k}{\mu }} \left(6\right)$$
where: \(c\) – speed of light (\(c=2.998\bullet {10}^{10}\frac{cm}{s}\)), \(k\) – force constant characteristic of the bonding [kg/s2],
\(\mu\) – reduced mass (\(\mu =\frac{{m}_{1}{m}_{2}}{{m}_{1}+{m}_{2}}\); \({m}_{i}\) – molar mass of the atom \(i\)) [-]. Since the shifts of absorption bands assigned to the same chemical groups are investigated, \(\mu\) remains constant (two atoms taking part in the bond formation are the same), c and \(2\pi\) are also constant, hence, for any higher \(k\) the \(\nu\) is increased. Therefore, a bond characterised by a higher constant \(k\) exhibits an elevated IR frequency when comparing the same type of vibrational motion. In other words, the higher force constant \(k\) means a stiffer "spring", namely, stronger bond.
Consequently, the absorption bands that change their position with increasing moisture content are the most interesting and informative considering the determination of active sites capable of water bonding. The peaks’ shift to the lower wavenumbers (peaks no.: 2, 3, 4, 6), purely theoretically, indicate a weakening of the bond strength (Rathod et al. 2017) in these chemical moieties during the moisture absorption process, while moving of the peaks no.: 9, 11, 12, 13, 15 toward higher values of frequency indicates possible bond stiffening/strengthening.
Obviously, the signals mentioned above are mostly assigned to the polar moieties (able to form hydrogen bonds with water molecules (Luo and Zhu 2010)), e.g., peaks no. 3, 4, 6, 9, 11. However, neighbouring to them maxima attributed to non-polar groups (peaks no. 2, 12, 13, 15) also shift significantly. This might be caused by the overlapping with the signals originated from polar moieties (Leszczyńska et al. 2019) or chain stiffening (hence, affecting the force constant \(k\)) during the water absorption process.