Datasets
The gene expression data generated by RNA-seq of ovarian cancer and matched normal tissues adjacent to cancer were obtained from TCGA (https://portal.gdc.cancer.gov/). The raw read counts were utilized to identify differentially expressed genes between OV and normal by R package DEseq2 (https://www.bioconductor.org/packages/release/bioc/html/DESeq2.html). The upregulated or downregulated gene was, defined with a false discovery rate (FDR) value < 0.05, the log2(fold change [FC]) > 1 or < −1, respectively. The clinical data were also retrieved, including survival endpoint (vital status and days to death), age and stage.
The gene expression data and clinical information of GSE51088 [8] and GSE26193 [9] datasets were downloaded from GEO datasets. Patients with unknown survival status and survival time were excluded for further analyses.
Overall survival analysis
The Kaplan-Meier curve was plotted and Hazard Ratio (HR) was determined using R package survival and survminer. Also, the log-rank P-value was calculated. The multivariate analysis with the Cox proportional hazards model was applied to estimate the factors associated with prognosis.
Protein-protein interaction analysis
To investigate proteins that interacted with LAYN. Information about protein-protein interaction was obtained and the interaction network was constructed by GeneMANIA (http://genemania.org) as the online tool used to predict co-expressed genes with LAYN.
Tumor-immunity-related gene analysis and immunity therapy response prediction
We analyzed the correction between LAYN expression and the CAF signature, T cell exclusion signature, T cell dysfunction signature, and TIDE score using the TIDE algorithm [10]. Scores were calculated using the CAF signature, T cell exclusion signature, and T cell dysfunction signature. Also, the TIDE score which is a comprehensive score considering multiple related signatures was calculated. Besides, the TME score was calculated by TMEscore R package [11]. The scores of each OV sample in TCGA were calculated and the differences between LAYN -high and -low expression groups were analyzed.
Pathway enrichment analysis
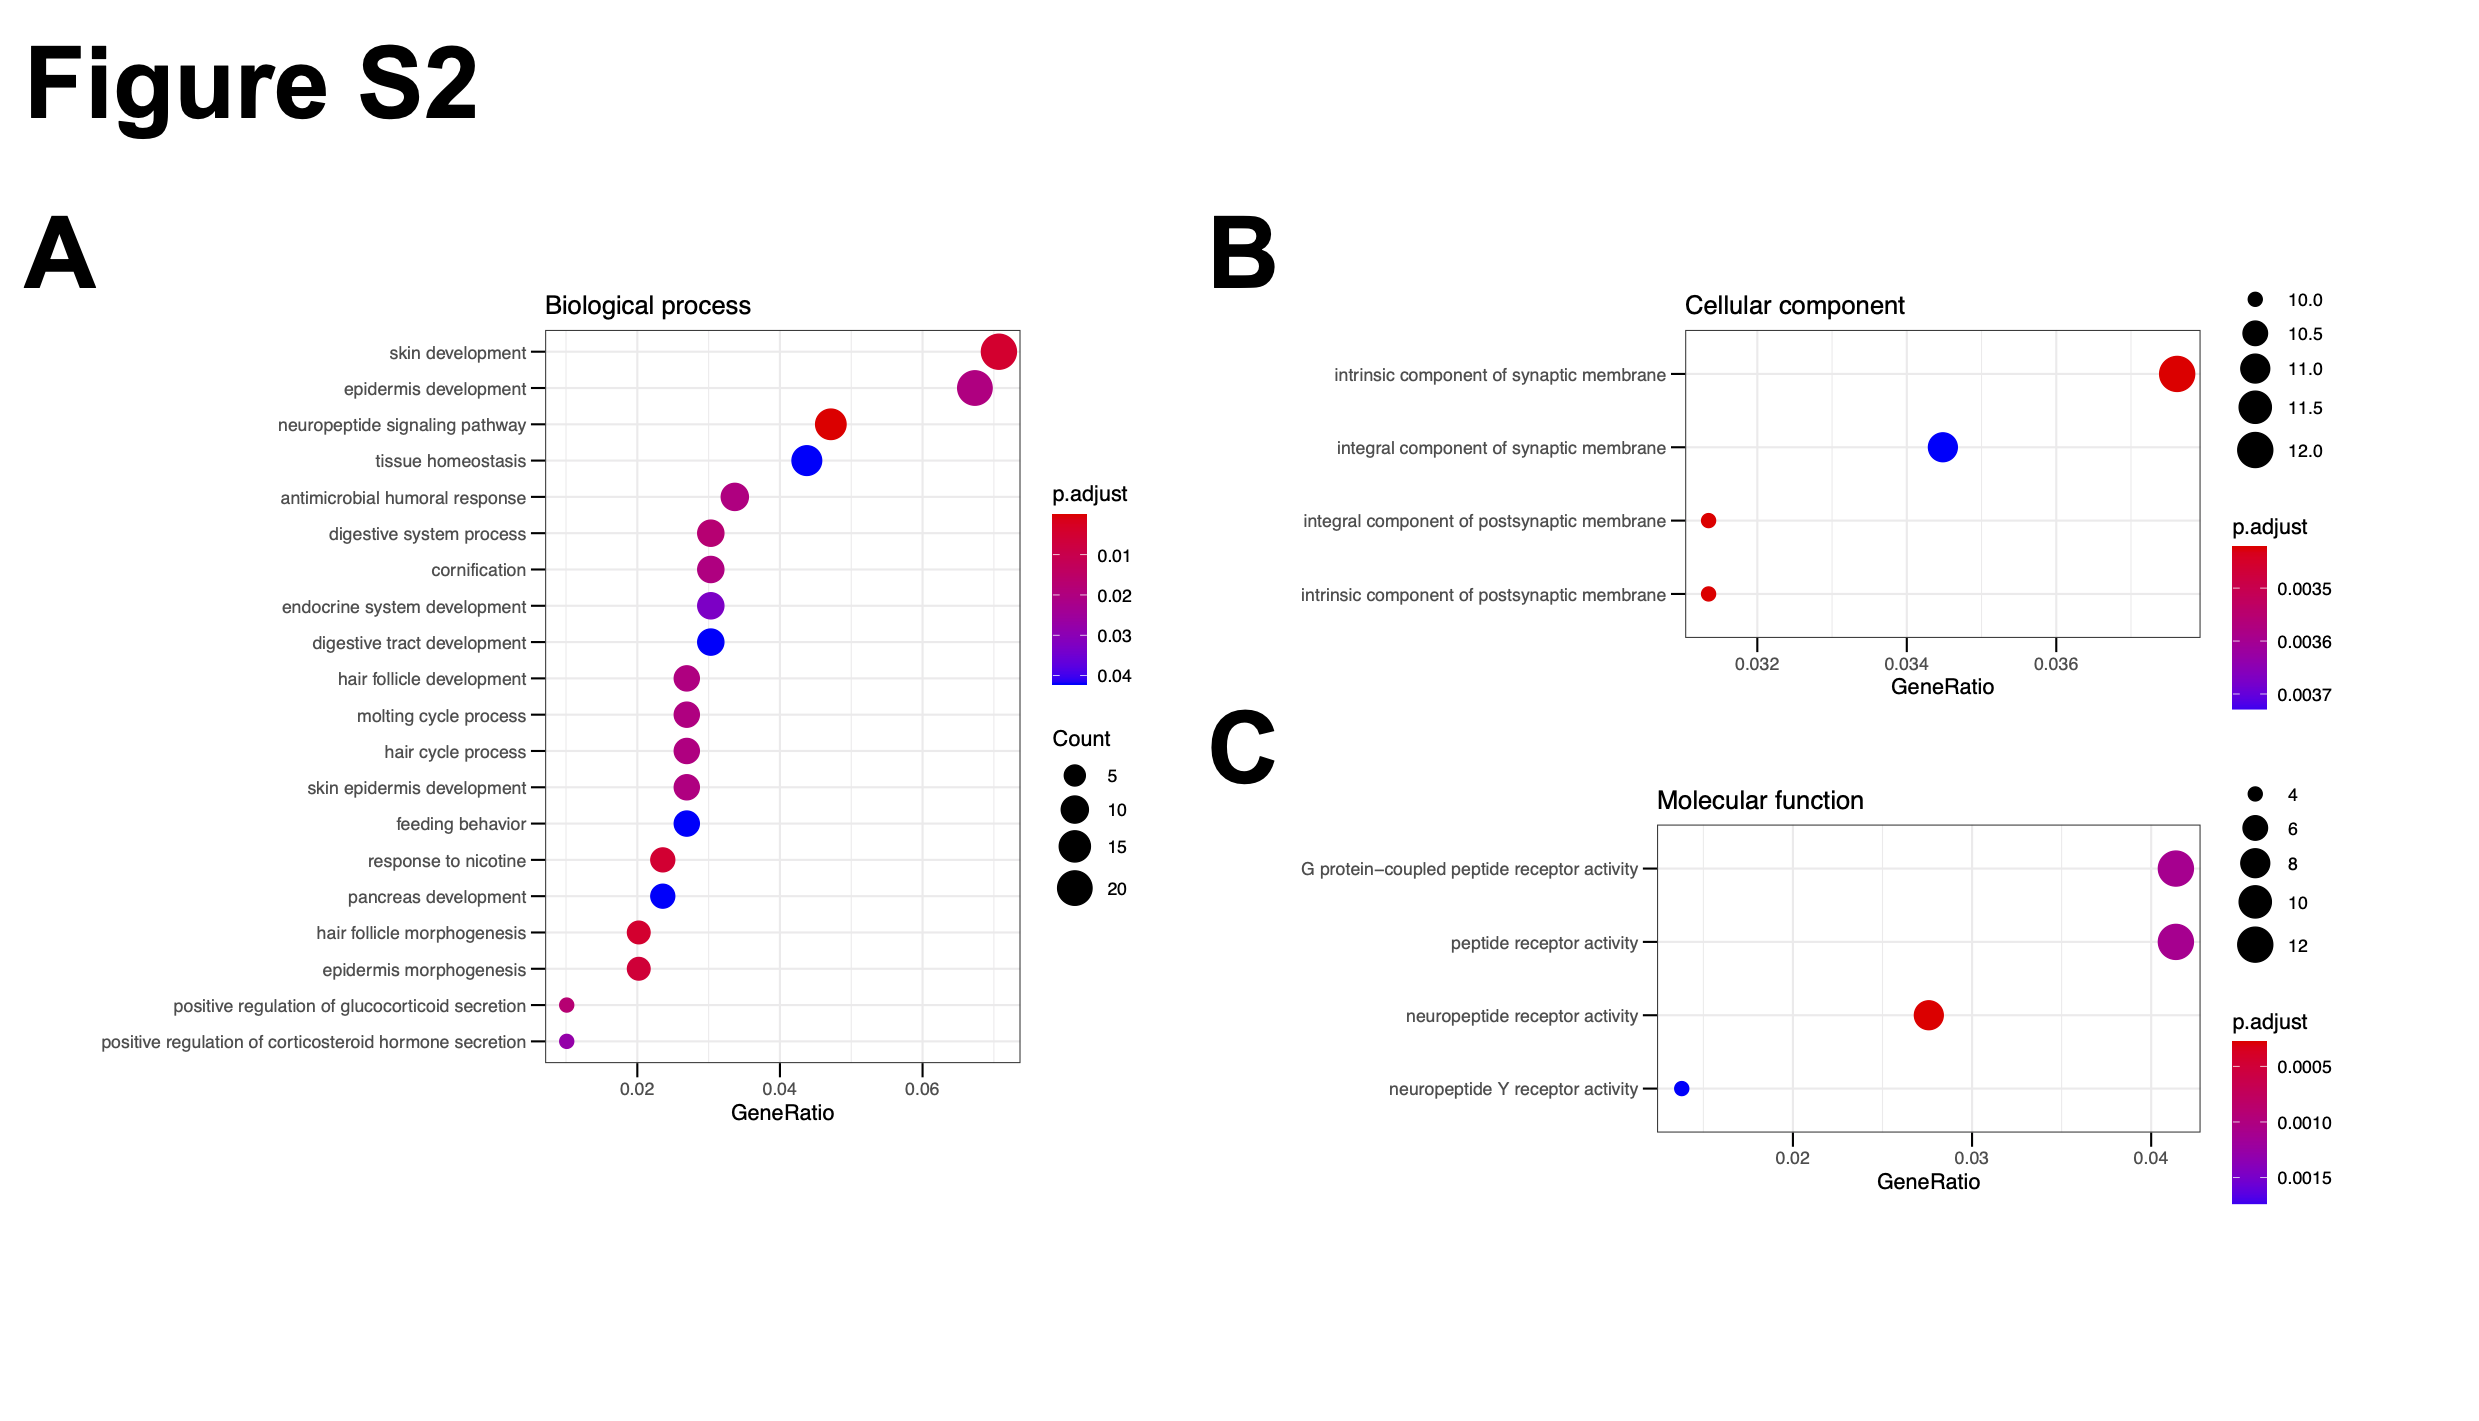
Pathway analyses were based on differentially expressed genes between OV and NC or between LAYN-high and -low groups, which were performed in the Gene Ontology and/or Kyoto Encyclopedia of Genes and Genomes (KEGG) using all canonical pathways as NCBI Gene IDs (c2.cp.v7.4.entrez.gmt). KEGG pathways with Normalized Enrichment Score (NES) >2 and FDR < 0.05 were selected for further analysis.
Gene Set Enrichment Analysis
The gene sets of all canonical pathways as NCBI Gene IDs (c2.cp.v7.4.symbols.gmt) from the MsigDB database (http://www.gsea-msigdb.org/gsea/msigdb/index.jsp) were used for Gene Set Enrichment Analysis (GSEA) with R package clusterProfiler. NES and FDR were both calculated. The significant pathway was defined as NES ≥ 2 and FDR < 0.05.
Gene set variation analysis (GSVA) on the TGF-beta signaling pathway
The gene sets representing the TGF-beta signaling pathway were obtained from pan-fibroblast TGFβ response signature [Pan−F−TBRS] [12]. It contains 19 genes, including ACTA2, ACTG2, ADAM12, ADAM19, CNN1, COL4A1, CTGF, CTPS1, FAM101B, FSTL3, HSPB1, IGFBP3, PXDC1, SEMA7A, SH3PXD2A, TAGLN, TGFBI, TNS1, TPM1. The R package GSVA was applied to calculate the enrichment scores of the gene set for each OV sample [13].
Statistics analysis
Differences between the two groups were assessed by a two-tailed, unpaired Student’s t-test. For overall survival (OS) analyses, Kaplan–Meier curves were compared by the log-rank test. Multivariate analysis with the Cox proportional hazards model was applied. The false discovery rate (FDR) was used for p-value correction. p-values or FDR < 0.05 were considered to be significant. In this study, p < 0.05, < 0.01 and < 0.001 were marked by 1 asterisk, 2 asterisks or 3 asterisks, respectively. All statistical analyses were performed in R v4.0.3.