Nanoparticle characterization
In this study, we investigated the pharmacokinetics of magnetite nanoparticles coated with glucuronic acid polymer FluidMAG-ARA (Chemicell, Germany) with a nominal size of 50 nm. This particle size was selected for our study as an average one for the contrast particles already used in clinic for MRI (20–100-nm agents).[21] The scanning electron microscopy showed high monodispersity of the magnetite particles with the core size of 20 ± 3 nm (Fig. 1a,b). The hydrodynamic size of the particles in water was 35 ± 8 nm (Fig. 1c). This ratio of the physical and hydrodynamic sizes indicated that the 50-nm FluidMAG-ARA are likely single-core polymer coated particles. The measured particle ζ-potential was − 23 ± 5 mV (Fig. 1d), which was high enough to provide the NP colloidal stability in serum and other biological fluids.
Nanoparticle circulation in blood
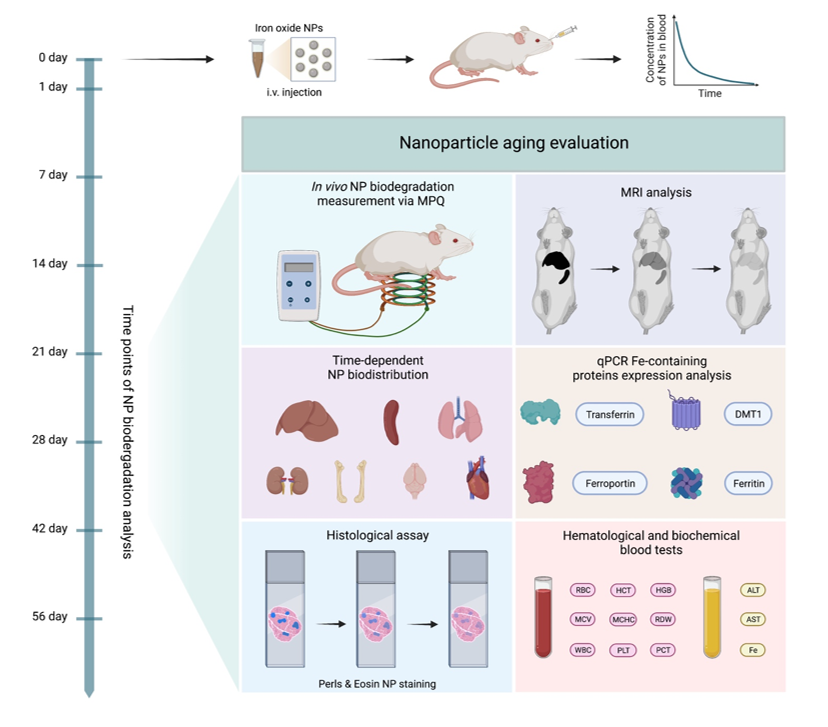
Then we studied the short-term fate of magnetic nanoparticles in vivo: blood circulation kinetics and initial biodistribution. For the nanoparticle detection, we used the MPQ approach, which was recently updated for biosensing of various analytes using MPs as assay labels.[22–24] The MPQ allows non-invasive measurement of the magnetic particle concentration in murine veins and arteries. Briefly, a mouse tail is placed into the detection coil generating magnetic field at two frequencies: at a low frequency f1 with a high amplitude H1 and at a high frequency f2 with a low amplitude H2. The linear dia- and paramagnetic materials, including iron ions and biological tissues, response only at the applied magnetic field frequencies f1 and f2, while nonlinear ferro- and superparamagnetic materials such as most MPs provide additional responses at combinatorial frequencies of the applied magnetic field f = nf1 + mf2 (where n, m are integers, n2 + m2 ≠ 0). This enables extremely sensitive measuring the magnetic particle concentration in biological media. The method also features high time resolution. In this experiment, it was 2.8 s (Fig. 2a-c).
The curve of the nanoparticle elimination from the bloodstream was of bi-exponential type with fast t1/2 fast = 2.2 ± 1.1 min and slow t1/2 slow = 34.4 ± 7.2 min decays. The total time of nanoparticle elimination from the bloodstream was 1.5 h. The obtained results well correlate with the literature data for non-stealth nanoparticles.[20] Pharmacokinetics in a logarithmic scale (Supplementary Fig. S1) showed that in the first 10 min, the particle elimination rate was significantly faster than during the following part of the curve. This can be caused by a saturation of the process of the particle uptake by macrophages due to the slow process of reverse recycling of the membrane receptors of the cells after the endocytosis. This feature was previously discovered for in vivo injections with high doses of nanoparticles,[25] as well as during experiments with an ex vivo liver perfusion model.[26]
MPQ contrast aging
Next, we used SQUID magnetometry to measure magnetization curves of the liver as the main organ that eliminates MPs from the bloodstream (Fig. 2d). The magnetization curve of a control liver sample without nanoparticles exhibited insignificant nonlinearity and reached saturation at the level of 10− 4 emu/g of tissue. Such magnetic behavior of the tissue may be due to the presence of antiferromagnetic ferritin in the liver.[27] After administration of 300 µg of 50-nm magnetite nanoparticles, the liver magnetization increased 40-fold, and the curve showed superparamagnetic behavior. Zero coercive force of the liver samples indicates the absence of significant aggregation of magnetic cores inside the tissue 1 day after the particle injection.[28] The significant difference in the sample magnetization while maintaining the nonlinear behavior allowed us to use magnetic spectroscopic techniques such as MPQ to study in vivo and ex vivo the aging processes of FluidMAGARA nanoparticles.
For non-invasive measurements of the nanoparticle biodegradation, a mouse was fixed, and the area of the liver and spleen was scanned with the MPQ measuring coil. The maximum detected signal was used to assess the concentration of particles in the organ. Figure 2e shows that the amount of detectable magnetic material was decreasing with half-life t1/2 = 21 ± 4 days. Two months after the nanoparticle injection, only 7.4 ± 0.4% of the initial magnetic signal was detected in the liver and spleen. These data define the diagnostic window for the use of MPs as contrast agent for magnetic spectroscopic approaches, where the particles generated sufficient contrast against the liver background for two months and were well detectable in vivo.
Evolution of nanoparticle biodistribution
The observed drop of magnetic signal in the liver can be explained both by particle aging followed by their transition to weakly magnetic or linear magnetic forms of biogenic iron and by the redistribution of particles from the liver to other organs. Therefore, further we studied the evolution of nanoparticle biodistribution for 2 months after their administration (Fig. 3).
The ex vivo study of the nanoparticle biodistribution with the MPQ technique showed that one day after the injection, most of the nanoparticles (96 ± 6% ID) were localized in the liver (Fig. 3b). Then, they gradually degraded with time, and 3 weeks after the injection the magnetic signal in the organ decreased by more than 2 times, while after 8 weeks less than 10% of the initially injected dose was present in the liver. At the same time, a significant amount of the nanoparticles (2 ± 0.4% ID) was observed in the spleen (Fig. 3c). After 1 week, a magnetic signal from the nanoparticles in the organ reduced by half. However, for the next 2 months, the signal did not change significantly. That can be explained by active redistribution of the particles between the organs. The liver and spleen are the main organs of the mononuclear phagocyte system responsible for elimination of nanoparticles from the bloodstream. Nevertheless, 1 day after the particle administration, significant quantities of the nanoparticles (from 0.1 to 0.8% of the ID) were observed in lungs, kidneys, bones, brain and heart (Fig. 3d-h). However, after 1 week, the magnetic signal from these organs significantly decreased and became almost undetectable by the MPQ technique. A similar redistribution of the particles between organs with nonspecific nanoparticle accumulation was previously described for other iron oxide nanoparticles.[29]
MRI contrast aging
Since the superparamagnetic nanoparticles are widely used as T2 contrasts for MRI, we investigated the evolution of their contrasting properties during their aging in the body (Fig. 3a). The best contrast was observed 1 day after the nanoparticle injection, the contours of the liver and spleen are clearly visible in the pictures. Besides, a slight contrast in comparison with untreated organs was observed in bones and kidneys (Supplementary Fig. S2).
Subsequently, during biodegradation of the particles in the body we observed a gradual decrease of the nanoparticle contrast properties. After 7 days, in all organs except liver and spleen the contrast returned to the control value, and the spleen contours were poorly observable. Quantitative contrast measurements showed that the MRI signal after 2 months of observation in the liver and spleen became 2 times lower than 1 day after the nanoparticle injection. Nevertheless, even after 8 weeks of the nanoparticle biodegradation, the liver contours were still clearly observable. Based on both our MPQ and MRI studies, we can declare that even 10% of the administered dose of 50-nm FluidMAG-ARA particles (1.5 µg/g tissue) is sufficient to contrast the liver by magnetic techniques. Thus, intravenous injections of even small doses of magnetic nanoparticles can be used for long-term contrasting MRI studies of liver but in all other organs the contrast properties of the nanoparticles quickly decay. It can be explained by uneven nanoparticle biodistribution between the organs (Fig. 3). Therefore, we assume that to contrast other organs except liver, the nanoparticle redistribution or alternative administration methods should be used. Besides, the detected 2-month diagnostic window for the liver can be further used to evaluate the time-dependent contrast properties of existing MRI contrast agents based on magnetic nanoparticles and those under development.
Evaluation of Fe-containing protein expression
Iron is one of the most important metals in the body, involved in oxygen transport, DNA synthesis, oxidation-reductions, electron transport, etc.[30] Its storage and transport are implemented by various proteins.[31] Therefore, the next goal of this study was to investigate the effect of iron release during MP biodegradation on expression of iron-containing proteins. Within 28 days after the particle injection, we studied the expression level in the liver of the main iron-containing proteins such as transferrin, DMT1 (with and without IRE domain), ferroportin and ferritin (light and heavy chains) (Fig. 4a-f). It should be noted that the expression level of transferrin, which is mainly produced in the liver and is responsible for binding of Fe3+ ions, increased by almost 2 times after 24 h since the nanoparticle administration and remained at high level after both 2 and 4 weeks (Fig. 4a). We assume that this can be explained by the high level of its involvement in the iron transport processes through the blood plasma[32], which redistribute biogenic iron between the organs during the nanoparticle biodegradation.
A similar expression change was also observed with the transport and storage of Fe2+ ions associated protein DMT1 (also known as Natural resistance-associated macrophage protein 2) (Fig. 4b,c). An expression of this protein also increased significantly and became more than 2.5 times higher in 2 weeks after the nanoparticle injection. However, for the next 14 days, the expression level decreased, and in 28 days post-injection it wasn’t statistically distinguished from the initial level. We hypothesize, this dependence can be explained by the high concentration of the released iron during the first 2 weeks of the nanoparticle degradation, but when the iron release rate drops, it may lead to the decrease in the expression level of DMT1 protein as a highly efficient iron carrier. We assume that the obtained tendency can indicate the reversibility of this process.
Besides, on the 28th day after the injection, we observed a significant increase in the expression level of intracellular iron exporter ferroportin (Fig. 4d). During the first 2 weeks, there were no noticeable changes in its expression level but for the next 2 weeks it dramatically rose by more than 2.5 times. This increased protein amount can be involved in the processes of iron redistribution in the body, as well as in the processes of forming biogenic ironcontaining clusters for long-term iron storage.
And finally, we investigated the expression level of ferritin (Fig. 4e,f) as one of the main proteins associated with intracellular iron-storage.[16] The level of its expression in the liver also tended to increase, however this increase was not statistically significant. We hypothesized, this small changes in the liver can be explained by the fact that the main iron storage organ is spleen, not the liver (Fig. 5a).[33]
Thus, biodegradation of the nanoparticles is accompanied by complex multi-stage processes of transporting and storing the released iron. During these processes, changes in expression levels can be observed for both proteins responsible for the iron transport outside the macrophages and for the proteins that implement iron transport between the organs through the blood.
Hematological analysis
It was previously shown that an increase in the iron amount in the body may affect blood formation processes.[34] Therefore, we investigated an impact of the nanoparticle biodegradation on hemopoiesis and thrombopoiesis. The hematological analysis was carried out for 56 days after the particle administration (Fig. 4g-r).
On 7, 28, 42, and 56 days after the nanoparticle injection, we observed 6–14% increase in the RBC amount and 2 % increase of hematocrit (Fig. 4g,h). Those deviations are large but are still permissible within the normal non-pathological range.[35] A similar trend was also observed for hemoglobin (46 increase at 7, 42, 60 days) (Fig. 4i). We assume that during the nanoparticle degradation, an increased iron release can stimulate erythropoiesis due to ferritin accumulation in macrophages, and that leads to the hemoglobin production in reticulocytes. From our data, we can suggest that the magnetic nanoparticles can be fast and, at the same time, a prolonged source of affordable iron and have pronounced erythropoietic activity.
It is also important to note that during the nanoparticle degradation, we did not observe any significant changes in the other erythrocyte parameters: mean corpuscular volume (MCV), mean corpuscular hemoglobin (MCH), mean corpuscular hemoglobin concentration (MCHC), and red cell distribution width (RDW) (Fig. 4jn). These results may indicate that the nanoparticle degradation do not cause toxicity towards the RBC and do not disturb the hematopoiesis.
However, the nanoparticle intravenous administration led to 71% drop of WBC amount on the first day of the study (Fig. 4o). That can be explained by involvement of several WBC types such as lymphocytes, monocytes, and neutrophils in the nanoparticle recognition in blood, with subsequent cell transport to mononuclear phagocyte system organs and cell destruction. Nonetheless, after complete removal of the nanoparticles from the bloodstream, the number of leukocytes gradually returned to the reference values. In addition, we didn’t observe any significant changes with platelet parameters such as platelet count (PLT), plateletcrit (PCT) and platelet-large cell ratio (P_LCR).
Thus, we can conclude that the nanoparticle injection can lead to a short-term reduction in number of leukocytes, while the nanoparticle biodegradation can stimulate erythropoiesis with increasing the hemoglobin level. Besides both processes don’t affect thrombopoiesis.
Histological assay
The next series of experiments was devoted to toxicological studies of nanoparticle degradation processes by the pathomorphological analysis of the liver, spleen and kidneys slices (Fig. 5a). In the liver, we didn’t observe any morphological changes on days 1, 7, 28, and 56 after the nanoparticle injection. However, on day 14 after the injection, the number of non-epithelial cells (Kupffer cells and lymphocytes) was increased, and fine to average dystrophy was revealed. After Perls staining of the liver slices, we observed hemosiderin deposits on 1, 7, and 14 days after the nanoparticle injection. However, after 28 days, the number of iron-positive cells decreased, while 56 days after there were only extracellular small tight deposits of hemosiderin, observed probably due to the death of macrophages loaded with the nanoparticles.
In the spleen, on day 1 after the nanoparticle injection, we didn’t observe any morphological pathologies. However, after 7 days, there were detected a hyperplasia of white pulp and an increase of lymphoid nodules. Then, on day 14 we identified wide light centers in the spleen, hyperplasia of periarteriolar lymphoid sheath (PALS) zones, and the increased quantity of megakaryocytes. However, on day 28, the light centers were not so wide compared to day 14, and the marginal zones were narrowing. Finally, on day 56, we observed an increase in the red pulp cellularity and the number of megakaryocytes. We hypothesized that all these morphological changes in the spleen could indicate an immunomodulatory or stress effect, which could be caused by the nanoparticle biodegradation. After Perls staining, we observed the hemosiderosis of the spleen during all 8 weeks of the experiment. on day 1 after the nanoparticle injection, hemosiderin deposits were detected in the red pulp and in the center of lymphoid nodules. On day 7, the number of hemosiderin deposits increased, but on day 14, their amount decreased in lymphoid nodules, and on days 28 and 56 - in the entire spleen.
In the kidneys, on 1, 7, 14, and 56 days after the nanoparticle administration, there weren’t any morphological changes. However, on day 28, a dystrophic change in the epithelium of several tubules was revealed. After Perls staining on day 1 after the nanoparticle injection, we observed blue diffuse staining in the epithelium of some kidney tubules, which was mainly located in luminal area of the cells. On day 7, the intensity of diffuse staining was increased, but on day 14, it reduced, and on days 28 and 56 disappeared. We hypothesized that the presence of extra iron in the kidneys could be explained by non-specific accumulation of the smallest nanoparticles and their following degradation. This assumption well agrees with the obtained biodistribution data (Fig. 3e).
Biochemistry
To study the organ specific toxicity of the nanoparticle decomposition products throughout the entire period of their degradation, we carried out a biochemical analysis of blood parameters such as alanine aminotransferase activity (ALT), aspartate aminotransferase activity (AST), and iron concentration (Fe) (Fig. 5bd).
It is well known that ALT is an enzyme, which is mainly contained in liver and less - in kidneys, heart and skeletal muscles.[36] Almost any damage of the hepatic parenchyma contributes to the release of this enzyme into the blood. At the same time, AST enzyme is primary located in tissues with intense metabolism (heart muscle, hepatic cells, kidneys, pancreas and erythrocytes).[36] Usually, after an acute or chronic damage of the tissues, these enzymes are released from cells. That leads to an increase of their activity in blood in direct dependence on the number of damaged cells. In our study of iron oxide degradation, ALT and AST activities remained within the normal ranges and were statistically not distinguishable from the control group values. Interestingly, the iron concentration remained at the level of the control group values during the entire nanoparticle biodegradation process. We assume that the absence of changes in the iron concentration may be explained by the fact that the long-term nanoparticle degradation do not cause toxic iron poisoning. The slow release of iron from nanoparticles may contribute to its rational redistribution and deposition of its excess in the iron biogenic forms such as hemoglobin, ferritin and hemosiderin. Thus, the results of blood biochemical analysis indirectly indicate that the long-term degradation of the injected nanoparticles do not cause any toxic effects in the internal organs and do not impact significantly the iron level in the blood plasma.