2.1 The formation energy of Na4FexP4O12 + x (2 ≤ x ≤ 4) system
In order to elucidate the structure and stability of the phases, the formation energy of the Na4FexP4O12 + x system is first calculated through DFT theory. There are three different phases, including NFPO, NFPP, and NFP, present in the Na4FexP4O12 + x system according to previous reports.[22–28] The crystal structures and their normalized atomic proportions are shown in Fig. 1. NFPO (Fig. 1a) belongs to the triclinic system with the P-1 space group, which consists of two FeO6 octahedrons and two PO4 tetrahedrons along the b and c axes, respectively, interlaced together by sharing corners, and most of the active Na ions are mainly distributed in the larger channels along a axis.[22, 23] NFPP (Fig. 1b) has a typical 3D open framework structure, which belongs to the orthorhombic system, Pn21a space group. And it consists of three FeO6 octahedra and three PO4 tetrahedrons along b and c axes, respectively, to form infinite layers of [Fe3P2O13] units, accompanying the [P2O7] groups connecting the layers along the a axis to form larger Na+ ion diffusion channels along b direction.[24, 25] Compared to the above structures, the NFP (Fig. 1c) has a higher symmetry, which belongs to the orthorhombic system, the Pnma space group. And it consists of FeO6 octahedrons by sharing edges to form infinite layers along the b axis, and PO4 tetrahedrons are served as a bridge to connect the different layers along the a axis, and the Na+ ions are trapped between the layers.[26–28] By comparing the above three different structures, it is found that the Fe content has a significant impact on the arrangement of FeO6 octahedrons and the ratios of PO4/P2O7 groups in the crystal, thus determining the formation of different phases. Two phases of NFPO and NFPP can be used as the initial and final states of the Na4FexP4O12 + x samples, and the NFPP is used as the intermediate state. The relationship among the three phases is shown as follows:
Na2FeP2O7 + 2 NaFePO4 = Na4Fe3(PO4)2P2O7 (1)
ΔE = E (Na4Fe3(PO4)2P2O7) – E(Na2FeP2O7) -2E(NaFePO4) (2)
The formation energy of NFPP is calculated according to Eq. (2), and the result is shown in Fig. 1d. The formation energy of NFPP is -0.38 ev/f.u, indicating that the NFPP phase tends to form during synthesis. Besides, when x is in the interval of 2 ~ 3 and 3 ~ 4, the structure of Na4FexP4O12 + x is unknown and cannot be simulated. Therefore, it’s hard to determine whether there are other stable phases in the interval. Notably, one polyanionic cathode of Na3Fe2(PO4)P2O7 was reported in the past few years, which can be rewritten as Na4Fe2.67P4O14.67 with the same composition of Na4FexP4O12 + x when x is 2.67.[29–31] However, the crystallographic data and structure of Na3Fe2(PO4)P2O7 are still not available. According to the relation of formation energy in Fig. 1d, when x is 2.67, it is speculated that the material may be a mixture of NFPO and NFPP. To prove this hypothesis, we conducted detailed experiments to verify whether any new phase exists in the Na4FexP4O12 + x system except for NFPO, NFPP, and NFP.
2.2 The phase and morphology analyses of Na4FexP4O12 + x (2 ≤ x ≤ 4) system
To obtain the exact number of phases and their correlations, we prepared seventeen samples with the same formula of Na4FexP4O12 + x but varied x via a simple spray-drying method (Figure S1). ICP results show that the ratios of P/Fe in the series of Na4FexP4O12 + x samples are consistent with the theoretical value (Table S1). Figure 2a shows the XRD curves of the obtained Na4FexP4O12 + x samples. Some diffraction peaks appear or disappear regularly with the change of x value. To identify the peak evolution process, the enlarged XRD patterns between 8 to 18° and 30 to 38° are presented in Fig. 2b and 2c. Three phases can be observed in the series of samples. Based on previous reports and the three-phase energy formation relationship in Fig. 1d,[22–28] the blue, red, and green arrows refer to the phases of NFPO (x = 2.00), NFPP (x = 3.00), and NFP (x = 4.00), respectively. For x values of 2.00, 3.00, and 4.00, Rietveld refinements of curves are implemented according to the space groups of P-1 (NFPO), Pn21a (NFPP), and Pnma (NFP), respectively. The Rietveld refinement results have a low R-factor (Fig. 2d-f), indicating a high phase consistency, and the corresponding crystallographic parameters are listed in Table S2-4. To further determine the mesophase distribution among the NFPO, NFPP, and NFP, we selected two representative samples for Rietveld refinement and the in-situ XRD test. One sample is located at x = 2.70, which has the same diffraction peak and element ratio as the Na3Fe2(PO4)P2O7 (Na4Fe2.67P4O14.67) materials.[29–31] The XRD can be accurately refined using the phase of NFPO and NFPP with a low Rwp of 2.04% (Figure S2), implying that the material with the composition of Na3Fe2(PO4)P2O7 is a two-phase mixture. Another sample is located at x = 3.31 (Na4Fe3.31P4O15.31), which is refined as a mixture of NFPP and NFP (Figure S3). The maricite NFP prepared at high temperature is reported electrochemical inert due to no effective Na ion diffusion channels.[26–28] Therefore, an in-situ XRD test during electrochemical reactions for x = 3.31 (Na4Fe3.31P4O15.31) electrode should provide favorable evidence to confirm the presence of a mixture of NFPP and NFP. Figure 2g shows the charge/discharge curves and contour maps of the in-situ XRD test of x = 3.31 electrode, and the corresponding structure transformation during Na+ insertion/extraction is shown in Fig. 2h-i. Two different peak evolutions were observed in the contour maps during the Na+ insertion/extraction (Fig. 2g). Completely reversible peak shifts such as (0 1 3) (1 2 2) and (4 2 0) are observed during the first cycle, indicating a topological Na+ insertion/extraction into/from the lattice with one-phase structural evolution, and the characteristics are consistent with NFPP.[24, 25] Conversely, the diffraction peaks such as (2 2 0) and (0 0 2) have no shifts during the charge/discharge process, corresponding to the electrochemically inert maricite NFP. The above results prove that only three phases exist in the Na4FexP4O12 + x system. The phase diagram with different x values is shown in Fig. 2l. Obviously, due to the low formation energy of NFPP (Fig. 1d), it exists as a mesophase throughout all the samples. It’s worth noting that there is no three-phase coexistence region in the Na4FexP4O12 + x system, which benefits from the optimal experimental scheme. In contrast, the three-phase mixture is usually formed by a solid-state method or Na4P2O7 as raw material due to the inhomogeneous ion distribution.[29, 30] Besides, when the NFPP sample is synthesized according to the stoichiometric ratio (Na4Fe3(PO4)2P2O7), it inescapably contains an NFP impure phase with a weight fraction of about 4% (Fig. 2g and Figure S4). This phenomenon has been widely reported in previous works.[32–34] Surprisingly, a high phase-pure NFPP can be obtained when x is 2.91, and the Rietveld refinements results of Na4Fe2.91P4O14.91 (x = 2.91) show that a few Fe vacancy exists in the structure (Figure S5 and Table S5). The possible occupation sites of Fe vacancy and their effect on structure will be discussed in detail by subsequent DFT calculations.
The subtle structural differences in the Na4FexP4O12 + x samples are further analyzed using FT-IR spectra. Figure 3a-c shows the FT-IR spectra of NFPO, NFPP, and NFP. All IR absorption peaks located in the ranges of 400–700 and 970–1300 cm− 1 can be attributed to the bending or stretching vibrations of O-P-O/P-O in the PO4 groups, respectively. Besides, the symmetric and antisymmetric vibration peaks of P-O-P in P2O7 groups of the NFPO sample are located at 735 and 903 cm− 1 (Fig. 3a), respectively.[33, 34] However, for the P2O7 groups in the NFPP sample, their P-O-P absorption peaks shift to lower wave numbers of 723 and 891 cm− 1 due to the changed interaction between ions (Fig. 3b) [33, 34] As there are no P2O7 groups in the NFP sample, it does not show any vibration absorption peaks of P-O-P (Fig. 3c). To show the structural differences of other Na4FexP4O12 + x samples, their FT-IR spectra are collected and provided in Figure S6. The P-O-P vibration absorption peaks located at 735 and 903 cm− 1 of the NFPO sample gradually weaken and disappear as x increases from 2.00 (NFPO) to 2.91 (NFPP). At the same time, the P-O-P vibration absorption peaks located at 723 and 891 cm− 1 of the NFPP sample gradually emerge and intensify. These results indicate that the samples are a mixture of NFPO and NFPP, and their ratio gradually changes with x. When x further increases to 4.00 (NFP), the above absorption peaks located at 723 and 891 cm− 1 of the NFPP sample gradually weaken and disappear. These results are well consistent with the XRD results that three phases existed in the Na4FexP4O12 + x system.
The morphologies and element distribution of NFPP (x = 2.91), a typical example of a series of Na4FexP4O12 + x samples, are examined by SEM and EDS. As shown in Fig. 3d-k, the NFPP sample presents a hollow spherical structure with a particle size of 1–5 um, and the spherical shell is composed of stacked particles of about 50 nm. The abundant pore structure is conducive to the full infiltration of electrolytes to ensure the full use of active materials. Elemental mappings of an individual sphere show that Na, Fe, P, and O elements are uniformly distributed in the NFPP sample (Fig. 3h-k). Raman and XPS spectra are also employed to characterize the structural properties. As displayed in Figure S7 and S8, the ratio of disordered carbon (ID) to crystalline graphitized carbon (IG) is 1.90, and the valence state of the Fe element is mainly bivalent, which shows that the pyrolytic carbon from citric acid has good electrical conductivity and can reduce ferric iron at high temperature. The carbon content of the NFPP sample is about 3.7 wt% based on elemental analyzer results.
2.3 The Fe-defects in NFPP
The NFPP (x = 3.00, Na4Fe3(PO4)2P2O7) sample synthesized by stoichiometric ratio contains a small amount of maricite NFP impurities, which is consistent with previous reports.[32–34] However, a high purity NFPP (x = 2.91) phase can be prepared by regulating the x value in the material, as reported in our previous work.[21] To understand the in-depth mechanism of this phenomenon, we further analyzed the samples of x = 3.00, 2.91, and 2.86 by XRD and DFT calculations. As shown in Fig. 4a, all three samples show almost the same diffraction patterns, indicating that all the samples have the same dominant phase. However, the enlarged XRD patterns in Fig. 4b show that the x = 3.00 sample contains two impurity peaks at 32.4 and 32.6°, which can be indexed into the maricite NFP phase. And the x = 2.86 sample contains a small amount of impurity peak at 10.2°, which can be indexed into the NFPO phase. Only the x = 2.91 sample has no impurity peaks, exhibiting a high pure phase. To reveal the subtle differences in the three samples, we further amplified the diffraction peaks of (200) and (011) crystal planes. The (011) crystal plane peak of x = 3.00 sample shows an obvious shift, indicating that some defects or ion mixing may exist in the structure.[22, 25] Detailed XRD refinement results are shown in Fig. 2e, S5, S9, and Tables S3, S5 and S6. All samples contained a small number of Fe-defects, that is 4.2%, 2.2%, and 2.5% at Fe2 sites for the three samples of x = 3.00, 2.91, and 2.86, respectively. The results demonstrate that NFPP (x = 2.91) is a pure phase with Fe-defects, which is reasonable to explain that NFPP samples synthesized by stoichiometric ratio always contain the maricite NFP.[26–28] The Fe-defect formation energy of NFPP indicates that the Fe2-site is more likely to be lost in structure by DFT calculations (Fig. 4d), which is consistent with the XRD refinement results. The lattice parameters of the three samples are shown in Fig. 4g. The crystal cell of the x = 3.00 sample is shortened along the a-axis and decreases in volume compared with other samples, demonstrating that the existence of Fe-defects has a certain effect on the distribution of atoms in crystal cells. The crystal structures at the Fe2-defective site are placed in Fig. 4h and 4i. The presence of Fe defects causes irregular changes in the adjacent interatomic bond angles, corresponding to the changes in atom position, which has a significant effect on the diffusion of Na+. Figure 4e and 4f show the radial distribution function of the Na-O and Fe-O bonds. The x = 2.91 sample has a longer Na-O bond and a shorter Fe-O bond than the x = 3.00 sample, indicating that Na+ ions are easier to be extracted in the x = 2.91 material. As a result, the x = 2.91 sample has the best electrochemical performance, which is consistent with the experimental results.
2.4 The electrochemical properties of Na4FexP4O12 + x (2 ≤ x ≤ 4) samples
According to the above XRD analyses, three phases (i.e., NFPO (x = 2.00), NFPP (x = 2.91), NFP (x = 4.00)) exist in the Na4FexP4O12 + x system, and the Na4FexP4O12 + x is a two-phase mixture when x is at other values. The electrochemical properties of seventeen Na4FexP4O12 + x samples are evaluated by cyclic voltammetry and galvanostatic measurements. As shown in Fig. 5a, S10, and S11, the NFPO electrode exhibits two pairs of distinguishable redox peaks at 2.57/2.33 V and 3.11/2.84 V and NFPP (x = 2.91) electrode shows two pairs of different redox peaks at 3.06/2.76 V and 3.28/3.15 V, corresponding to Na+ insertion/extraction process in different sites, respectively. As a result of the difference in redox potential in the above two structures, the redox peaks in the mixture samples change regularly with the variation of x values from 2.00 to 2.91. Figure 5b lists the initial charge/discharge curves of some Na4FexP4O12 + x electrodes. The discharge capacity arrives at 85.7, 86.8, 88.4, 90.9, 93.2, 98.1, 105.0 and 110.1 mAh g− 1, respectively, showing a linear increase with the rising of x values from 2.00, 2.11, 2.25, 2.40, 2.55, 2.70, 2.86 to 2.91. As the theoretical capacities of NFPO and NFPP are 98 and 129 mAh g− 1, respectively, the discharge capacities of Na4FexP4O12 + x samples increase regularly with the evolution of phases from NFPO to NFPP. According to previous reports,[22, 23] part of Fe3+ presents in the NFPO structure because of its sensitivity to air, which causes the Coulomb efficiency to be higher than 100% in the first cycle. Similarly, the initial Coulomb efficiency of the above electrodes decreases gradually from 114.0–92.1% with the evolution of the phase from NFPO to NFPP (Fig. 5c). Figure 5d-f shows the CV and first cycle charge-discharge curves of the electrodes with the x value from 2.91 (NFPP) to 4.00 (NFP). Since maricite NFP has no effective diffusion channel for Na+, it behaves as an electrochemical inert material.[26–28] Therefore, the redox peaks and reversible capacities of electrodes gradually decrease with the phase transformation from NFPP to NFP, which is consistent with XRD analyses. The cyclic stability is shown in Fig. 5g, all electrodes exhibit remarkable stability with almost no decay over 1000 cycles owing to the stable crystal structures of NFPP and NFPO materials. The rate properties of all electrodes are further characterized and illustrated in Figure S12. The electrodes show regular changes due to different phase purity, among which pure phase NFPP and NFPO electrodes can release reversible discharge capacities of 88.9 and 17.7 mAh g− 1 at a high rate of 20 C, respectively, corresponding to 80.8% and 20.3% of capacity retention ratio compared to 0.2C, and the rate performance of other electrodes is in the middle of the two pure phase NFPP and NFPO electrodes. As NFP is an electrochemical inert material, its presence will significantly reduce the performance of mixture phase samples (Figure S12b).
To better understand the wide difference in rate performance between NFPP and NFPO, the kinetics of the Na+ insertion/extraction process in the cathodes are investigated. As shown in Figure S13 and S14, the calculated DNa+ values of NFPP electrode are about 2.36⋅10− 11 (peak I), 1.43⋅10− 11 (peak II), 6.56⋅10− 11 (peak III), and 1.49⋅10− 12 (peak IV) cm2 s− 1 for Na+ extraction and insertion processes, respectively, which are much larger than the NFPO electrode, that is 1.07⋅10− 12 (peak I), 7.54⋅10− 12 (peak II), 4.97⋅10− 12 (peak III) and 4.77⋅10− 12 (peak IV) cm2 s− 1, respectively. In addition, according to the slope-value of log(i)-log(υ) plots (Figure S13c), the calculated b-values are 1.08 (peak I), 0.89 (peak II), 0.80 (peak III), and 0.61 (peak IV), respectively, mainly close to 1, indicating that the charge storage mechanism of NFPP mainly exhibits the capacitive characteristic, and its proportion to the total capacity is about 93.4% at the scan rate of 0.5 mV s− 1. Conversely, the b-values of NFPO are closer to 0.5 (Figure S14c), demonstrating that the charge storage mechanism of NFPO is representative of a diffusion limitation response.[35] This result can well explain the huge difference in rate performance of NFPP and NFPO.
2.5 Pouch cell performance
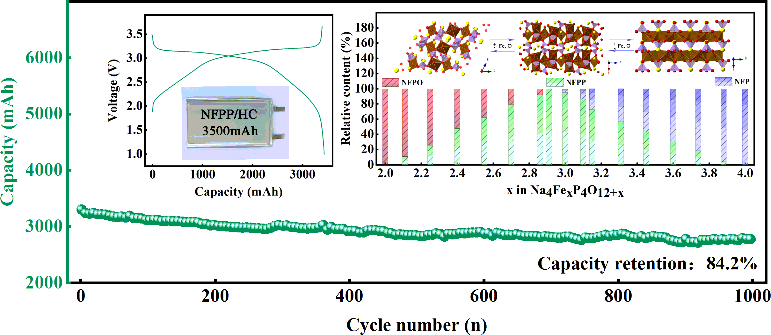
As discussed above, the NFPP (x = 2.91) sample shows the best electrochemical performance among the series of Na4FexP4O12 + x (2 ≤ x ≤ 4) samples. To further verify the practical application of the pure phase NFPP (x = 2.91) sample, we assembled a batch of 3500 mAh pouch cells using the commercial hard carbon (HC) as the anode and NFPP (x = 2.91) as the cathode. Figure 6a is the charge/discharge curves of the cell after pre-activation, the effective reversible discharge capacity reaches 3431 mAh at 0.2C along with an average discharge voltage of about 3.0 V. Figure 6b shows the rate performance of the cell. The cell can release a reversible discharge capacity of 3133 mAh at a high rate of 5C, corresponding to the capacity utilization of 91.3% compared to that of 0.2C. The low-temperature performance is very important for the practical application of cells. As shown in Fig. 6c, even when the cell is tested at -40°C, it still has a reversible capacity of 2814 mAh, corresponding to a capacity retention ratio of 82.0% at 25°C, which is much better than lithium iron phosphate (LFP) batteries, and even comparable to ternary oxide lithium-ion batteries. Figure 6d exhibits the over-discharge curves of the cell and the corresponding cycle stability is shown in Figure S15. After 140 cycles at 1C, a capacity retention ratio of around 81.0% for the pouch cell is obtained (Figure S15), demonstrating high over-discharge safety and stability. The outstanding over-discharge performance of the HC//NFPP pouch cell greatly ensures the safety of the battery during transportation and storage, which is beneficial to expand its application fields. Moreover, the HC//NFPP pouch cell also exhibits long cycling life. Specifically, the capacity retention of around 84.2% over 1000 cycles at 1C is achieved (Fig. 6e). All these results indicate the high application possibility of the NFPP (x = 2.91) for SIBs with low cost, high rate capability, superior low-temperature performance, excellent cycling stability.