In this research, carbon quantum dots (CQDs) were synthesized by using pistachio as precursor for the first time with a hydrothermal method in aqueous media. Synthesized QDs were characterized by different analyses such as X-ray diffraction (XRD), transmission electron microscopy (TEM), energy dispersive X-ray spectroscopy (EDS), field emission scanning electron microscopy (FESEM), Fourier transform-infrared spectroscopy (FT-IR), BET, Zeta potential, Raman, photoluminescence (PL) and UV-visible (UV-vis) spectroscopies. The Raman spectroscopy results showed 3.54 value for G/D ratio and this result confirmed that synthesized CQDs are composed of graphitic crystalline structure. Zeta potential measurement of CQDs showed that CQDs had negative charge in their surface and it confirmed a great stability for CQDs. CQDs had blue photo emission with a broad PL peak between 300 to 600 nm with quantum yield of 12%. TEM images showed that synthesized CQDs are spherical with a size of about 7 nm. Heavy metal sensitivity of CQDs were investigated by different heavy metal ions in water media and results showed that PL intensity of CQDs in presence of Co2+ ions decreased and showed CQDs had sensitivity versus Co2+ ions. Photocatalyst activity of CQDs were investigated by different dyes under visible and UV illuminations. The obtained results showed that methylene blue had better degradation with CQDs than methylene orange and rhodamine b. The radical scavenger's results obtained that electrons play the key role in photocatalyst process of CQDs with methylene blue under UV irradiation.
Research Article
Luminescence carbon quantum dots: synthesis using pistachio as precursor, investigating optical properties, application for Co 2+ detection in water media and photodegradation of organic dyes
https://doi.org/10.21203/rs.3.rs-1950337/v1
This work is licensed under a CC BY 4.0 License
Version 1
posted
You are reading this latest preprint version
CQDs
synthesis
Co2+ sensitivity
photocatalyst activity
Zero-dimensional nanoparticles which their sizes are less than 10 nm called quantum dots [1–5]. The unique properties of QDs are dependents to particle size and shape [3–7]. Carbon quantum dots (CQDs) are new generation of QDs that duo to their great chemical stability, unique optical properties, non-toxicity, biocompatibility, and excellent water solubility attracted great attention in these days and which can be used in wide range of applications such as light emitting deods (LEDs), lasers, sensors, and bio imaging [8–16]. Synthesis of carbon QDs from organic and natural materials as carbon source is a new and interest subject because synthesis these nanomaterials are inexpensive [17–19]. Manny efforts had been synthesized CQDs from different organic materials such as green tea [20], egg yolk oil [21], honey [22], bamboo leaves [23], garlic [24], soy milk [25], orange juice [26], and lemon juice [27]. Although photoluminescence (PL) mechanism of semiconductor QDs is known but photoluminescence mechanism of CQDs is complicated and not been fully understood [26–28]. Heavy metals are called to metals with density of more than 5 g/cm3 [29–30]. Excessive accumulation of heavy metals in water or food is hazardous for humans and animals [30–33]. Photo emission of QDs in presence of heavy metals ions decrease or quench and due to this issue QDs can be used as heavy metals ions sensors [31–35]. Photodegradation and removal of hazardous organic dyes such as methylene blue (MB), methylene orange (MO), and rhodamine b (RB) from aqueous media by using of nanostructures have attracted great attention and many efforts had reported their results [36–40].
In this research, for the first time we could synthesis CQDs from pistachio. The hydrothermal method was used for synthesized of CQDs. The structural and optical properties of synthesized QDs were characterized by different analyses. Heavy metals sensitivity of the prepared CQDs investigated by different heavy metal ions in water media and the photocatalyst performance of synthesized CQDs was investigated by methylene blue, methylene orange and rhodamine b as pollutants under UV and visible illuminations.
2.1. Materials
Pistachio kernels was obtained from pistachio trees in Rafsanjan city and used without further purification and deionized water (DI) was used during the experiment.
2.2. Synthesis of Carbon QDs:
Carbon QDs were synthesized by a hydrothermal method. First, the pistachios kernels were crushed by using a mixer. 0.2 g of pistachios kernels powder was added to baker with 50 ml DI and stirred for a few minutes. The suspension container transferred to a Teflon lined stainless steel autoclave and was kept at 200 \(℃\) for 1 h. After finishing synthesis time, the autoclave was allowed to cool down to room temperature naturally. After opening the Teflon, dark brown powder with brown solution observed which brown solution was centrifuged for at 6000 rpm for 5 min for remove the large un-dissolved particles and finally, the solution was filtered to further purification. The final prepared solution was carbon QDs and was characterized by different analyzes. Figure 1 depicts schematically synthesis process of CQDs from pistachio and also shows the CQDs solution under ambient light and UV-light. CQDs solution were light brown which under UV irradiation had blue photo emission.
2.3 Characterizations
X-ray diffraction (XRD) data was recorded by D8-Advance Bruker X-ray diffractometer using Cu-Kα radiation at the wavelength of 1.54 Å. Optical absorption spectrum was recorded using an Avantes spectrometer (AvaSpec-2048 TEC). Furrier transformed infra-red (FTIR) data was collected using a Nicolet 10 (Thermo scientific Company of USA). Raman spectroscopy was performed at room temperature on a Renishaw-1000 Raman system with a 50 mW argon-neon laser at an excitation wavelength of 514.5 nm. Transmission electron microscope (TEM) images were obtained using a LEO912 AB electron microscope operating at the bias voltage of 200 kV. BET data was recorded by BEISORP mini, zeta potential and DLS results were recorded by Zetasizer.
Figure 2 (a) shows XRD pattern of synthesized carbon QDs. The XRD pattern of CQDs indicates from a main peak at 2θ = 20 ° and d = 4.5415 A which is related to (002) plane of JCPDS card no. 26-1076 [41]. Raman spectrum of synthesized carbon QDs is shown in Fig. 2 (b). Raman spectrum of CQDs indicates of two sharp peaks at 1311.87 cm− 1 and 1585.82 cm− 1 which are related to D-band and G-band, respectively. The D-band peak (sp3 hybridization) shows the amount of defect, functionalization and edge effect corresponds to the A1g symmetry photons near K-zone boundary and G-band peak (sp2 hybridization) corresponds to the amount of graphitization associated with CQDs. The ratio of G/D, which means the intensity of G-band peak divided on the intensity of D-band of Raman spectrum, obtained about 3.54 that is much higher than other G/D reported ratios [42–45]. The higher G/D ratio confirmed that the synthesized QDs are composed of graphitic crystalline structure. The zeta potential measurement was done to understanding which charge exists on surface of CQDs. Figure 2 (c) shows zeta potential of CQDs, a broad doublet peak in negative side is shown in this figure and the highest peak located in -18 mV. These negative surface charge confirmed a very high stability for CQDs resulting excellent dispersion in aqueous media [46] and can be a good candidate to adsorbing of material with positive charge such as metals ions. It means that synthesized CQDs can an adsorbing metal ions or sensing metal ions due to electrostatic interactions [47].
Zeta potential results confirmed the presence of negative charge moieties on surface of synthesized CQDs, for more understanding about the structure of surface moieties, FT-IR analyze was done. Figure 3 (a) and (b) show FT-IR spectrum of pistachio and CQDs, respectively. The FT-IR spectrum of pure pistachio have a assigned-peak to O-H stretching at 3350 cm− 1 and some peaks corresponding to C-H at 3007 (C-H stretching alkene groups), 2952 and 2854 (CH or CH2 stretching aliphatic groups ), 1461 (CH aliphatic bending groups) [48], 1380 (CH3 in proteins) [49] and 722 cm− 1 (CH ≡ CH). There are another the main peaks at 1746, 1655, 1640, 1546, 1240 and 1162 cm− 1 which can be attributed to C = O, NH3 [50], C = C [51], amid II [52], stretching C-N, C-O-C stretching, C-O ring vibrations in carbohydrates [53], respectively. FT-IR spectrum of reveals a broad and strong peaks at 3225 cm-1 corresponding to OH and NH symmetric and asymmetric stretching, noting that the broadening is due to hydrogen binding [54]. Three peaks at 2963, 2933, 2874, 1453, 1402, 706 cm− 1 attributed CH stretching and bonding vibration [55–56]. Also, there are another main peaks 1672 (C-O-C), 1592 (C = O), 1517 (CON-H), 1325 (C-OH), 1293 (C = S), 1220, 1105 and 1048 (C-O), 1149 and 672 (C-S), 1074 cm− 1 (C-N). As it seen from FTIR spectra due to organics compositions in pistachio, there are some bonding consisting of S and N leading N-S cooped CQDs that has effective impact on the photoluminescence property of CQDs. The persistence COOH is deduced from peaks of C = O ad C-H. The negative charge resulted from zeta potential can be affected by COOH bond leading to good dispersing of CQDs [57].
Figure 4 (a) shows EDS analyze of CQDs. As shown in this figure, carbon and oxygen elements are present in structure. The little amounts of oxygen element in structure is for aqueous media of synthesis process. The amount of nitrogen and sulfur elements was too low and the EDS analyzer could not show them. Figure 2 (b-c) show FESEM and TEM images of CQDs with spherical shape and approximate size of 7 nm.
Figure 5 (a) depicts PL spectrum of CQDs. PL spectrum of CQDs indicates of a doublet broad peak from 300 to 650 nm with two peaks at 360 nm and 485 nm. Figure 5 (b) shows absorbance spectrum of CQDs, in this figure there are two band edge, first a strong band edge centered at 286 nm and another a small band edge at 360 nm which are related to the π-π*transition of C = C and n-π* transition of C = O bands, respectively [42, 45]. During synthesized process the synthesis time was changed and the optical behavior of the synthesized CQDs was investigated. Synthesized times of 1–5 h, the PL spectrum was like Fig. 5 (a) with less intensity but after 6 h from synthesis process the PL spectrum changed and is shown in Fig. 5 (c). As shown in this picture a broad doublet peak changed to a narrow PL peak at 510 nm. It can be explained that with increase synthesis time CQDs grow and further carbonization occur leading to red shift in PL spectrum. Figure 5 (d) depicts the absorbance spectrum of synthesized CQDs after 6 h synthesis process. For investigating effect of solvent on PL intensity of CQDs, 5 mg of synthesized CQDs were dispersed in 5 ml of different solvents and results are shown in Fig. 5 (e). As shown in this picture the highest PL intensity of CQDs was in acetone and lowest of intensity was in dimethylformamide (DMF). These results shows that the PL of synthesized CQDs is dependent to solution due to surface trap or interaction of oxygen, nitrogen and sulfur bonds with environment around of QDS.
Given that the CQDs charge is negative, they may interact to metal ion, that's what we investigated sensitivity of them by different metal ions such as Zn2+, Ni2+, Hg2+, Ag3+, Cd3+, Cu2+, Fe2+, As3+, Pb2+, Mn2+, and MO4+ in water media. The relative PL intensity (I/I0) CQDs after adding of these metals ions with the concentration of 5 mM are shown in Fig. 6 (a). The relative PL intensity for cobalt had higher sensitivity, then it was selected for investigation in lower concentration. Figure 6 (b) shows ln (I0/I) versus Co2+ concentration, which I0 and I are the PL intensity of CQDs in absence and presence of Co2+ ions. The inset picture of Fig. 6 (b) depicts ln (I0/I) versus Co2+ ions concentration in range of 100 µ molar to 280 µ molar. As it can be deduced from this picture, there is a good relationship with linear equation of y = 0.0027 x + 0.193 and R2 = 0.9944 between degree of decreasing in PL intensity and Co2+ concentration. As the obtained results confirmed, only Co2+ ions can decrease PL intensity of CQDs dramatically and these results show that CQDs can be used as Co2+ fluorescence sensor.
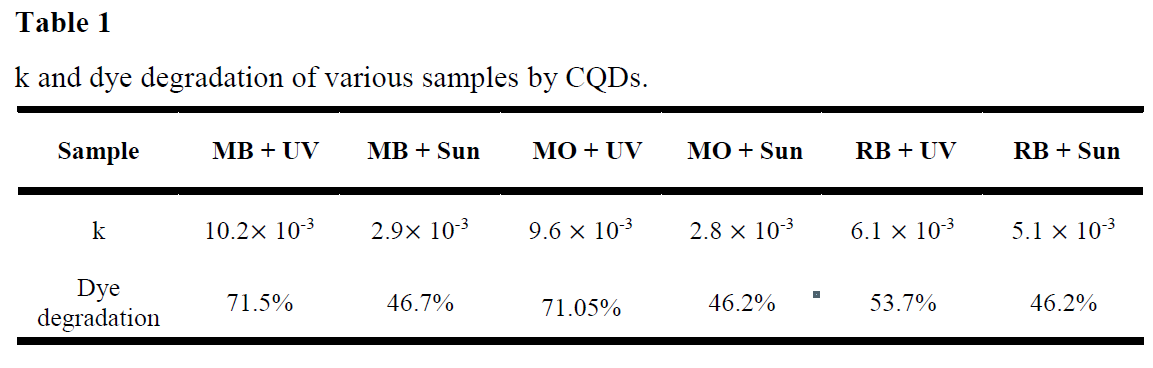
As CQDs are nontoxic, application of them for photodegradation of organic dyes from water is important and they can be known as green catalyst. The photocatalyst performance of CQDs were investigated by methylene blue (MB), methylene orange (MO), and rhodamine b (RB) under both UV and visible illuminations. 10 mg of synthesized CQDs was dispersed in 50 ml DI water and after that the prepared solution was stirred for 30 minute in darkness for adsorption-desorption equilibrium. At the end half of the prepared solution was located under UV irradiation and another half were located under a solar simulator system for different time durations. Figure 7 (a) shows the corresponding relative changes versus illumination time. As it is seen in Fig. 7 (a), the photodegradation process under UV illumination was much superior to sun illumination. Also CQDs had better photodegradation with MB than MO and RB.

Figure 7 (b) shows the logarithmic change of relative concentration of samples with different illumination time, and the inset picture of Fig. 7 (b) shows the dye degradation percentage of samples. To better understanding about photodegradation of CQDs with organic dyes, the kinetic law of degradation process of catalyst was calculated by using the following formula [58–60].
In this formula, C is the MB, MO, and RB concentration at a particular time, C0 is the initial MB, MO, and RB concentration, k is the pseudo-linear first-order kinetic constant (min− 1) and t is the reaction time in min.
The obtained results showed that degradation rate of MB by CQDs under UV illumination is bigger than other samples and results are tabulated in table 1. Actually, different reactive species such as electrons (e), holes (h) and hydroxyl (OH) radicals are present during the photodegradation process. The photodegradation process will decrease with the presence of the corresponding scavenger of the reactive species which has a main role in the degradation process. The scavengers that are used in this work are hydrogen peroxide (H2O2) for electrons [61], sodium iodide (NaI) for OH ads and dimethyl sulfoxide (DMSO) for OH bulk [62], and ethylenediaminetetraacetic acid (EDTA) for holes [63]. The obtained results from radical scavengers are show in Fig. 7 (c). The obtained results show, the solution of MB dye in the absence of catalyst under UV irradiation had no degradation. Addition of H2O2 to the photodegradation process decreased the degradation process dramatically while addition of NaI DMSO, and EDTA hadn’t any considerable influence on photodegradation process and it means electrons have a main role in photodegradation of MB by CQDs.
In this work, CQDs were synthesized by a simple and rapid hydrothermal method using pistachio as precursor. TEM images showed that synthesized CQDs are spherical. Zeta potential analyze showed that CQDs have negative charge in their surface and confirm an excellent stability for CQDs. G/D ratio of Raman peaks was obtained about 3.54 which is the highest value that reported yet. PL intensity of CQDs in presence of Co2+ ions decreased systematically which means CQDs can be use as Co2+ sensors. The obtained results showed that CQDs have a good photodegradation with organic dyes such as MB, MO, and RB. Based on our experimental results electrons have a main role in photodegradation of MB by CQDs.
Author Contribution
All authors contributed to the study conception and design. Material preparation, data collection and analysis were performed by Farzad Farahmandzadeh, Mehdi Molaei, Hassan Alehdaghi, and Mohammad Khanzadeh. The first draft of the manuscript was written by Farzad Farahmandzadeh. All authors read and approved the final manuscript.
Conflicts of interest/Competing interests
The authors declare they have no competing interests.
Ethics Declaration statement
This work was done in the nanoscience lab of the Vali-e-Asr University of Rafsanjan, Iran, this article is original, this article has been written by the stated authors who are ALL aware of its content and approve its submission. This article has not been published previously.
Consent to Participate
This article has been written by the stated authors who are ALL aware of its content and approve its submission.
Consent to publication
This study doesn’t contain any data from an individual person.
Funding
No funding
Availability of data and material/ Data availability
All data of this paper are available and included in the manuscript.
- Souri D, Khezripour AR, Molaei M, Karimipour M (2017) ZnSe and copper-doped ZnSe nanocrystals (NCs): optical absorbance and precise determination of energy band gap beside their exact optical transition type and Urbach energy. Curr Appl Phys 17(1):41–46
- Farahmandzadeh F, Molaei M, Alehdaghi H, Karimipour M, Shamsi A (2022) "Effect of concentration and shell thickness on the optical behavior of aqueous CdTe/ZnSe core/shell quantum dots (QDs) exposed to ionizing radiation." Luminescence
- He Y, Lu H-T, Sai Li‐Man, Yuan‐Yuan Su, Chun‐Hai MH (2008) Wei Huang, and Lian‐Hui Wang. "Microwave synthesis of water‐dispersed CdTe/CdS/ZnS core‐shell‐shell quantum dots with excellent photostability and biocompatibility. Adv Mater 20(18):3416–3421
- Alehdaghi H, Assar E, Azadegan B, Baedi J (2020) Investigation of optical and structural properties of aqueous CdS quantum dots under gamma irradiation. Radiat Phys Chem 166:108476
- Farahmandzadeh F, Molaei M, Alehdaghi H, Karimipour M, Shamsi A (2022) "Effect of concentration and shell thickness on the optical behavior of aqueous CdTe/ZnSe core/shell quantum dots (QDs) exposed to ionizing radiation." Luminescence
- Farahmandzadeh F, Molaei M, Karimipour M, Shamsi AR (2020) Highly luminescence CdTe/ZnSe core–shell QDs; synthesis by a simple low temperature approach. J Mater Sci: Mater Electron 31(15):12382–12388
- Molaei M, Karimimaskon F, Lotfiani A, Samadpour M, Liu H (2013) Synthesis of ZnS: Ni nanocrystals (NCs) using a rapid microwave activated method and investigation of the structural and optical properties. J Lumin 143:649–652
- Wang, Youfu, Aiguo, Hu (2014) Carbon quantum dots: synthesis, properties and applications. J Mater Chem C 2(34):6921–6939
- Liu H, Li Z, Sun Y, Xin G, Yalei Hu, Meng H, Ge J, Lingbo Qu (2018) Synthesis of luminescent carbon dots with ultrahigh quantum yield and inherent folate receptor-positive cancer cell targetability. Sci Rep 8(1):1–8
- Guo Y, Zhang L, Zhang S, Yang Y, Chen X, Zhang M (2015) Fluorescent carbon nanoparticles for the fluorescent detection of metal ions. Biosens Bioelectron 63:61–71
- Lim S, Ying W, Shen, Gao Z (2015) Carbon quantum dots and their applications. Chem Soc Rev 44(1):362–381
- Li X, Rui M, Song J, Shen Z, Zeng H (2015) Carbon and graphene quantum dots for optoelectronic and energy devices: a review. Adv Funct Mater 25(31):4929–4947
- Baptista FR, Belhout SA, Giordani S, Quinn SJ (2015) Recent developments in carbon nanomaterial sensors. Chem Soc Rev 44:4433–4453
- da Silva, Joaquim CG, Esteves, Helena MRG (2011) Analytical and bioanalytical applications of carbon dots. TRAC Trends Anal Chem 30(8):1327–1336
- Li H, Kang Z, Liu Y, Lee S-T (2012) Carbon nanodots: synthesis, properties and applications. J Mater Chem 22:24230–24253
- Zirak M, Moyen E, Alehdaghi H, Kanwat A, Choi W-C (2019) "Anion-and cation-codoped all-inorganic blue-emitting perovskite quantum dots for light-emitting diodes. ACS Appl Nano Mater 2(9):5655–5662
- Ehtesabi H, Hallaji Z, Nobar SN, Zeinab Bagheri (2020) Carbon dots with pH-responsive fluorescence: A review on synthesis and cell biological applications. Microchim Acta 187(2):1–18
- Tajik S, Dourandish Z, Zhang K, Beitollahi H, Van Le Q, Jang HW, Mohammadreza Shokouhimehr (2020) Carbon and graphene quantum dots: A review on syntheses, characterization, biological and sensing applications for neurotransmitter determination. RSC Adv 10(26):15406–15429
- Duran N, Simoes MB, Moraes A, Favaro WJ, Amedea B (2016) Seabra. "Nanobiotechnology of carbon dots: a review. J Biomed Nanotechnol 12(7):1323–1347
- He Z, Cheng J, Ouyang WYanWLongH, Xin Hu, Zhou MLiuN, Zhang X, Wei Y (2021) One-step preparation of green tea ash derived and polymer functionalized carbon quantum dots via the thiol-ene click chemistry. Inorg Chem Commun 130:108743
- Zhao Y, Zhang Y, Liu X, Kong H, Wang Y, Qin G, Cao P et al (2017) "Novel carbon quantum dots from egg yolk oil and their haemostatic effects." Scientific reports 7, no. 1 : 1–8
- Yang X, Zhuo Y, Zhu S, Luo Y, Feng Y, Dou Y (2014) "Novel and green synthesis of high-fluorescent carbon dots originated from honey for sensing and imaging". Biosens Bioelectron 60:292–298
- Liu Y, Zhao Y, Zhang Y (2014) One-step green synthesized fluorescent carbon nanodots from bamboo leaves for copper (II) ion detection. Sens Actuators B 196:647–652
- Meiling TT, Piotr J, Cywiński (2016) and Ilko Bald. "White carbon: Fluorescent carbon nanoparticles with tunable quantum yield in a reproducible green synthesis." Scientific reports 6, no. 1 : 1–9
- Zhu C, Zhai J, Dong S (2012) "Bifunctional fluorescent carbon nanodots: green synthesis via soy milk and application as metal-free electrocatalysts for oxygen reduction." Chemical communications 48, no. 75 : 9367–9369
- Liu X, Pang J, Xu F, Zhang X (2016) "Simple approach to synthesize amino-functionalized carbon dots by carbonization of chitosan." Scientific reports 6, no. 1 : 1–8
- Hoan B, Thi PD, Tam, Vuong-Hung Pham (2019) "Green synthesis of highly luminescent carbon quantum dots from lemon juice."Journal of Nanotechnology2019
- Zirak M, Alehdaghi H, Shakoori AM (2021) Preparation of ZnO-carbon quantum dot composite thin films with superhydrophilic surface. Mater Technol 36(2):72–80
- Zhang Y, Zhu Jing-YuXYuan, Tian L-J, Wang W-K, Zhu T-T, Li W-W, Han-Qing Yu (2020) Fluorescence sensor based on biosynthetic CdSe/CdS quantum dots and liposome carrier signal amplification for mercury detection. Anal Chem 92(5):3990–3997
- Li P, Sam FY, Li (2021) "Recent advances in fluorescence probes based on carbon dots for sensing and speciation of heavy metals." Nanophotonics 10, no. 2 : 877–908
- De Acha N, Elosúa C, Corres JM, Francisco J (2019) Arregui. "Fluorescent sensors for the detection of heavy metal ions in aqueous media." Sensors 19, no. 3 : 599
- Kini S, Ganiga V, Kulkarni SD, Chidangil S, Sajan D, George (2018) "Sensitive detection of mercury using the fluorescence resonance energy transfer between CdTe/CdS quantum dots and Rhodamine 6G". J Nanopart Res 20(9):1–13
- Saikia D, Dutta P, Sarma NS, Nirab C, Adhikary (2016) CdTe/ZnS core/shell quantum dot-based ultrasensitive PET sensor for selective detection of Hg (II) in aqueous media. Sens Actuators B 230:149–156
- Zhu J, Zhao Z-J, Li J-J, Jun-Wu Z (2017) CdTe quantum dot-based fluorescent probes for selective detection of Hg (II): The effect of particle size. Spectrochim Acta Part A Mol Biomol Spectrosc 177:140–146
- Zou L, Gu Z, Sun M (2015) Review of the application of quantum dots in the heavy-metal detection. Toxicol Environ Chem 97:3–4
- Farahmandzadeh F, Molaei M, Karimipour M (2022) Ultrafast synthesis of CdTe/ZnSe semiconductor QDs by microwave method and investigation of structural, optical, and photocatalytic properties of CdTe/ZnSe QDs. J Mater Sci: Mater Electron 33(1):95–104
- Molaei M, Farahmandzadeh F, Mousavi TS, Karimipour M (2021) "Photochemical synthesis, investigation of optical properties and photocatalytic activity of CdTe/CdSe core/shell quantum dots."Materials Technology:1–7
- Mohammadi M, Roknabadi MR, Behdani M, Kompany A (2019) Enhancement of visible and UV light photocatalytic activity of rGO-TiO2 nanocomposites: The effect of TiO2/Graphene oxide weight ratio. Ceram Int 45(10):12625–12634
- Nguyen DC, Tien K-Y, Cho, Won-Chun Oh (2017) Synthesis of frost-like CuO combined graphene-TiO2 by self-assembly method and its high photocatalytic performance. Appl Surf Sci 412:252–261
- Gupta V, Kumar R, Saravanan S, Agarwal F, Gracia MM, Khan J, Qin, Mangalaraja RV (2017) Degradation of azo dyes under different wavelengths of UV light with chitosan-SnO2 nanocomposites. J Mol Liq 232:423–430
- Ramanan V, Thiyagarajan SK, Raji K, Suresh R, Sekar R, Ramamurthy P (2016) Outright green synthesis of fluorescent carbon dots from eutrophic algal blooms for in vitro imaging. ACS Sustain Chem Eng 4(9):4724–4731
- Dager A, Uchida T, Maekawa T, Tachibana M (2019) "Synthesis and characterization of mono-disperse carbon quantum dots from fennel seeds: photoluminescence analysis using machine learning." Scientific reports 9, no. 1 : 1–12
- Chen Q-L, Ji W-Q, Chen Su (2016) "Direct synthesis of multicolor fluorescent hollow carbon spheres encapsulating enriched carbon dots." Scientific reports 6, no. 1 : 1–8
- Liu X, Pang J, Xu F, Zhang X (2016) "Simple approach to synthesize amino-functionalized carbon dots by carbonization of chitosan." Scientific reports 6, no. 1 : 1–8
- Chen G, Wu S, Hui L, Zhao Y, Ye J, Tan Z, Zeng W, Tao Z (2016) Lihua Yang, and Yanwu Zhu. "Assembling carbon quantum dots to a layered carbon for high-density supercapacitor electrodes." Scientific reports 6, no. 1 : 1–9
- Dager A, Baliyan A, Kurosu S, Maekawa T, Tachibana M (2020) "Ultrafast synthesis of carbon quantum dots from fenugreek seeds using microwave plasma enhanced decomposition: application of C-QDs to grow fluorescent protein crystals." Scientific reports 10, no. 1 : 1–15
- Nejadshafiee V (2020) "Intelligent-activated carbon prepared from pistachio shells precursor for effective adsorption of heavy metals from industrial waste of copper mine. Environ Sci Pollut Res 27(2):1625–1639
- Mecozzi M, Pietroletti M, Scarpiniti M, Acquistucci R, and Marcelo Enrique Conti (2012). "Monitoring of marine mucilage formation in Italian seas investigated by infrared spectroscopyindependent component analysis." Environmental monitoringassessment 184, no. 10 : 6025–6036
- Vongsvivut J, Heraud P, Zhang W, Kralovec JA, McNaughton D, Colin J (2012) Barrow. "Quantitative determination of fatty acid compositions in micro-encapsulated fish-oil supplements using Fourier transform infrared (FTIR) spectroscopy." Food chemistry 135, no. 2 : 603–609
- Muthuselvi, Chandran AS, Pr, Sabapathy S (2017) "Growth and Characterization of 4-Carboxyanilinium Dihydrogen Phosphate Semi-Organic Complex Crystal". Asian J Appl Sci 10:159–169
- Khan I, Ullah W, Dubey, Gupta V (2017) Preponderance of Bioactive Medicinal Compounds and ATR-FTIR Spectroscopy of Coriander and Mustard Floral Honey from Apis mellifera. Indonesian J Chem 17(3):376–384
- Wei L, Ma F, Du C (2021) "Application of FTIR-PAS in rapid assessment of rice quality under climate change conditions." Foods 10, no. 1 : 159
- Walter M, Brzozowski B (2021) and Marek Adamczak. "Effect of Supercritical Extract from Black Poplar and Basket Willow on the Quality of Natural and Probiotic Drinkable Yogurt." Animals 11, no. 10 : 2997
- Shaikh AF, Mohaseen S, Tamboli, Rajendra H, Patil A, Bhan JD, Ambekar, Bharat B (2019) Kale. "Bioinspired carbon quantum dots: an antibiofilm agents. J Nanosci Nanotechnol 19(4):2339–2345
- Vasimalai N, Vilas-Boas V, Gallo J (2018) María de Fátima Cerqueira, Mario Menéndez-Miranda, José Manuel Costa-Fernández, Lorena Diéguez, Begoña Espiña, and María Teresa Fernández-Argüelles. "Green synthesis of fluorescent carbon dots from spices for in vitro imaging and tumour cell growth inhibition. Beilstein J Nanotechnol 9(1):530–544
- Arivarasan A, Sasikala G, Jayavel R (2014) In situ synthesis of CdTe: CdS quantum dot nanocomposites for photovoltaic applications. Mater Sci Semiconduct Process 25:238–243
- Hasan Md, Tanvir R, Gonzalez-Rodriguez C, Ryan N, Faerber JL, Coffer, Anton V (2018) Naumov. "Photo‐and electroluminescence from nitrogen‐doped and nitrogen–sulfur codoped graphene quantum dots. Adv Funct Mater 28(42):1804337
- Liu, Li M, Yue J, Lu J, Hu Y, Liang, Cui W (2018) "The enrichment of photo-catalysis via self-assembly perylenetetracarboxylic acid diimide polymer nanostructures incorporating TiO2 nano-particles". Appl Surf Sci 456:645–656
- Farahmandzadeh F, Molaei M (2022) "CdSe/CdS/ZnS core/multi-shell QDs: new microwave synthesis and applications for dye photodegradations."Journal of Coordination Chemistry:1–11
- Kim S-R, Ali I, Jong-Oh K (2019) Phenol degradation using an anodized graphene-doped TiO2 nanotube composite under visible light. Appl Surf Sci 477:71–78
- Zyoud A, Zu’bi A, Muath HS, Helal DaeHoon, Park G, Campet, Hikmat S (2015) Hilal. "Optimizing photo-mineralization of aqueous methyl orange by nano-ZnO catalyst under simulated natural conditions. J Environ health Sci Eng 13(1):1–10
- Talukdar S, Raj Kumar Dutta (2016) "A mechanistic approach for superoxide radicals and singlet oxygen mediated enhanced photocatalytic dye degradation by selenium doped ZnS nanoparticles." RSC advances 6, no. 2 : 928–936
- Liu, Li M, Yue J, Lu J, Hu Y, Liang, Cui W (2018) "The enrichment of photo-catalysis via self-assembly perylenetetracarboxylic acid diimide polymer nanostructures incorporating TiO2 nano-particles". Appl Surf Sci 456:645–656
Table 1 is available in the Supplementary Files section.
No competing interests reported.