3.1 Structural stability of collagen on the four faces of cellulose
The (100) face is hydrophobic and the surface is unable to form significant hydrogen bonds with other molecules due to the orientation of cellulose hydroxyl groups. The (110), (1-10) faces and the (010) face are hydrophilic with abundant hydrogen bond interaction sites [45]. Though the hydrophobicity of each face was distinctive, the collagens were all adsorbed on the surfaces of cellulose. As shown in Fig. 2b-e, the surfaces of cellulose still maintain the significant features of crystal faces with insignificant structural disturbances. No obvious structural changes are observed except that the overall structures of collagen are slightly bent at the end of the simulation.
The RMSD of collagen backbone was calculated to quantitatively measure the change of collagen structure during the simulation. RMSD values of collagen on different cellulose crystal faces are kept between 0.2 nm-0.3 nm as shown in Fig. 3a-d. The profiles of RMSD exhibit very small fluctuation during the whole process. RMSD values in this range indicate that the protein structures remain stable during the adsorption process. Furthermore, RMSF was calculated to evaluate the free movement degree of each residue in collagen molecules. As shown in Fig. 3e-h, the profiles of RMSF has good accordance with each other regardless of the properties of different cellulose faces. Each chain of the collagen model is composed of 29 residues and the peak of the line represents the end of each chain, which indicates that the two ends of the polypeptide chain are more flexible and the structure of other residues located in the middle of collagen is stable. The overall structures of collagen are not damaged during the process of adsorption on different crystal faces of cellulose.
To analyze the structural changes of collagen in the process of adsorption in more detail, the Ramachandran plot [46] was employed to characterize the changes in the secondary structure of proteins. Collagen is a coil, but one with distinct tertiary and quaternary structures: three separate polypeptides, called α chains are supertwisted about each other. The superhelical twisting is right-handed in collagen, opposite in sense to the left-handed helix of the α chains. Thus, it is ambiguous to evaluate the secondary structure of collagen by designating the structure helix, sheet, or coil. Therefore, Ramachandran plots were employed. The collagen helix is a unique secondary structure with Phi=-51°and Psi =+153°, which is quite distinct from the α helix [47]. As shown in Fig. 4, Ramachandran plots of the last frames extracted from the three MD simulations display similar characteristics and most of Phi and Psi values are confined within the region corresponding to the structure of collagen. It is found by comparison that the Phi and Psi angles of collagen not significantly deviated (Fig. 4a-d) from the specified collagen conformation values during the adsorption of collagen in different crystal faces of cellulose. Therefore, it is indicated that all models exhibit partial structural interruption but are not damaged during adsorption.
To further investigate the effects of cellulose on the global structure of collagen, free energy contour maps were constructed with RMSD and Rg as reaction coordinates. As shown in Fig. 5, the free energy contour values of each model are located in a similar region with only one global minimum, which indicates that the effects of different crystal face on collagen structures are too weak to induce obvious changes. All the global minima of the 12 MD simulations are restricted within narrow ranges with RMSD about 0.23 nm and Rg about 0.42 nm, which further validates the intactness of collagen on the surface of cellulose. The conformational space of collagen on the surface of cellulose provided information about the structural state of collagen in cellulose/collagen composites.
3.2 Interactions between collagen and celluloses during adsorption
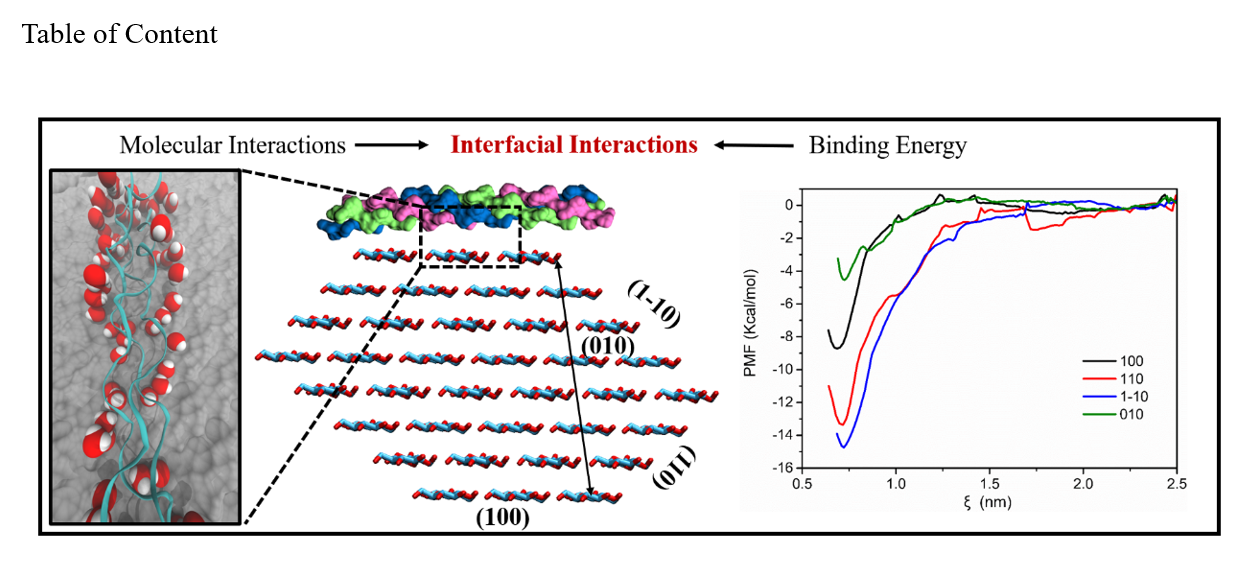
To understand the adsorption of collagen onto cellulose, umbrella sampling simulations were performed for all the four faces. Prior to the umbrella sampling simulations, the centers of all the cellulose models move to original points. As shown in Fig. 6, the lowest PMF values are found near the layer surface for all the systems, indicating that collagen tends to bind to cellulose. PMF shows that free energies are close for faces (110) and (1-10) with values of -15.5 kcal/mol and -14.8 kcal/mol respectively, which imply almost the same adsorption strength of collagen onto the (110) and (1-10) surface. Free energy of (100) (-9.5 kcal/mol) is a little higher than those of (110) and (1-10) faces, indicating that the affinity between (100) layer and collagen is weaker. In contrast with PMF profiles of (110), (1-10), and (100), the binding energy of (010) is the largest (-5.2 kcal/mol). These free energies derived from umbrella samplings indicate that collagen tends to migrate toward all the faces of cellulose. In particular, (110) and (1-10) faces displaying the strongest affinity to collagen.
To characterize the binding process of collagen on cellulose, we calculated the number of collagen heavy atoms that are within 0.5 nm to the four crystal faces over time. As depicted in Fig. 7a, the contact profiles of the three (100) replicas show commendable consistency with no significant changes after 200 ns. Similarly, two stages of contact numbers are also observed (Fig. 7g) when collagen binds to (010) face: an initial stage with contact numbers ranging from 0 to about 180 (0-100 ns) and a stable final stage with contact number fluctuating around 180. As for (110) and (1-10) face, the profile of contact numbers varies but all the collagens form stable binding with cellulose after 250 ns. In general, collagen adsorbed onto cellulose spontaneously and form stable combination with cellulose. Due to the structural anisotropy of cellulose, the four faces exhibit different values of contact numbers in the last stages.
In order to further clarify the molecular mechanism underlying the difference of binding energy, the distributions of contact numbers have been calculated. As shown in Fig. 7b, d, f and h, compared with (100), (110) and (1-10), the (010) face display the minimum contact number with the peaks corresponding to about 180. The profiles of contact numbers belonging to (110) and (1-10) faces are similar but move to the right in contrast with that of (010) face, which indicate more intimate contact with cellulose. (100) face exhibit the largest contact number among the four faces. The origin of this this phenomenon can be attributed to the topography of cellulose crystal faces. The (010) surface is saw-toothed (Fig. 8d), while the (100) surface is almost flat (Fig. 8a), and the (010) surface is expected to have a roughness much higher than the other three surfaces. (110) and (1-10) faces exhibit nearly identical roughness (Fig. 8b, c), which is consistent with the similar distributions of contact numbers. Though previous studies showed that the (010) plane had the highest contact surface area [48, 49], the volume of collagen is much larger than these of polylactic acid and oleic acid, which hinders the binding of collagen onto (010) face with a half of the hydroxyl grouping shielded. Furthermore, the side chains of Pro and Gly are rigid and fail to penetrate into the groves in (010) face (Fig. 8d).
There are highly prominent hydroxyl groups at the (010), (110) and (1-10) surfaces, and the three hydroxyl groups on the pyranose ring are located at the equatorial position of the ring. Therefore, (010), (110) and (1-10) have significant hydrophilic properties and polarity. The (100) surface corresponds to the axial direction of the pyranose ring with hydrophobic C-H groups exposed to the surrounding medium and exhibits non-polarity. In the view of the large amount of hydroxyl groups and the polarity of Gly in collagen, electrostatic interactions may play an important role at the interface, particularly through hydrogen bonding. The number of hydrogen bonds between collagen and cellulose have been calculated. It has been found that even though there are a large number of hydroxyl groups in the surface of cellulose, few hydrogen bonds formed between cellulose and collagen are observed (Fig. 9). In terms of (010) face, one hydrogen bond occupancy is lower than 12% while two hydrogen bond occupancy is lower than 0.5%. (110) and (1-10) faces display similar tendency to form hydrogen bonds with collagen and form less than 8% and 6% one hydrogen bond occupancy, respectively. (100) face display the least hydrogen bond among all the faces with occupancy less than 3%. Hydrogen bonding interactions between cellulose and collagen are limited due to steric hindrance. The sidechains of proline contact with the surface of cellulose, which hinders the interactions between backbone of collagen and cellulose. The results of hydrogen bonds interactions are different from the previous researches, which suggest that there are lots of hydrogen bonds so that they enhance the composite of cellulose and collagen [50, 51]. The difference in hydrogen bonding interactions may attribute to the distinctive primary structures of collagen and the abundance of hydroxyproline provide more sites to form hydrogen bonds.
It was interesting to note that the polar (110) and (1-10) faces formed hydrogen bonding linker with collagen participated by water molecules. As shown in Fig. 10c, water molecules between collagen and cellulose form hydrogen bonds with backbone carbonyl oxygen and hydroxyl group at the same time, connecting (110) face and collagen. The similar phenomenon has also been observed in the interface between (1-10) face and collagen with 3 water molecules involved in the network of hydrogen bonds. However, there is no hydrogen bonding linker observed in (100) and collagen. As shown in Fig. 10a, due to its hydrophobicity, few water molecules accumulate between collagen and (100) face, which prohibit the indirect connection through hydrogen bonding. It is intriguing to find that there is no hydrogen bond network connecting collagen and (010) face though the (010) face is hydrophilic. As shown in Fig. 10b, water molecules accumulate in the interface between (010) and collagen and most of water molecules are stuck in the deep groves. The steric confinement caused by the limited volumes of the groves restricts the freedom of water molecules and prohibits the formation of hydrogen bonds which require suitable distance and orientation.
In general, the polar (110) and (1-10) surfaces had the strongest affinity with collagen. Although there was a minimum number of hydroxyl groups on the (100) surface, the interaction of the surface C-H moiety with collagen can achieve a larger van der Waals interactions with the smoothest surface. The (010) face exhibits the weakest interactions with collagen. The affinity can be attributed to the cellulose surface structure and the corresponding contribution of indirect hydrogen bonding interactions. Direct hydrogen bonding interaction is not significantly contributive to the affinity. Selecting proper collagen with more hydroxyproline may promote hydrogen bonding interactions. Furthermore, surface modification to increase the polarity of cellulose may also be feasible to enhance the interactions between cellulose and collagen, which has been validated by previous study [52]. Adding crosslinking agent playing similar roles to water molecules is also a possible strategy to improve the property of cellulose/collagen composite.