A total of 124 adult patients were included during the acute phase of the illness (Fig. 1). Of those, 3 patients were later confirmed to be PCR-negative for COVID-19, 23 patients died before follow-up and 36 patients did not consent to follow-up and were therefore excluded. One patient was excluded because of pre-existing severe neurological disease. In addition, 2 patients had incomplete follow-up questionnaires and 2 patients had incomplete biomarker analysis. This left 57 patients available for MFI-20, and one additional missing MoCA left 56 patients for cognitive dysfunction analysis.
The follow-up group is largely representative for the whole cohort at admission (Table 1). The majority was male, 77%, with an average BMI of 30 ± 6 kg/m² and age of 61 ± 14 years. Average COVID-19 day of admission was 11 ± 4 days with a Simplified acute physiology score 3 (SAPS3) of 53 ± 10. At admission the majority of patients were fully awake, but a few were sedated at admission due to acute intubation in the emergency department. The most common comorbidities were hypertension, diabetes mellitus type 2, and pulmonary disease. In the follow-up group there are generally fewer patients with comorbidities except for pulmonary disease. A small number of patients had previous neurological disease, 6 patients (5%) in total and 1 patient (1.8%) in the follow-up group. The whole cohort had a total of 16 patients (13%) with psychiatric disease. In the follow up group 3 patients (5%) had psychiatric disease.
Table 1
Patient demographic characteristics and comorbidities in critically ill COVID-19 patients. Overview of all included patients and the follow-up group. In the follow-up group there are generally fewer comorbidities except for pulmonary disease. Otherwise, the follow-up group was largely representative for the whole cohort at admission. Variables are presented as average (standard deviation) or as number (percentage of total). BMI = Body mass index. ICU = Intensive care unit. SAPS3 = Simplified acute physiology score 3.
| |
All
|
Follow-up
|
|
N
|
121
|
57
|
|
Women
|
28 (23%)
|
14 (25%)
|
|
Age (years)
|
61 (14)
|
60 (13)
|
|
BMI (kg/m²)
|
30 (6)
|
30 (6)
|
|
COVID-19 day on ICU admission
|
11 (4)
|
11 (4)
|
|
SAPS3
|
53 (10)
|
51 (9)
|
|
Temperature at admission (C)
|
38 (1)
|
38 (1)
|
|
Breathing rate at admission
|
30 (9)
|
30 (9)
|
|
Vasoactive treatment
|
7 (6%)
|
2 (4%)
|
|
Sedated at admission
|
4 (3%)
|
0 (0%)
|
|
Hypertension
|
64 (53%)
|
26 (46%)
|
|
Heart failure
|
5 (4%)
|
0 (0%)
|
|
Ischemic heart disease
|
13 (11%)
|
2 (4%)
|
|
Diabetes mellitus
|
33 (27%)
|
10 (18%)
|
|
Neurological disease
|
6 (5%)
|
1 (1.8%)
|
|
Psychiatric disease
|
16 (13%)
|
3 (5%)
|
|
Pulmonary disease
|
33 (27%)
|
15 (26%)
|
The follow-up group was largely representative for the whole cohort at discharge regarding complications during the ICU stay such as thrombotic events, delirium and critical illness polyneuropathy/critical illness myopathy (Table 2). 14 patients (12%) in total and 6 (11%) of the follow-up patients had a thrombotic event, and 14 patients (12%) of the total and 6 (11%) of follow-up patients developed CIN/CIM. The median length of ICU stay for the whole cohort was 8 (5–16) days. Roughly half of the patients were subjected to invasive ventilation and vasoactive treatment, lasting 2 (0–9) days and 2 (0–7) days respectively in the whole cohort and in the follow-up group 0 (0–6) days and 1 (0–8) days.
Table 2
Discharge parameters for critically ill COVID-19 patients. Overview of all included patients and the 3–6 months follow-up group. The follow-up group was largely representative for the whole cohort at discharge regarding complications during the ICU stay such as thrombotic events, delirium and critical illness polyneuropathy/critical illness myopathy. Roughly equally many patients were subjected to invasive ventilation and vasoactive treatment. Variables are presented as average (standard deviation), number (percentage of total) or as median (interquartil range). ICU = Intensive care unit.
| |
All
|
Follow-up
|
|
N
|
121
|
57
|
|
Length of ICU stay in days
|
8 (5–16)
|
9 (5–15)
|
|
Alive at follow-up
|
98 (81%)
|
57 (100%)
|
|
Thrombotic event
1. Myocardial infarction
2. Pulmonary embolism
3. Stroke
4. Deep vein thrombosis
|
14 (12%)
2 (1.7%)
10 (8%)
4 (3%)
1 (0.8%)
|
6 (11%)
1 (1.8%)
4 (7%)
2 (4%)
1 (1.8%)
|
|
Critical illness polyneuropathy/
critical illness myopathy
|
14 (12%)
|
6 (11%)
|
|
Delirium
|
10 (8%)
|
6 (11%)
|
|
Days with vasoactive treatment
|
2 (0–7)
|
0 (0–6)
|
|
Number of patients with vasoactive treatment
|
68 (56%)
|
28 (49%)
|
|
Days with ventilation
|
2 (0–9)
|
1 (0–8)
|
|
Number of patients with mechanical ventilation
|
67 (55%)
|
31 (54%)
|
CNS biomarker data
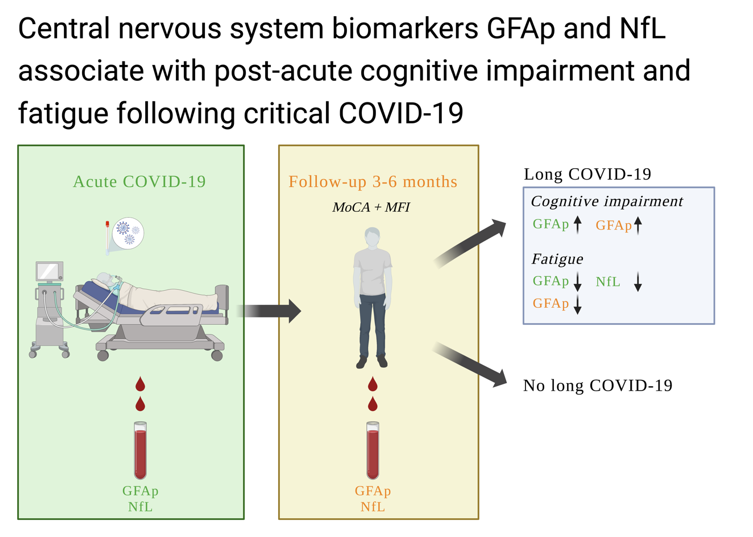
The dataset includes 57 patients with plasma samples of the three CNS biomarkers NfL, t-tau and GFAp, analyzed during acute COVID-19 at the ICU and 3–6 months after discharge (Table 3).
Table 3
CNS biomarker concentration for 57 critically ill COVID-19 patients in the ICU and at follow-up at 3–6 months after discharge. GFAp and NfL decreases over time whereas t-tau increases. Variables are presented as median (interquartile range). CNS = Central nervous system. ICU = intensive care unit. GFAp = Glial fibrillary acidic protein. NfL = Neurofilament light chain. T-tau = total tau.
| |
N = 57
|
N = 57
|
|
CNS biomarker concentration
|
ICU
|
3–6 months after ICU
|
|
GFAp (pg/ml)
|
110 (56–165)
|
60 (36–110)
|
|
NfL (pg/ml)
|
31 (18–101)
|
14 (9–20)
|
|
T-tau (pg/ml)
|
1.5 (0.8–3.4)
|
2.4 (1.7–3.3)
|
Fatigue and cognitive function results
A total of 57 patients filled out the MFI-questionnaire and a total of 56 patients filled out the MoCA-questionnaire. A total of 24 patients had mild cognitive impairment with scores within the range 18–25 p. One patient had moderate cognitive impairment with a score within the range 10–17 p. No patients had severe cognitive impairment. 23 patients received 1 p for having 12 or less years of education (Table 4).
Table 4
Results of the MFI-20 subscales and MoCA 3–6 months after discharge from the ICU in 57 critically ill COVID-19 patients. MFI-20 results are divided in the subscales general fatigue, physical fatigue, mental fatigue, reduced motivational and reduced activity. The cutoff value means worse than a normal population 95th percentile calculation based on gender and age. MoCA score lower than 26 indicates at least mild cognitive dysfunction. One patient had an incomplete MoCA-questionnaire therefor are the values based on 56 patients for the MoCA. Scores presented as mean (standard deviation) and cutoff presented as an absolute number (percent of total). MFI = Multidimensional Fatigue inventory. MOCA = Montreal Cognitive Assessment. ICU = Intensive care unit.
| |
Mean score
|
Worse than cutoff
|
|
MFI general fatigue
|
14 (5)
|
26 (46%)
|
|
MFI physical fatigue
|
13 (5)
|
20 (35%)
|
|
MFI mental fatigue
|
11 (5)
|
15 (26%)
|
|
MFI reduced motivation
|
10 (4)
|
10 (18%)
|
|
MFI reduced activity
|
13 (5)
|
19 (33%)
|
|
MoCA
|
26 (3)
|
25 (45%)
|
CNS biomarkers association to age
All biomarkers showed correlations with patient age, NfL (p < 0.001, R2 = 0.10), t-tau (p-value = 0.005, R2 = 0.06) but the effect was by far the strongest for GFAp (p < 0.001, R2 = 0.36) (Fig. 2). This was taken into account in the ANOVA as described above.
CNS biomarkers association to fatigue
The concentration of the glial biomarker GFAp was higher during acute COVID-19 and showed significant effects for age, higher with increasing age and gender, higher in women. GFAp was lower in those with fatigue, both in the ICU and at follow-up for general fatigue (p = 0.009), physical fatigue (p = 0.004), mental fatigue (p = 0.001), and reduced motivation (p < 0.001) (Fig. 3 och Fig. 4). In addition, the effect was more pronounced in women, except for mental fatigue where it was more pronounced in men.
The concentration of the axonal biomarker NfL was higher during the acute illness compared to follow-up when it decreased (p < 0.001). It did not show a strong relation to fatigue in the dimensions general fatigue, physical fatigue, mental fatigue, or reduced activity, other than for patients experiencing reduced motivation when the biomarker actually is lower at follow-up (p = 0.004) (Fig. 5).
The neuronal biomarker t-tau concentration was higher at follow-up compared to acute critical COVID-19 but show large variation (p = 0.008). There was no association to level of fatigue in any dimension, general, physical, mental, motivation or activity (Fig. 6).
CNS biomarkers association to cognitive impairment
The glial biomarker GFAp concentration was higher in patients with at least mild cognitive dysfunction at follow-up (p = 0.01), and as before was higher during acute COVID-19 and increased with age and was higher in women (Fig. 7).
NfL levels was not associated with cognitive dysfunction. There was however an association with age as shown above (p < 0.001).
The neuronal biomarker t-tau concentration was higher at follow-up (p = 0.01), but the differences were minor. High levels of t-tau were not associated with cognitive dysfunction.