Phantom Study
Phantom acquisition and reconstruction
An anthropomorphic phantom, Kyoto Kagaku PBU-60 (Kyoto Kagaku Co., Kyoto, Japan), was assembled according to the instruction manual, and placed in the head-first position. The phantom was scanned in two dose levels, which were consistence with the clinical acquisition protocols for ULDCT and SDCT.
The CT images were reconstructed with AIIR and HIR with the convolution kernel (level 5), B-Soft-B (United Imaging Healthcare, China) for ULDCT: ULDCT-HIRphantom and ULDCT-AIIRphantom, and SDCT-HIRphantom as control.
Phantom Data Analysis
Ten ROIs were draw on CT images at the white matter, grey matter, CSF, thoracic vertebra, heart, air in the lung, liver, kidney, muscle, and femur of the anthropomorphic phantom. The image signal (CTmean) and image noise (CTsd) of the ROIs were statistically assessed. The SNR and CNR were calculated for each ROI to compare the image quality for each group defined as follows:\(SNR= \frac{{CT}_{mean, ROI}}{{CTsd}_{, ROI}}\) [17], \(CNR= \frac{{CT}_{mean,ROI}-{CT}_{mean, Ref}}{({CT}_{sd,ROI}+{CT}_{sd,Ref})/2}\) [18] with muscle as reference.
Clinical Study
Study Population
This retrospective study was approved by the Institutional Review Board of Zhongshan Hospital, Fudan University and written informed consent was signed for the use of the data from all the subjects. 52 patients (mean age 59.48 ± 13.62; 29 male, range 41–86 years; 23 female, range 21–86 years) were randomly enrolled in this study from October to November 2021 (Table 1). The exclusion criteria included: no uptake of FDG in the primary lesions, blood glucose level > 11.0 mmol/L, an FDG uptake time of more than 70 min, and the images severely affected by the motion artifact.
Table 1
Demographics of patients who underwent total-body PET/CT with AIIR reconstructions.
| Characteristic | Value |
| Age (year, range) | 59.48 ± 13.62 (21–86) | |
| Sex | | |
| Male (%) | 29 (55.8%) | |
| Female (%) | 23 (44.2%) | |
| BMI | 23.37 ± 2.74 (18.01–30.26) | |
| Blood glucose (mmol/L) | 5.90 ± 1.22 (3.4–10.4) | |
| Injected activity (MBq/kg) | 120.17 ± 16.53 (76.22-157.99) | |
| Location of primary tumors | | |
| Head and neck | 2 (3.85%) | |
| thorax | 16 (30.77%) | |
| Abdomen and pelvic | 33 (63.46%) | |
| Lower limb | 1 (1.92%) | |
Image Acquisition
The examinations were performed on the total-body PET/CT scanner, uEXPLORER (United Imaging Healthcare), equipped with a 128-slice CT. The patient lied in supine position and underwent CT scout for the correction of the positioning, then followed by an ACCT for the PET attenuation correction which was used as ULDCT in this study. After the acquisition of the PET data, the range of SDCT for anatomical location was scanned from the top of the skull to the middle femur. The scanning protocol of the total-body ULDCT was set at the tube voltage of 120 kV, tube current of 10 mAs, gantry rotation time of 0.5 s, beam pitch of 1.0125, slice thickness of 1.0mm, field of view of 500 mm. The acquisition protocol of SDCT was tube voltage 120 kV, auto modulation tube current with reference 120 mAs, gantry rotation time 0.5 s, beam pitch 0.9875, slice thickness 1.0mm, field of view 500 mm.
Image Reconstruction
The ULDCT images were reconstructed with AIIR and HIR using the convolution kernel (B-Soft-B, United Imaging Healthcare), expressed as: ULDCT-AIIR and ULDCT-HIR. The SDCT images were reconstructed by HIR with convolution kernel and served as reference, noted as SDCT-HIR. PET reconstructions were performed using the OSEM algorithm with the following parameters: TOF and PSF modelling, 3 iterations, and 20 subsets, matrix of 192 × 192, slice thickness of 1.443 mm, and a full width at half maximum of the Gaussian filter function of 3 mm. The attenuation of PET images was corrected by the ULDCT-AIIR and ULDCT-HIR respectively (expressed as PET-AIIR and PET-HIR).
Subjective Image Analysis
Two nuclear medicine physicians with 5 and 7 years of experience were blinded to the dose and reconstruction methods, and viewed the images using standard window settings. The images were graded on the scale of 1–5 in the aspect of the image noise, conspicuity of anatomical structures, and diagnostic confidence for all the images from each subgroup. The conspicuity of anatomical structures includes the visualization of the brain, neck, thorax, abdomen, pelvic and lower limb. The subjective score was evaluated according [19]. 1: non-diagnostic, unacceptable quality. impossible to detect important anatomic structures (clearly evaluate their margin or internal characteristics) due to high noise or severe artifacts. 2: poor image quality. possible to detect crucial anatomic structures (difficult to clearly evaluate their margin or internal characteristics) with distinctly increased noise or considerable artifacts. 3: acceptable image quality. depiction of the anatomic structures (margin or internal characteristics can be detected) with noticeable noise or some distinct artifacts, may obscure very subtle details. 4: good image quality. depiction of all anatomic structures (easier to evaluate their margin or internal characteristics) with slightly increased noise, above average image quality with the noise and artifacts not affecting diagnostic value. 5: excellent image quality. depiction of all anatomic structures with fine details (significantly easier to evaluate their margin or internal characteristics, without any indistinct findings), free of artifacts and with imperceptible noise.
Objective Image Analysis
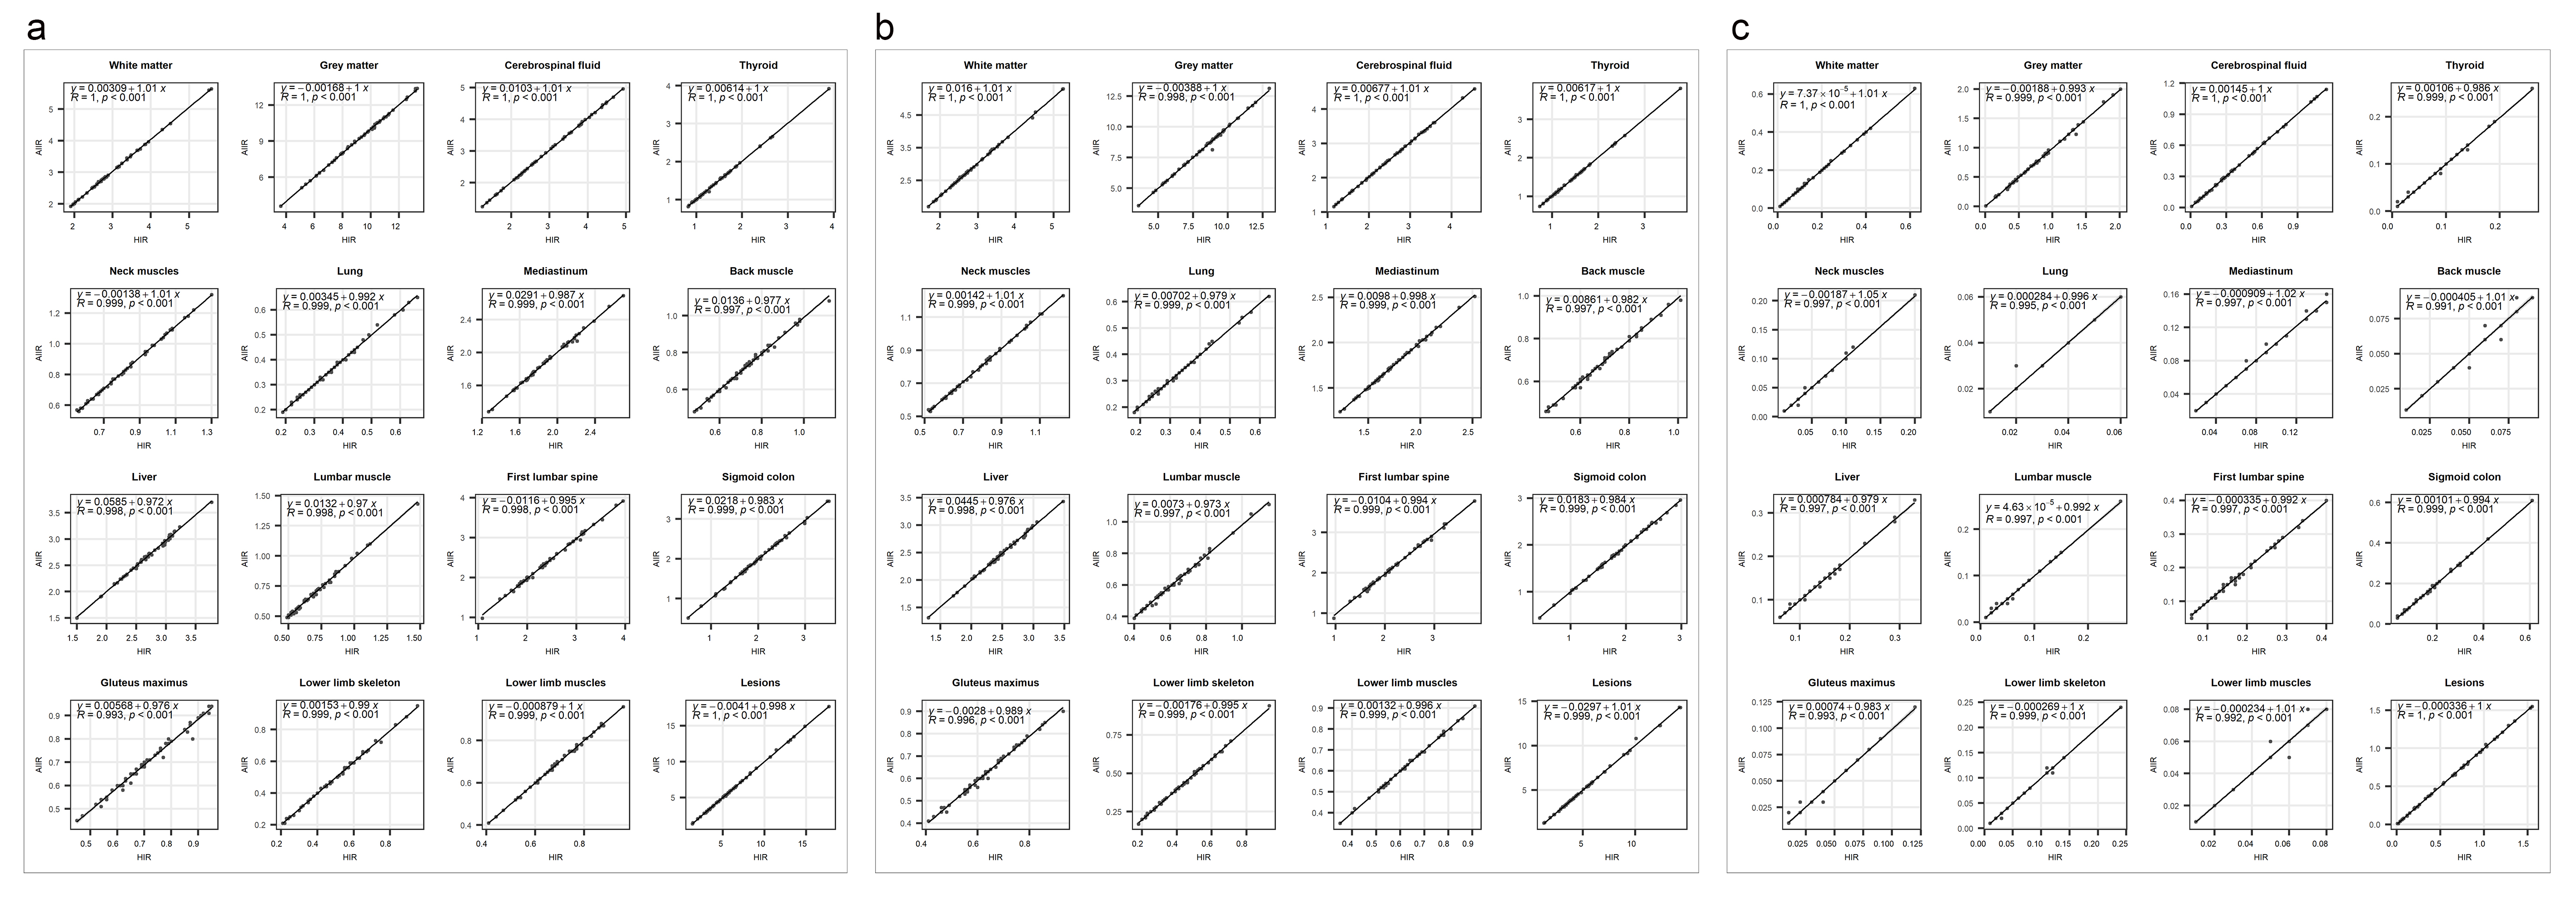
For all three groups in the clinical study, three ROIs were drawn at the brain, including white matter, grey matter, CSF; two ROIs at the neck, including thyroid, neck muscles; three ROIs were drawn on the thorax, including lung, mediastinum, back muscle; five were drawn at the abdomen, including liver, lumbar muscle, first lumbar spine, sigmoid colon, gluteus maximus; two were in the lower limb, including muscles, lower limb bone; the primary lesion was also delineated from each patient. Objective image quality for the CT images was also assessed with the CTmean, CTsd, SNR and CNR. The muscles were considered as reference in each section of the body for the calculation of CNR. The SUVmax, SUVmean and its standard deviation (SUVsd) were measured for PET images. TBR was calculated as follow: \(TBR= \frac{{SUV}_{max, lesion}}{{SUV}_{mean, liver}}\).
Statistical Analysis
Statistical analysis was conducted using R software version 4.1.2 (R Core Team) and GraphPad Prism 6.0 (GraphPad Software Inc.). The results of objective assessment were expressed as mean \(\pm\) SD. The significance of difference in the objective evaluation between each subgroup was measured by the Wilcoxon signed rank with Bonferroni correction to minimize the possibility of significance brought by multiple statistical testing. A p value < 0.05 was considered statistically significant. The inter-observer agreement was analyzed by the Cohen’s kappa test where the k value in the range of 0.00 to 0.20 indicated poor agreement; k value in the range of 0.21–0.40 indicated fair agreement; k value in the range of 0.41–0.60 indicated moderate agreement; k value in the range of 0.61–0.80 indicated good agreement, k value in the range of 0.81-1.00 indicated excellent agreement. Pearson correlation coefficient (r) was used to measure the linear relationship between the SUVmax, SUVmean and SUVsd of PET-HIR and PET-AIIR. The r between 0.8-1.0 indicated very strong linear relationship.