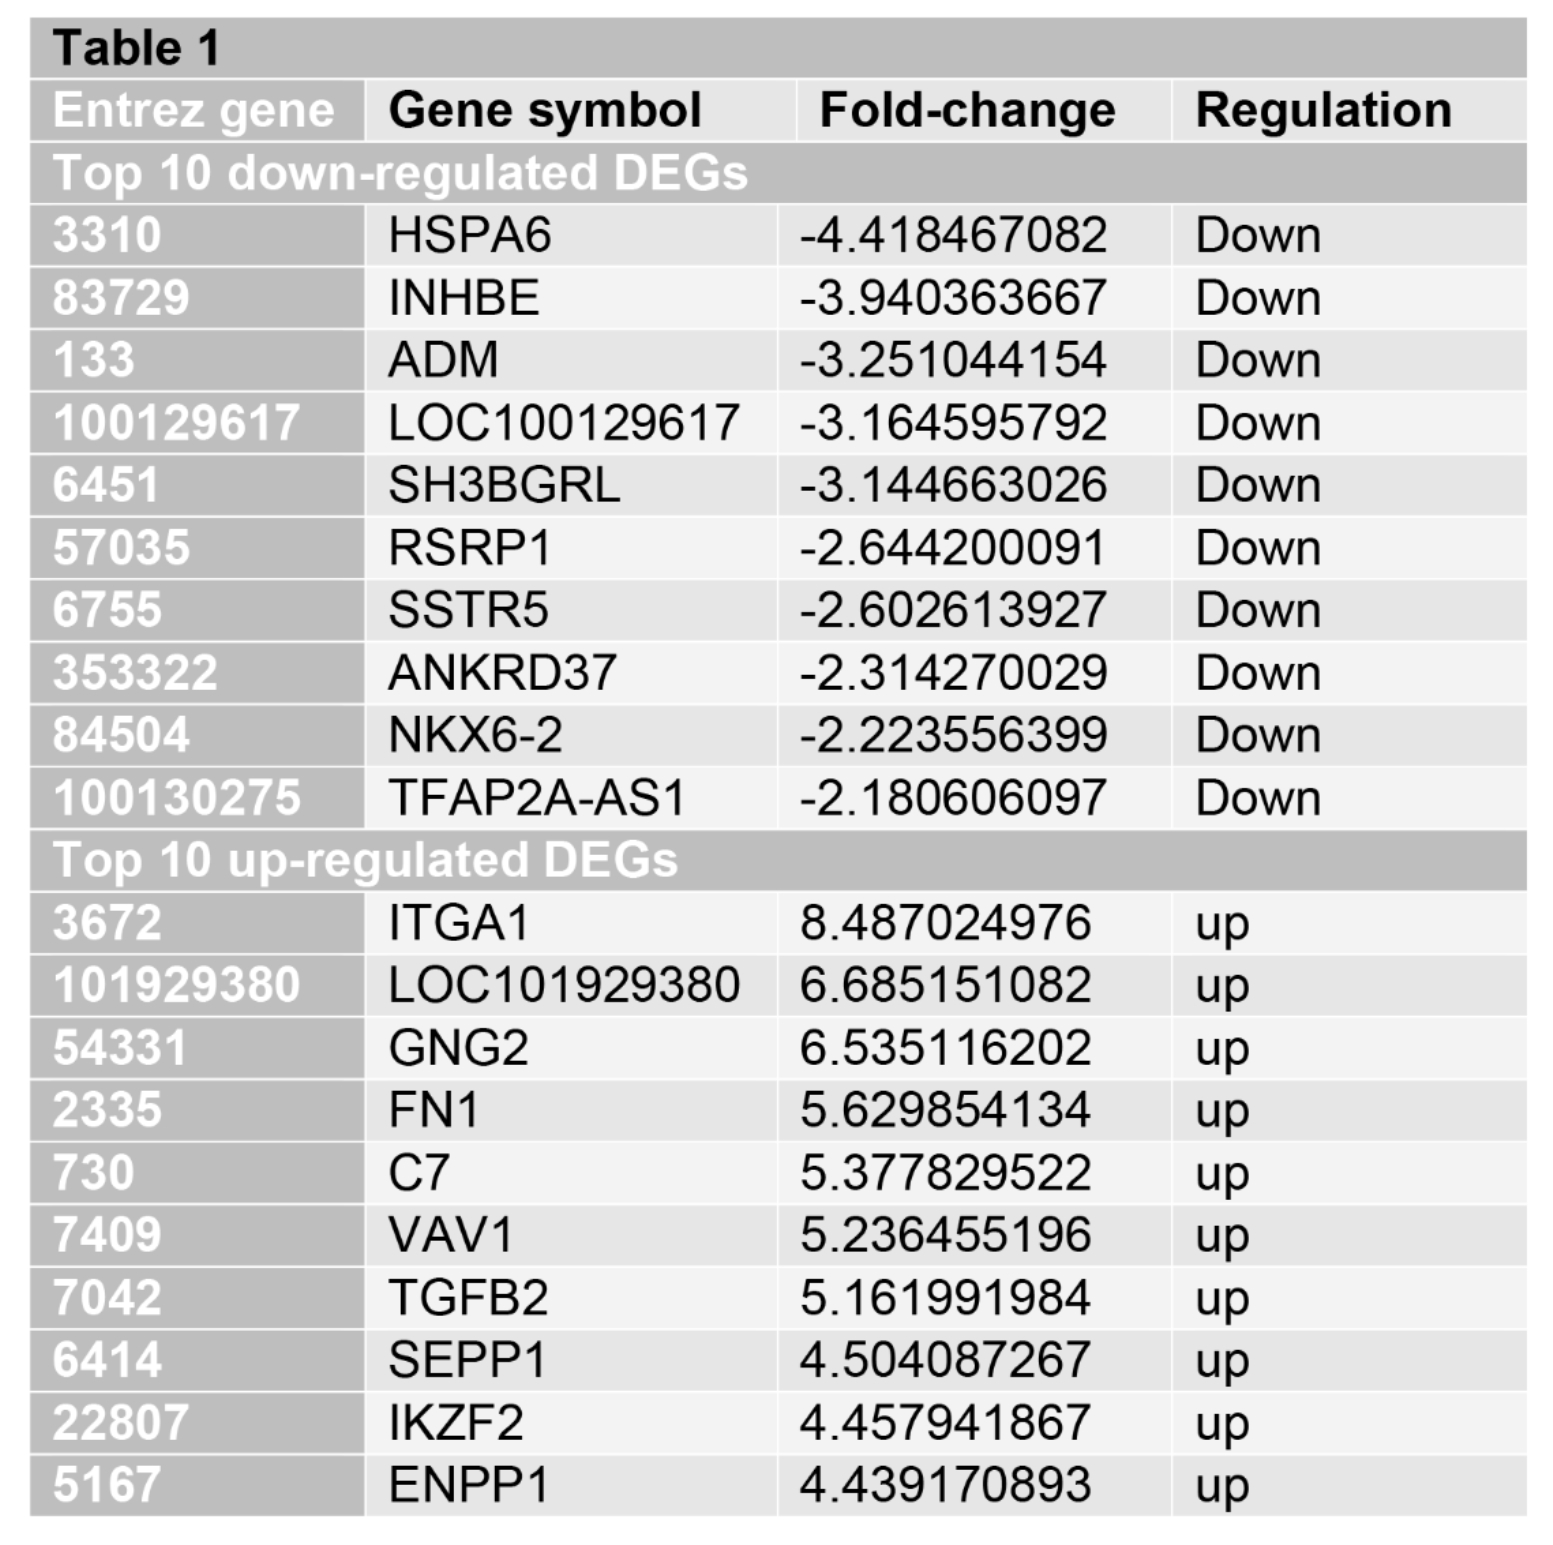
DEGs in PDAC cells treated with LDHA inhibitor
To make sure the functions of LDHA inhibitor on PDAC, we used the RNA-seq data from the GEO database (GSE164976). We identified the 664 significantly changed genes (P < 0.01). The top increased and decreased genes were also indicated by the heatmap (Figure 1). We further presented the top ten significant genes in Table 1.
Gene enrichment and function analyses in PDAC cells treated with LDHA inhibitor
To learn more about the features of significant genes, we performed the gene enrichment analysis (Figure 2). We identified the top 10 changed KEGG items (P < 0.05), including “TNF signaling pathway”, “Cellular senescence”, “Toxoplasmosis”, “Small cell lung cancer”, “Apoptosis”, “AGE−RAGE signaling pathway in diabetic complications”, “NF−kappa B signaling pathway”, “Chronic myeloid leukemia”, “Legionellosis”, “Fructose and mannose metabolism”. We then identified the top 10 Biological Processes (BP of GO, P < 0.05), including “reproductive system development”, “reproductive structure development”, “regulation of mitotic cell cycle”, “myeloid cell differentiation”, “regulation of hemopoiesis”, “response to insulin”, “intracellular receptor signaling pathway”, “regulation of myeloid cell differentiation”, “negative regulation of viral entry into host cell”, and “cell junction disassembly”. We figured out the top 10 cellular components (CC of GO, P < 0.05), including “cell leading edge”, “dendritic spine”, “neuron spine”, “ruffle”, “phosphatidylinositol 3−kinase complex”, “glial cell projection”, “dystrophin−associated glycoprotein complex”, “glycoprotein complex”, “CMG complex”, and “autolysosome”. We also figured out the top ten molecular functions (MF of GO, P < 0.05), including “ubiquitin−like protein ligase binding”, “ubiquitin protein ligase binding”, “growth factor activity”, “phosphoprotein binding”, “collagen binding”, “misfolded protein binding”, “FAD binding”, “protein folding chaperone”, “insulin−like growth factor receptor binding”, and “1−phosphatidylinositol−3−kinase regulator activity”.
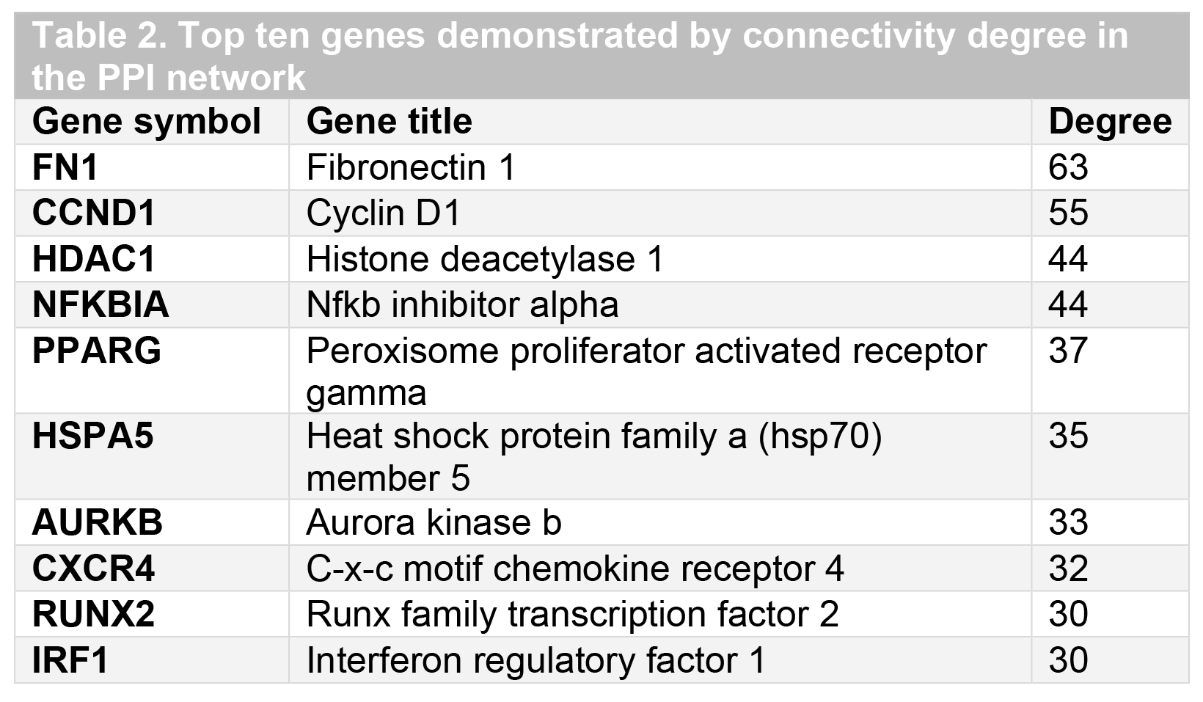
The protein-protein interaction (PPI) network and Reactome analyses
We constructed the PPI network by using 643 nodes and 1898 edges with the Cytoscape software (combined score > 0.2). The top ten genes with the highest degree scores were presented in Table 2. By analyzing the PPI network, we further constructed the top two clusters in Figure 3. Finally, we constructed the Reactome map by using the PPI network and DEGs (Figure 4) and we performed the Reactome analysis to further identify the top ten Reactome biological processes, including “Attenuation phase”, “HSF1-dependent transactivation”, “HSF1 activation”, “Regulation of HSF1-mediated heat shock response”, “Cellular response to heat stress”, “Cytokine Signaling in Immune system”, “Interleukin-4 and Interleukin-13 signaling”, “Interleukin-7 signaling”, “Interferon alpha/beta signaling”, and “Circadian Clock” (Supplemental Table S1).