Patients
During the study period, 843 patients with rectal cancer were identified. After applying the exclusion criteria, 107 patients with endoscopically obstructing tumours remained. Of these, an additional 49 patients were excluded for being deemed as palliative (n = 32) and for receiving an emergency stoma (n = 17), respectively, shortly after diagnosis. Another patient was excluded for being diagnosed after an accidental finding of rectal cancer following surgery. In the end, 57 patients remained for analysis, as depicted by the study flowchart (Fig. 1). Out of these 57 patients, 12 received a planned defunctioning stoma before any treatment (planned stoma group); these stomas comprised five ileostomies, one transverse colostomy, and six sigmoidostomies. The remaining 45 patients received upfront neoadjuvant therapy or surgery (control group).
There were twice as many men than women in the planned stoma group, whereas the control group had a relatively even gender distribution. The ASA grade was similar between the two groups, with slightly more grade I patients in the planned stoma group and grade II patients in the control group. Moreover, the types of scopes used were also comparable across the groups. All 12 patients in the planned stoma group were intended for neoadjuvant therapy (although only 11 ultimately received this treatment), while a large minority of patients in the control group received upfront surgery. As for tumour stage, the planned stoma group had more advanced tumours overall; stage II tumours in the control group were almost as common as stage IV tumours in the planned stoma group. Seven patients, four (33.3%) in the planned stoma group and three (6.7%) in the control group, later progressed to a palliative state due to tumour progression. One of these seven patients received a non-curative resection, and one did not receive any curative treatment at all. For demographic and clinical details, see Table 1.
Table 1
Demographic and clinical details for 57 patients with an endoscopically obstructing rectal cancer, stratified by a planned pretreatment stoma
| |
No stoma (n = 45)
|
Stoma (n = 12)
|
|
Categorical variables
|
N (%)
|
N (%)
|
|
Sex
|
|
|
|
Male
|
21 (46.7)
|
8 (66.7)
|
|
Female
|
24 (53.3)
|
4 (33.3)
|
|
ASA fitness grade
|
|
|
|
I
|
3 (6.7)
|
3 (25.0)
|
|
II
|
27 (60.0)
|
3 (25.0)
|
|
III-IV
|
10 (22.2)
|
2 (16.7)
|
|
Missing
|
5 (11.1)
|
4 (33.3)
|
|
Year of diagnosis
|
|
|
|
2007–2013
|
30 (66.7)
|
10 (83.3)
|
|
2014–2020
|
15 (33.3)
|
2 (16.7)
|
|
Scope type used*
|
|
|
|
Colonoscope
|
34 (75.6)
|
9 (75.0)
|
|
Ultrathin colonoscope
|
2 (4.4)
|
0 (0.0)
|
|
Rigid sigmoidoscope
|
6 (13.3)
|
2 (16.7)
|
|
Gastroscope
|
3 (6.7)
|
1 (8.3)
|
|
Clinical tumour stage (TNM)
|
|
|
|
I
|
2 (4.4)
|
0 (0.0)
|
|
II
|
18 (40.0)
|
2 (16.7)
|
|
III
|
8 (17.8)
|
4 (33.3)
|
|
IV
|
15 (33.3)
|
5 (41.7)
|
|
Missing
|
2 (4.4)
|
1 (8.3)
|
|
Neoadjuvant therapy
|
|
|
|
None
|
18 (40.0)
|
1 (8.3)
|
|
Radiotherapy
|
17 (37.8)
|
2 (16.7)
|
|
Chemoradiotherapy
|
10 (22.2)**
|
9 (75.0)
|
|
Type of resectional surgery
|
|
|
|
Anterior resection
|
26 (57.8)
|
3 (25.0)
|
|
Abdominoperineal excision
|
9 (20.0)
|
4 (33.3)
|
|
Hartmann’s procedure
|
7 (15.6)
|
2 (16.7)
|
|
No resection
|
3 (6.7)
|
3 (25.0)
|
|
Perioperative complications during resection
|
|
|
|
No
|
34 (75.6)
|
8 (66.7)
|
|
Yes
|
11 (24.4)
|
4 (33.3)
|
|
Continuous variables
|
Median (IQR)
|
Median (IQR)
|
|
Age (years)
|
69 (62–79)
|
67.5 (52.5–71)
|
|
Tumour height (cm)
|
11 (8–13)
|
9 (8–11)
|
| ASA = American Society of Anaesthesiologists; TNM = Tumour-node-metastasis staging system; IQR = Interquartile range |
| *If several different types of scopes were used, only the thinnest scope was considered |
| **One of these patients received chemotherapy only |
Time to treatment
Median time to any treatment, neoadjuvant therapy and resectional surgery, is shown in Table 2. The differences in time between the groups are further depicted by the Kaplan-Meier failure curves shown in Fig. 2, Fig. 3, and Fig. 4, respectively. All three curves show a significantly longer time-to-event for the planned stoma group (p = 0.0080, 0.0025, 0.0009, respectively). After assessment at the first multidisciplinary conference(s), 18 patients were planned for upfront surgery without any neoadjuvant treatment. These patients are excluded from the Kaplan-Meier failure curve shown in Fig. 3, depicting only patients planned for neoadjuvant therapy.
Table 2
Time to treatment for 57 patients with an endoscopically obstructing rectal cancer, stratified by a planned pretreatment stoma
|
Time to treatment (days)
|
|
No stoma (n = 45)
|
Stoma (n = 12)
|
| |
Events/patients
|
Median (95% CI)
|
Median (95% CI)
|
|
Any treatment
|
56/57
|
36 (33–39)
|
51 (39–72)
|
|
Neoadjuvant therapy
|
38/39
|
39 (33–42)
|
51 (39–72)
|
|
Resection
|
51/57
|
47 (38–56)
|
167 (143–NA)
|
| CI = confidence interval; NA = not available |
With Cox regression, the unadjusted hazard ratio (HR) was 0.30 with a 95% CI of 0.15–0.64. After adjustment for confounding, the adjusted HR was 0.28 (95% CI: 0.12–0.64), indicating an increased time to treatment in the planned stoma group.
Complications
A total of 12 patients with complications classified as grade II or above according to the extended Clavien-Dindo classification of surgical complications were found across all 57 patients. All 12 patients had complications classified as either grade II or IIIb; no patient had a grade IIIa, IV or V complication as their highest graded complication. In the planned stoma group, there were three patients (25.0%) with grade II complications and two patients (16.7%) with grade IIIb complications, resulting in a combined complication rate of 5/12 (41.7%). In the control group, the corresponding numbers of patients were four (8.9%) and three (6.7%), respectively, thus with a total complication rate of 7/45 (15.6%). However, the difference in complication rate was not statistically significant (p = 0.1036).
One patient in the planned stoma group with a grade IIIb complication needed reoperation due to bleeding following the stoma surgery, while the other patient developed an abscess and fistula in the tumour area that required surgical intervention. The former patient started neoadjuvant therapy in a relatively timely manner (43 days after diagnosis), whereas the latter took considerably longer than usual to start (126 days after diagnosis).
In the control group, one patient sustained a stroke that required urgent carotid endarterectomy, while the other two patients with grade IIIb complications suffered a bowel perforation following malignant large bowel obstruction. The patient who had a stroke took longer than usual to start neoadjuvant therapy (63 days after diagnosis). The perforations, however, did not occur until after the patients were already deemed as palliative, and no delay in neoadjuvant therapy was seen in these cases (38 and 14 days after diagnosis, respectively). One of these patients ultimately had a non-curative tumour resection, while the other received an ileostomy. Regarding perioperative complications during resectional surgery, these occurred at a similar rate between the groups (Table 1).
Survival
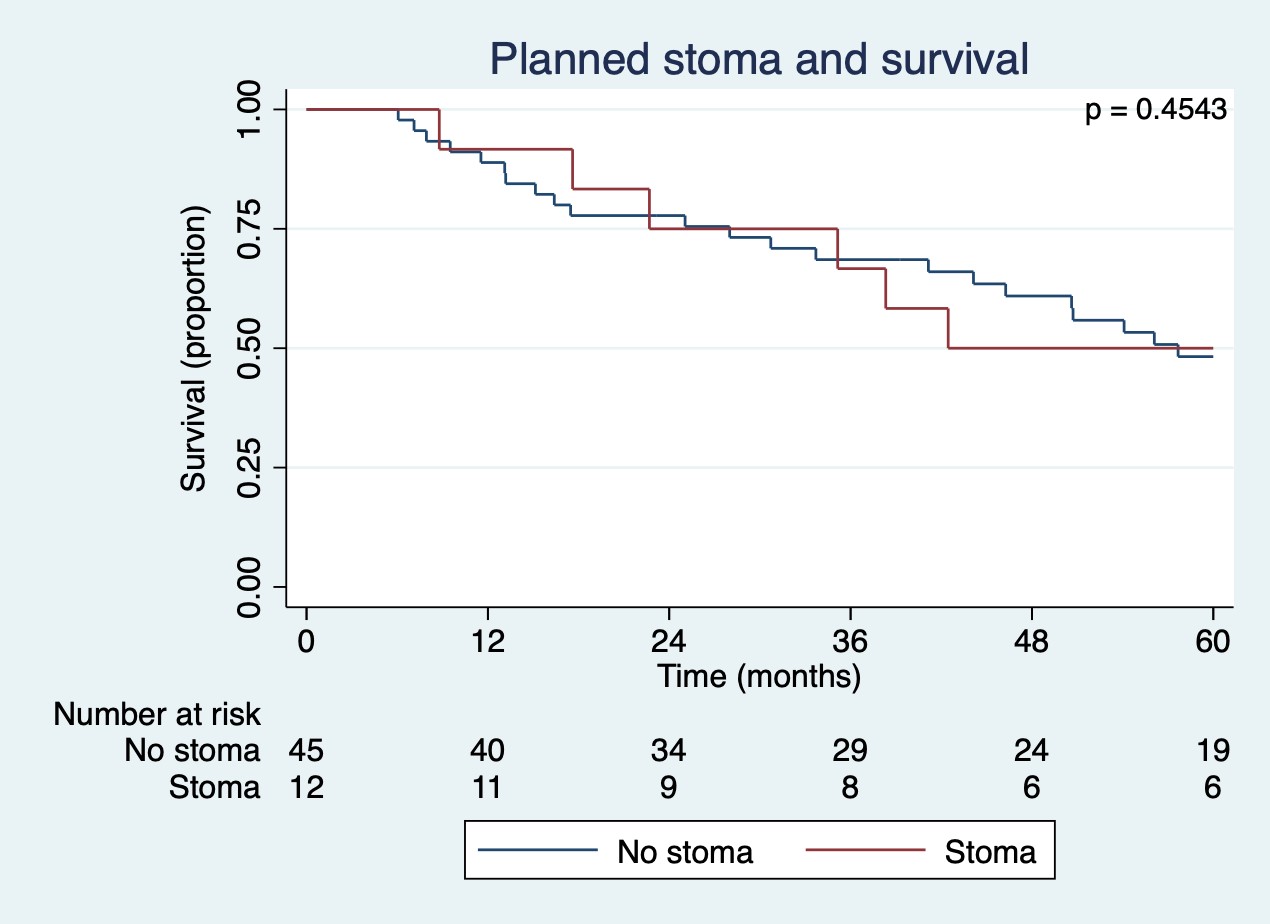
The median survival after diagnosis was 43 months (CI: 18–72) for the planned stoma group and 58 months (CI: 44–not estimable) for the control group. The survival difference between groups, however, was not significant (p = 0.4543). For details, see the Kaplan-Meier failure curve shown in Supp. Figure 1.