3.1. Characterization
3.1.1. Physical Characterization
All physio-chemical properties namely viscosity, calorific value, density, flash point, and fire point of different blends of Jatropha and Madhuca biodiesels are provide in the supplementary sheet. Figure 2 shows the variation of kinematic viscosity of biodiesel blends as a function of blend percentage. It is observed the kinematic viscosity increases linearly with the blending ratios of biodiesel both in JB and MB. This increase in kinematic viscosity arises due to lower density of diesel than biodiesel. Both JB and MB have showed similar linear behaviour. However, their slope and starting point is relatively different from other literature (Acharya et al. 2017, 2019; Jain and Sharma 2011; Raheman and Ghadge 2007; Rashed et al.2016; Shahabuddin et al. 2012). It may be stated that initial diesel viscosity would decide the rate of which other blends changes. The lower the viscosity greater is the linearity. Viscosity increases with increase in carbon chain length in biodiesel (Shahabuddin et al. 2012). The variation observed by Shahabuddin et al. (2012) is non-linear and is not similar with other literature studies (Fig. 2).
The calorific value of various biodiesel blends decreases linearly as a function of blending percentage (Fig. 3). The increase in biodiesel percentage in biodiesel-diesel blend reduces the calorific value due to lower calorific value of biodiesel than diesel. Both JB and MB have showed similar behaviour. However, their slope is different from other literature.
3.1.2. Raman Spectra
Figure 4a-b represents Raman spectra of all blending samples of JB and MB with diesel and pure diesel. All blends of JB) and MB show peak at around 2935 cm− 1, which corresponds to vCH2. The peak at around 1739 cm− 1represents vC=O band. The spectra band at 865 corresponds to ʋR−C=O and ʋR−C−O. The band at around 378 represents ᵟco−o−c. Both bands at 865 and 378 are due to the formation of ester (Ghesti et al. 2006). The different blends of JB and MB blends show peak at about 1725 cm− 1 and 1740 cm− 1. The spectra at 1725 cm− 1 and 1740 cm− 1represents C = O and C = C respectively. In almost all blends of JB and MB spectrum between 800–900 cm− 1 is present. It is due to C1-C2, C-O stretching and CH3 rocking (Miranda et al. 2014).
The peak around 1030–1090 cm− 1 is due to weak C-C stretching present in all biodiesel blends. The peak scissoring around 1240 cm− 1 and 1250 cm− 1, is seen in higher biodiesel blends and is due to = C-H bending. Again, CH2 bending is seen twisting between 1295 and 1300 cm− 1and also flapping between 1355 cm− 1 and 1385 cm− 1 in all JB and MB blends. The peaks around 1480–1500 cm− 1 indicates bending of CH2 and CH3.Again peak at 1650–1690 cm− 1 is due to C = C stretching. C = O stretching is also seen between 1740–1750 cm− 1 confirming biodiesel production. The vibration of C-H stretching is present at nearly 2800–3000 cm− 1. The peak at 3000–3050 is due to the stretching of olefinic = C-H as per the literature (Miranda et al. 2014).
3.1.3. Fourier transform infrared spectroscopy
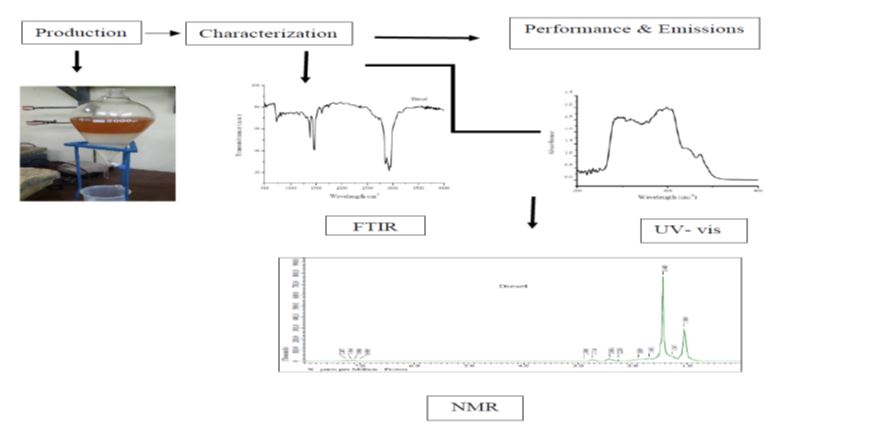
The FTIR spectra of pure diesel, JB and MB and their blends with diesel are depicted in Fig. 5a and 5b. The spectral pattern of diesel, all blends of JB with diesel (J5 to J100) and all blending samples of MB with diesel (M5 to M100) lies between the spectral ranges from 500 cm− 1 to 4000 cm− 1. FTIR spectral region from 1688–1810 cm− 1 is C = O, which determines methyl in biodiesel-diesel blends. The spectra area from 1700–1800 cm− 1 is owing to stretching of C = O. This peak is present in fatty acid methyl ester (FAME), J100, M100 and in all blends of JB and MB, which is ester. The absorption from 1300–1470 cm− 1 presents in all blends of JB and MB relates to bending of -CH3 asymmetric stretching.14 Fig. 5a-b depicts that OH spectra is absent in the absorption range from 3600 − 3500 cm− 1in diesel and in all blends of JB and MB, indicating the absence of residual alcohol or un-reacted methanol (Shah 2013). A peak present at all blends of MB and JB at 1743.65 cm− 1 shows the presence of strong ester carbonyl bond (C = O) signifying FAME or biodiesel. This is one of the major differences of biodiesel from diesel, where peak in the range of 1740–1755 cm− 1 is missing (Fig. 5a-b). Infrared spectrum from all samples of both JB and MB at 1745 cm− 1 depicts the triglyceride ester linkage. The aromatic hydrocarbon is present in the spectrum range from 722 cm− 1 to 1095 cm− 1, whereas spectrum ranging from 1175 to 1245 cm− 1 indicates C-O absorption (Chatterjee et al. 2015); absorption ranging from 1362–1373 cm-1 designates the CH3 group whereas the peak at 1458 cm− 1 is the bending absorption of CH2. Each sample spectrum ranging from 2800 cm− 1 to 3000 cm− 1 corresponds to C-H. The IR spectra of all blends of JB (J5-J100) and MB (M5-M100) show strong ester linkage at 1752.31 cm− 1. IR spectra of blends of JB (J10, J20, J40, J50, J85, J90, J95, J100) and blends of MB (M5, M15, M20, M50, M85, M90, M100) show strong ester peak (C-O vibrations) around 1173–1230 cm− 1. No interference was detected in the 1750 cm− 1 region, but diesel signals interfered in the region of 1170–1200 cm− 1.
The peaks at 2935 − 2931 cm− 1 in JB blends (J5-J20, J40, J50, J80-J100), MB blends (M5-M20, M40, M50, M80-M100) and in diesel is due to –C-H2 stretching; also, spectra ranging from 3100 cm− 1 until 2700 cm− 1 is absorption for C–H (Bardley 2007). The spectra of all JB and MB blends exhibited –C-H2 symmetric stretching at 2854 cm− 1. The absence of peak in spectra ranging from 3110 cm− 1 – 3500 cm− 1, in JB and MB indicates low water content. The absorption ranging from 964–1018 cm− 1 of all blends of JB and MB is due to –C = C- bending. The characteristics absorption spectra at 1242–1246 cm− 1 (J50-J100, M40-M80, M90-M100); 1195 cm− 1 (J40, J60-J85,100); and 1167 cm− 1(J5-J100, M5-M100) is due to –C-O-C- stretching as per previous literature (Berman et al. 2016).
The calibration model was plotted using Magic Plot Student and Origin 8.2 software. The linearity was determined at selected peak at 1745 cm− 1 using base points from 1800 cm− 1 to 1600 cm− 1. The peak height was correlated against half width half maximum (HMWM). The linearity over the selected peak at 1745cm− 1showed high co-efficient R2 = 0.9243 in case of JB and its blends (Fig. 6a) and R2 = 0.9184 in case of MB and its respective blends (Fig. 6b).
3.1.4. UV spectroscopic analysis
Figure 7a and 7b show the UV-vis spectra of MB and JB biodiesels. UV spectroscopy indicates the occurrence of conjugated dienes in pure diesel, JB and MB and their blends (J5 to J100 and M5 to M100) with diesel. In the present study all JB and MB blends with diesel were diluted with n-heptane to bring the absorbance to the measurable range of spectrophotometer. The dilution of JB and MB with aromatic compounds i.e., diesel resulted in decrease in absorbance wavelength. The mono and fully saturated FAAE in the UV region are not absorbed with linoleic acid methyl ester and with linolenic methyl ester, but poly-unsaturated samples are absorbed strongly having a unique characteristic spectrum (Chuck et al. 2010).
In blended percentages of JB and MB with diesel, no change was indicated in the characteristic shape of absorbance curve except in the magnitude of absorbance.
The double bonds unsaturated FAME would isomerize to form the more stable conjugated C = C-C = C or C = C-C = O in the degradation of blended biodiesel (Vega-Lizama et al.2015). The oxidative products possessing conjugated double bonds absorb energy both in visible and ultra-violet regions.
The decreasing absorption trend was observed in MB blends from 80M to 100M in the spectral band of 245–275 nm, where M100 has the lowest coefficient (Fig. 7b). The linearity of absorbance declines with the augmentation in biodiesel blending with biodiesel and diesel due to the decreased concentration of aromatic compounds (Fig. 8a-b). The linear line fitted for absorbance versus the different blended percentages of JB and MB biodiesels at 320 nm showed a high coefficient of determination (R2 = 0.906 and 0.963).
3.1.5. Nuclear Magnetic Resonance
1HNMR spectra of blending samples of JB (J5 to J100) with diesel and MB (M5 to M100) with diesel showed a characteristic singlet peak of methyl ester moiety at 3.6 ppm (Fig. 9a-b). The existence of the peaks has been observed in the spectrum of within 3.59–3.63 ppm in all biodiesel blends. This confirms the production of biodiesel. The decrease trend or absence of the peak at 4.00 ppm indicates the production of biodiesel i.e., assigned to hydrogen of glycerol moiety of Jatropha and Madhuca oil.
The presence of triplets in the blends of JB (J10, J15, J40, J80, J90) and MB (M5-M20, M40, M60, M80-M100) at 0.8 ppm is methyl hydrogen which makes them distinct from diesel.
In J100 and M100 spectra, peaks situated at 2.1, 2.78 and 5.33 ppm are allylic, bis-allylic and olefinic hydrogen, respectively. The NMR spectra of J100 and M100 showed peak at 1.3, 1.57 ppm and 1.57 ppm are methylene of carbon chain and from beta- carbonyl methylene. The peak at 2.27 ppm confirms the presence of carbonyl group of the ester moiety (Monteiro et al. 2015).
NMR spectrum of diesel showed a group of peaks at 0.8–2.8 ppm which is from aliphatic hydrogen and quite a few peaks at 6.79–7.25 range from aromatic hydrogen (Fig. 10a-b). Table 2 depicts the functional group of the JB and MB samples peaks in ppm of 1H NMR.
Table 2
Functional group and its respective ppm of the sample’s peaks in 1H NMR.
|
Sample’s where peaks are present
|
Functional Group
|
ppm
|
|
J10, J15, J40, J80, J90, M5-M20, M40, M60, M80-M100, Diesel
|
-CH2-CH3
|
0.84–0.90
|
|
J5-J100, M5-M100
|
-CH2-CH3
|
0.92–1.29
|
|
J15, J20, J90, J95, J100, M15, M100
|
-OCO-CH2-CH2
|
1.54–1.71
|
|
J5-J100, M5-M100
|
-CH2-C = C-
|
1.96–2.15
|
|
J100
|
-OCO-CH2
|
2.27
|
|
J5-J100, M15, M20, M40, M50
|
-OCO-CH2
|
2.10–2.52
|
|
J5-J90, J100
|
C = C-CH2-C = C
|
2.75–2.83
|
|
J5-J100, M5-M100
|
-COOCH3
|
3.59–3.68
|
|
M5-M100, J5-J100
|
-CH = CH-
|
5.24–5.42
|
13C NMR spectrum shows the presence of methoxy carbon at 51.20 ppm in JB and MB and its blends, confirming the conversion of Jatropha and Madhuca oils to methyl ester. The characteristics peak of carbonyl carbon at 173.92 is present in all blends of MB and JB. The peaks around 129.8 ppm present in all mixtures of JB and MB with diesel indicates olefinic carbon (unsaturation in methyl esters). The signal at 14.21 present in all blends is due to methyl carbon and peaks around 33 − 21 ppm are due to methylene carbon of long chain FAME. All these peaks are assigned as per literature (Tariq et al. 2011). Table 3 depicts the functional group of the JB and MB samples peaks in ppm of 13C NMR. The different blends of JB and MB 1H NMR and 13C NMR graphs are provided in supplementary sheet.
Table 3
Functional group and its respective ppm of the sample’s peaks in 13C NMR.
|
Sample’s where peaks are present
|
Functional Group
|
ppm
|
|
J5-J100, M5-M100
|
methoxy carbon
|
51.2
|
|
J5-J100, M5-M100
|
methylene and methyl carbons
|
33.98–14.21
|
|
J5-J100, M5-M100
|
olefinic carbon
|
129.8–128.03
|
|
J15-J100, M5-M100
|
carbonyl carbon
|
173.92
|
3.2 Engine Performance and Emission Characteristics
3.2.1. Brake specific fuel consumption
Figure 11a-b depicts the variation in BSFC with different loads (%) for Jatropha (JB) and Madhuca (MB) biodiesels. The BSFC of diesel and all JB and MB blends have a decreasing trend with increasing load and an increasing trend with the increase in the proportion of JB and MB in the fuel blends with diesel. The reason behind is percent increase in fuel required to operate engines, is less, as compared to percent increase in brake power, since less proportion of heat is lost at higher loads. Biodiesels having poor spray characteristics, and thus having differences in mixture formation, owing to their higher kinematic viscosity and density, as compared to diesel fuel. Thus, more biodiesel is required to produce the same torque.
The mean BSFC for the JB was higher than that of diesel by 1.65% (J5), 2.51% (J10), 3.45% (J15), 3.50% (J20), 17.5% (J40), 20.4% (J60), 29.01% (J80), and 36.5% (J100). Similarly, in MB mean BSFC with respect to diesel was higher by 4.62% (M5), 7.01% (M10), 8.86% (M15), 8.66% (M20), 13.5% (M40), 21.5% (M60),32.22(M80) and 37.2% (M100). Thus, the mean BSFC of JB is better than MB.
Higher biodiesel densities result in higher BSFC values. The densities of M100 and J100 was 3.5% and 4.1% respectively higher than diesel, indicating that consumption of the same fuel on volume basis resulted in 3.5% and 4.1% higher BSFC in case of M100 and J100, respectively. Blends of biodiesel with higher densities at same pressure injection create greater mass injection for the same volume (Raheman and Ghadge 2007).
3.2.2. Brake Thermal Efficiency
Figure 12a-b depicts the change in BTE as a function of load variation for compression ratio 17.5:1 for JB and MB. BTE decreases with increasing concentration of JB and MB blends. The increasing trend of efficiency was also seen for diesel as well as for JB and MB. The maximum BTE for JB and MB were 24.12% for J5 and 24.01% for M5 at full load (100%) as against 24.2% in diesel. The thermal efficiency for JB and MB blends were less than that of diesel. It is due to slow-burning rate, lower calorific values, poor volatility, and high viscosity. It was also observed that variations in BTE was less for various JB and MB blends at full load (100%) conditions than that of part load. It is because at higher load more amount of fuel gets burnt due to the increase in temperature (Dutta and Mandal 2018).
The average decrease in BTE for JB blends was 0.9% (J5), 1.59% (J10), 3.2% (J15), 16.8% (J20), 14.7% (J40), 16.8% (J60), 18.9% (J80), and 23.5% (J100) than diesel. Similar trend was also observed in MB.
3.2.3. Exhaust gas temperature
Figure 13a-b indicates EGT variations with load (%) for different JB, MB blends and diesel. EGT increases with an increase in load because more amount of fuel is needed to generate extra power to resist extra loading. The average increase in EGT for JB blends was 1.07% (J5), 1.29% (J10), 4.39% (J15), 6.42% (J20), 10.25% (J40), 14.93% (J60), 16.17% (J80), and 19.17% (J100) higher than diesel. Similarly, mean increase trend was also obtained in MB as 4.63% (M5), 5.82% (M10), 7.01% (M15), 13.55% (M20), 15.33% (M40), 15.9% (M60), 20.09% (M80), and 27.46% (M100). Thus, JB exhibits better EGT than MB. The higher concentration of biodiesel exhibits higher EGT due to more heat losses, and a higher CN.
The higher CN of the fuel displays lower ignition delay, thus resulting in a shorter premixed combustion period. At higher load (%), both J100 and J20 and diesel have comparable EGT. The mean difference between diesel and J20 was not much at 100% load, probably due to more injection of fuel, resulting in more heat losses.
3.2.4 Carbon Monoxide
CO emissions variation with respect to load for diesel, different blends of JB, MB is illustrated in Fig. 14a-b.CO decreases with an increase in JB and MB blends because higher biodiesel blends result in complete oxidation as against diesel. At the time of biodiesel combustion, the produced CO is perhaps converted to CO2 by taking a molecule of O2 from the biodiesel chain. CO initially decreases with full load initially and then again increases swiftly up to full load both in case of JB and MB along with their respective blends. At first in the low load condition, the cylinder temperature was low and later it increased swiftly with increase in load. It is because of more injection of fuel inside the cylinder. The cylinder was initially low in the low load condition, and subsequently, with increase in load, it increased swiftly, on account of the availability of more injection of fuel inside the cylinder. At a higher temperature, engine performance improves with comparative enhancement in the burning rate of fuel thus resulting in decreased CO.
Again, additional loading, requires more fuel leading to formation of smoke. It might prevent oxidation of CO into CO2 resulting in increment of CO emission. The average decrease in CO for JB blends were 6.66% (J5), 15% (J10), 16.6% (J15), 18.3% (J20), 21.6% (J40), 41.6% (J60), 51.6 % (J80), 68.3% (J100) lower than diesel. Similarly, mean decrease trend was also obtained in MB as 10% (M5), 11.6% (M10), 16.6% (M15), 16.6% (M20), 26.66% (M40), 26.66% (M60), 45% (M80), and 58.33% (M100). Thus, CO emissions was less in JB than MB.
3.2.5. Nitrous oxide (NOX)
Emission of NOx increases with increase in respective blends of JB and MB with diesel (Fig. 15a-b). It is due to increased EGT, and presence of O2 content in JB and MB resulting in NOx formation. At a lower temperature, atmospheric nitrogen exists as a stable diatomic molecule, with a small amount of NOX, but at a higher temperature, in the combustion chamber of an engine, some diatomic nitrogen breaks down to mono atomic nitrogen, which is reactive. NOx varies linearly with increase in percentage of load. At a higher load percentage, the fuel-air ratio increases, consequently increasing the average gas temperature in the combustion chamber, thus resulting in NOx formation on account of its susceptibility to temperature increment.
The average increase in NOx of JB blends were 4.47% (J5), 12.6% (J10), 8.96% (J15), 0% (J20), 14.17% (J40), 17.1% (J60), 20.14 % (J80), 20.14% (J100) lower than diesel. A similar increase in trend was also observed in MB blends. Biodiesel contains more oxygen content than diesel, which leads to higher emissions of NOx because of complete high combustion temperature (Cheng et al.2009; Devan et al. 2009). Kalam et al. (2011) indicated higher fuel viscosity, which is due to bigger droplet size injection which enhances higher NOx emissions.
3.2.6. Unburnt Hydrocarbon (UHC)
Figure 16a-b depicts a decrease of UHC emissions with increasing blends of JB and MB. It is due to higher CN of biodiesels which results in delayed combustion. Fuel atomization enhances ignition and mixing resulting in efficient combustion. Fuel properties affect mixing, and the CN plays a major role in combustion. JB and MB made from vegetable oil have higher CN than diesel, thus leading to HC emissions. The average reduction of HC is 6.94% (J5), 11.58% (J10), 16.6% (J15), 25.86% (J20), 43.62% (J40), 46.71% (J60), 49 % (J80), and 48.4% (J100) lower than diesel. Similar decrease in trend was also observed in MB blends as 3.8% (M5), 7.33% (M10), 13.51% (M15), 20.46% (M20), 27.33% (M40), 35.13% (M60), 44.08% (M80), and 49.03% (M100). Thus, JB emits less UHC than MB. With an increase in the concentration of oxygen in blended fuels, more molecules get burnt and thus resulting in the completion of combustion process (Ashraful et al. 2014). Higher oxygen content results in complete efficient combustion, which in turn decreases the concentration of HC emissions concentration. Again, the delay in burning is due to decrease in HC as the biodiesel has greater CN than that of diesel.