The geomagnetically induced current (GIC) was noticed nearly two centuries ago by Barlow (1849) from his observation of the deflection of the telegraph magnetic needles of the Midland Railroad station coinciding with auroral activity. Later, the GIC induced during geomagnetic activities was found flowing through the earthed utility systems such as oil and gas metal pipe lines, electric power grids, tele-communication networks, etc. (e.g., Campbell 1980; Pirjola and Lehtinen 1985; Pirjola 2000). The GIC is large at high latitudes (e.g., Campbell 1980; Pulkkinen et al. 2001; Vladimir et al. 2019) and smaller at lower latitudes (e.g., Watari et al. 2009; Liu et al. 2009, 2014; Barbosa et al. 2015; Carter et al. 2015) probably basically due to the orientation of the geomagnetic field changing from vertical and open at high latitudes to closed and horizontal at low latitudes. The large geomagnetic field fluctuations produced by the large electric currents flowing in the magnetosphere and ionosphere during space weather events are referred as geomagnetic storms at low and mid latitudes and geomagnetic activities or storm-time substorms at high latitudes (e.g., Gonzalez et al. 1994).
The GIC during extreme geomagnetic activities produced by fast solar storms such as ICMEs (interplanetary coronal mass ejections with frozen-in solar magnetic field or interplanetary magnetic field IMF) can exceed the tolerance limit of the systems and cause system damages as has happened during a number of such events (e.g., Albertson and Thorson 1974; Bolduc 2002; Kappenman 2005; Pulkkinen et al. 2005; Wik et al. 2009; Marshall et al. 2012; Balan et al. 2019a). The extreme event on 13 March 1989 caused electric power outage in Quebec for nine hours costing hundreds of millions of US$ (Medford et al. 1989; Boteler 2001, 2019). An event similar to the famous Carrington event of September 1859 (Carrington 1859) occurring at the present time could cause damages costing up to (estimated) 1–2 trillion US$ (e.g., Baker 2002; Pulkkinen et al. 2017; Hapgood et al. 2021). On the other hand, low-to-medium level GIC flowing for long periods can cause cumulative impacts such as reactive power loss in transformers and corrosion in metal pipe lines, which can pose significant risk especially when there are defects in the systems (Gaunt 2014; Dimmock et al. 2019; Khanal et al. 2019; Ingham and Rodger 2018; Clilverd et al. 2018, 2020]. Therefore, for forecasting the devastating effects of GIC, it is important to understand the relationship between the GIC during geomagnetic activities and solar wind-IMF parameters.
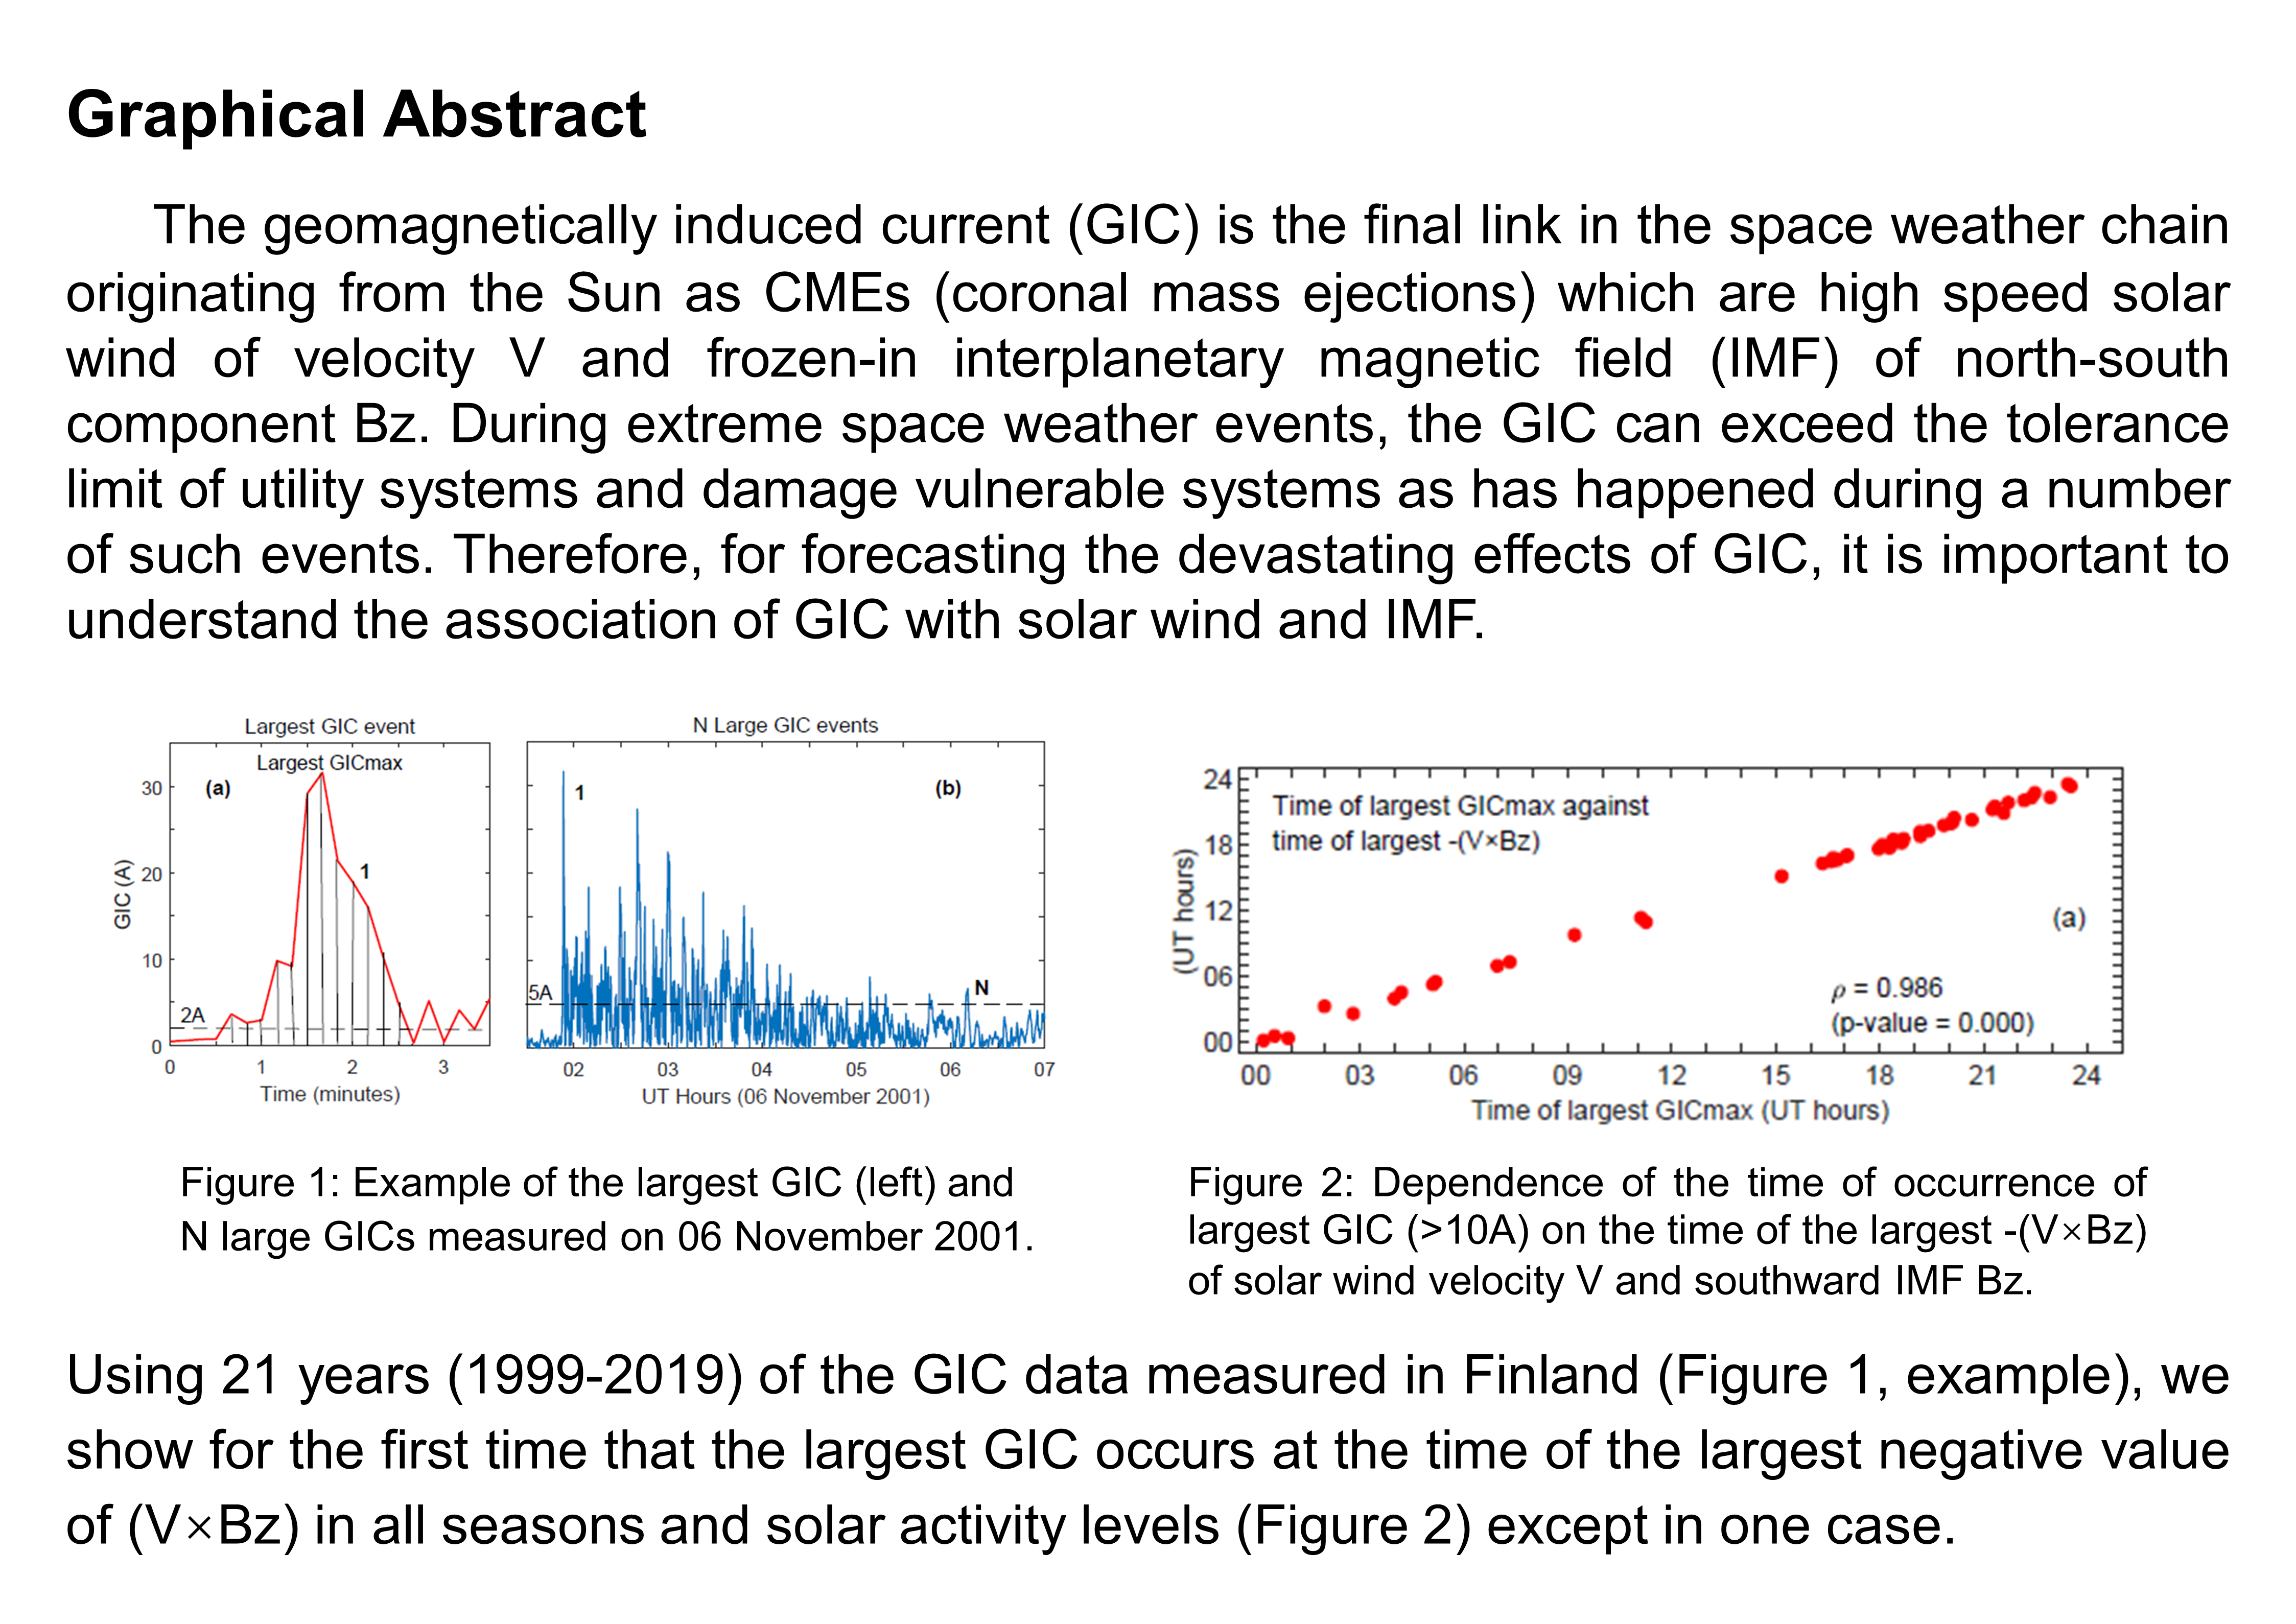
The GIC has been measured routinely in the Finnish natural gas pipeline station Mäntsälä (MAN) since 1999 (Pulkkinen et al. 2001; Viljanen et al. 2006). Using the Finland data, several scientific groups studied the association of GIC with local time and season, solar and geomagnetic activities, substorms and electrojets, and solar wind and IMF (e.g., Viljanen et al. 2010; Borovsky and Denton 2006; Huttunen at al. 2008; Dimmock et al. 2019; Tsurutani and Hajra 2021; Hajra 2022a,b). Viljanen et al. (2010) conducted an 11-year study of GIC > 5A. Using the data during 1999–2005, Borovsky and Denton (2006) and Kataoka and Pulkkinen (2008) showed that the GIC due to CME-driven storms pose most of the problems for ground-based conductor systems, whereas the effect of CIR-driven storms is minor. Huttunen at al. (2008) examined the relative effects of the ejecta, sheath and boundary regions of ICMEs on GIC ≥ 10A. According to them (Huttunen at al. 2008) the most intense GIC activity (> 10A) is likely to take place during the passage of the turbulent sheath region of ICMEs possibly due to their capacity to drive substorms. Dimmock et al. (2019) showed that the unusually large GIC (up to 28A) occurred during the 7–8 September 2017 storm could be associated with westward and eastward electrojets. Recently, Tsurutani and Hajra (2021) surveyed the GIC > 10A and > 30A in 21 years (1999–2019) of the GIC data. They suggested that the shocks and substorms are probably the predominant causes of the intense GICs, and super-substorm and intense substorm auroral electrojet intensifications are the most frequent (76%) cause of GIC > 30A. Following this, Hajra (2022a) reported the correlations between the occurrence rate of 48 GIC clusters and solar activity (0.68), integrated intensity of the GIC clusters and SymHMin (0.73), and peak intensity of the GIC clusters and integrated intensity of substorm clusters (0.85). In another paper, Hajra (2022b) showed the occurrence rate of GIC > 10A is high in solar cycle 23 and at September equinox, low at March equinox and lowest around summer solstice; and the occurrence rate is 67%, 31% and 2%, respectively, during super storms, intense storms and moderate storms.
However, what determines the time of occurrence and amplitude of the largest GIC during geomagnetic storms/activities, which during extreme storms can cause sudden damage of vulnerable utility systems, is not yet known. We address this important question using the 21-year (1999–2019) GIC data measured at MAN in Finland (Pulkkinen et al. 2001). We investigate the relationship of the largest GIC event (defined in section 2) observed during the geomagnetic activities at high, mid and low latitudes with the corresponding ICME front velocity ΔV (defined in section 2), solar wind velocity V, dynamic pressure P and IMF Bz, and the products V×Bz and P×Bz. The results reveal for the first time that the largest GIC during all geomagnetic activities occurs at around the time of the largest negative value of the product V×Bz in all seasons and solar activity levels, except in one case. The geomagnetic activity data are from the Kyoto University websites and solar wind and IMF data are from the ACE (advanced composition explorer) satellite at the L1 point (McComas et al. 1998; Skoug et al. 2004) for the same 21 years as the GIC data. The data and analysis are described in section 2. The results are presented and discussed in sections 3 and 4.