Oncomelania snails
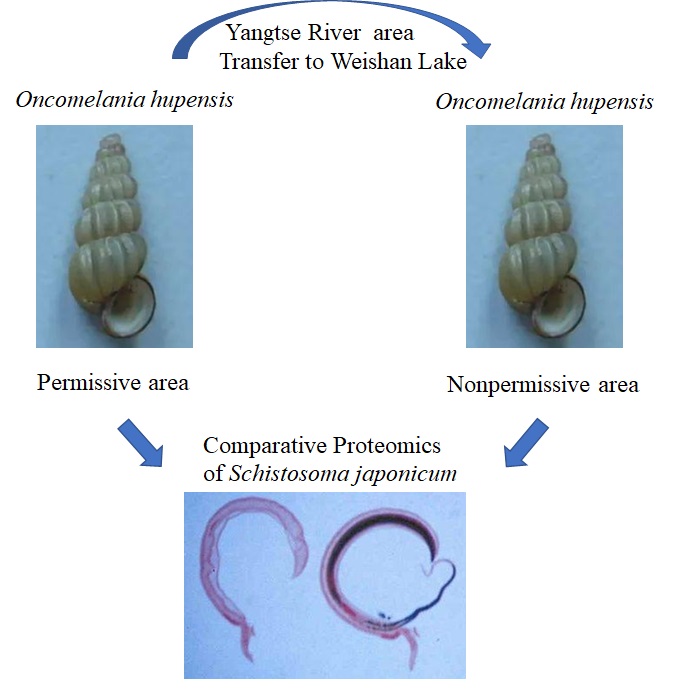
Compared with the Jiangsu snails, the body size of the Shandong snails in the Weishan Lake region decreased, and their shells became thinner (Sup Figure 1). We cannot exclude the possibility that environmental factors affect snail breeding, which leads to a natural tendency toward decay over time.
SDS-PAGE analysis of adult schistosome proteins
Protein content and quality of four different samples of adult worm proteins were initially assessed by 12% SDS-PAGE analysis ("T-M", "CK-M", "T-FM" and "CK-FM"). The samples showed a complex mixture of proteins ranging from 150 kDa to < 10 kDa. Each sample exhibited slightly distinct band patterns and were subsequently prepared for LC-MS/MS analysis (Sup Figure 2).
LC-MS/MS identification of proteins
A total of 2364 adult worm proteins were identified and 1901 proteins were quantified in this experiment. Our results showed that there were 68 DEPs in the T_FM-vs-CK_FM group, including 24 upregulated proteins and 44 downregulated proteins, and 55 DEPs in the T_M-vs-CK_M group, including 25 upregulated proteins and 30 downregulated proteins. The DEP distribution ratios obtained from our analysis are displayed and were defined based on threshold protein quantifications (1.2 & 0.05) (Figure 1).
Functional classification of DEPs
DEPs were classified by gene ontology (GO) term analysis based on cellular component, molecular function, biological progress and subcellular location. Our results indicated that 9 cellular components were enriched among the 68 DEPs from the T_FM-vs-CK_FM group, which included 32 upregulated proteins and 36 downregulated proteins (Sup Figure 3). In addition, 10 cellular components were enriched among the 73 DEPs from the T_M-vs-CK_M group, which included 25 upregulated proteins and 48 downregulated proteins (Sup Figure 3).
Our statistical analysis showed that the 38 DEPs from the T_FM-vs-CK_FM group (19 upregulated proteins and 19 downregulated proteins) were enriched for three molecular functions (binding, molecular transducer activity and catalytic activity). Of the 38 DEPs, the largest number of proteins were enriched for catalytic activity, which accounted for more than a half, followed by binding and molecular transducer activity (Sup Figure 3). The T_M-vs-CK_M group was enriched for 5 molecular functions (binding, structural molecule activity, transporter activity, antioxidant activity and catalytic activity), with 16 upregulated proteins and 14 downregulated proteins. Of the 40 DEPs, the number of proteins enriched for catalytic activity and binding was almost the same, which were followed by structural molecule activity, antioxidant activity and transporter activity (Sup Figure 3).
The 52 DEPs from the T_FM-vs-CK_FM group (30 upregulated and 22 downregulated proteins) were enriched for biological processes including localization, biological regulation, metabolic processes, response to stimulus, cellular component organization or biogenesis, cellular processes and single-organism processes (Sup Figure 3). Compared with the T_FM-vs-CK_FM group, the 41 DEPs from the T_M-vs-CK_M group (13 upregulated and 28 downregulated proteins) were enriched for biological processes including biological regulation, metabolic processes, response to stimulus, cellular component organization or biogenesis, regulation of biological processes, cellular processes, signaling and single-organism processes (Sup Figure 3).
Our statistical analysis of the subcellular location category showed that the distribution of the subcellular distributions of the 68 DEPs were different between the T_FM-vs-CK_FM group and T_M-vs-CK_M group (Fig.2). A larger number of DEPs were enriched in the cytosol (38.18%), extracellular space (30.91%), cytoskeleton (5.45%) and plasma membrane (9.09%) in the T_M-vs-CK_M group than in the T_FM-vs-CK_FM group (cytosol, 30.88%; extracellular space, 30.91; cytoskeleton, 5.45%; and plasma membrane, 8.28%). Meanwhile, fewer DEPs were enriched in the nucleus (7.27%) and cytosol-nucleus (1.82%) in the T_M-vs-CK_M group compared to the T_FM-vs-CK_FM group (nucleus, 11.76% and cytosol-nucleus, 10.29%).
Functional enrichment of DEPs
Kyoto Encyclopedia of Genes and Genomes (KEGG) analysis was used to classify the DEPs by their GO enrichment analysis. First, we calculated the GO enrichment of cellular components associated with the DEPs, including terms such as protein-DNA complex, nucleosome, DNA packaging complex, chromosome, chromosomal part, chromatin, extracellular region and extracellular space (Sup Figure 4). The results revealed 25 DEPs in the T_FM-vs-CK_FM group and 27 DEPs in the T_M-vs-CK_M group among 934 total proteins (Sup Table1, 2); of the identified DEPs, 11 proteins from each group were upregulated and 14 and 16 proteins were downregulated, respectively (Sup Figure 4). The results from the GO enrichment analysis for cellular components showed that the T_FM-vs-CK_FM group was enriched for terms including protein-DNA complex and nucleosome and DNA packaging complex, while the T_M-vs-CK_M group was enriched for terms such as extracellular space and extracellular region (Sup Table1, 2).
Next, GO enrichment analysis was used for molecular functions associated with the DEPs, including oxidoreductase activity, ferroxidase activity, ferric iron binding, iron ion binding, transition metal ion binding, cysteine-type peptidase activity, glutathione transferase activity, peroxiredoxin activity, lipid binding, transferase activity, oxidoreductase activity, peroxidase activity, calcium-dependent phospholipid binding, peptidase activity, antioxidant activity and phospholipid binding (Figure 3). The results revealed that there were 29 DEPs from the T_FM-vs-CK_FM group and 31 DEPs from the T_M-vs-CK_M group out of a total of 1216 proteins (Sup Table3, 4). This included 14 and 12 DEPs that were upregulated and 15 and 19 DEPs that were downregulated in the two groups, respectively (Figure 3). The results from the GO enrichment analysis for molecular functions showed that the T_FM-vs-CK_FM group was enriched for oxidoreductase activity, ferroxidase activity and ferric iron binding, while the T_M-vs-CK_M group was enriched for cysteine-type peptidase activity and glutathione transferase activity.
GO enrichment analysis was then used for biological processes associated with DEPs, including cellular homeostasis, homeostatic processes and transition metal ion homeostasis (Sup Figure 5). The results revealed 19 DEPs in the T_FM-vs-CK_FM group and 19 DEPs in the T_M-vs-CK_M group among the 881 total proteins, which included 11 and 7 DEPs that were upregulated and 8 and 12 DEPs that were downregulated in two groups, respectively (Sup Figure 5). The results from the GO enrichment analysis for biological processes showed that the T_FM-vs-CK_FM group was enriched for homeostatic processes and cellular homeostasis, while the T_M-vs-CK_M group was enriched for protein folding and actomyosin structure organization.
Finally, KEGG enrichment analysis revealed 19 DEPs in the T_FM-vs-CK_FM group and 17 DEPs in the T_M-vs-CK_M group among the 1009 total proteins (Sup Figure 6). The DEPs from the T_M-vs-CK_M group were involved in mineral absorption, systemic lupus erythematosus, antigen processing and presentation, alcoholism and biosynthesis of amino acids. In contrast, the DEPs from the T_M-vs-CK_M group were involved in signaling pathways of drug metabolism, metabolism, chemical carcinogenesis, the peroxisome, glutathione metabolism, systemic lupus erythematosus and the lysosome (Sup Figure 6). A total of 10 and 5 DEPs were upregulated in females and males, respectively, while 9 and 12 DEPs were downregulated in females and males, respectively (Sup Figure 6). GO enrichment analysis for KEGG pathway results showed that the T_FM-vs-CK_FM group was associated with mineral absorption, while the T_M-vs-CK_M group was associated with protein folding.