Clinical characteristics and survival of Neuroblastoma in adults and adolescents
Of all the entries extracted according to the inclusion and exclusion criteria, a total number of 4561 patients were identified from the SEER database, with 4368 (95.8%) patients diagnosed before the age of 19 (adolescent group) and 193 (4.2%) diagnosed after the age of 19 (adult group) (Fig1.a). The median age of diagnosis for the adolescent group is 1-9 years old and 35-39 years old for the adult group. Most of the patients were diagnosed at the age of 1-9 (Fig1.b). There was no significant difference in the gender or race distribution between the adolescent and adult groups (Table 1). To compare the prognosis of neuroblastoma in adults and adolescents, Kaplan-Meier plot and log-rant test were used to determine the overall survival (OS) and cancer-specific survival (CSS) of the two groups. The adolescent group had a significantly better overall survival compared with the adult group (p<0.0001), the median survival time for the adult group was 31 months (95% CI: 24-45 months) while the median survival time for the adolescent group was 70 months (95% CI: 64-74 months) (Fig1.c). The cancer-specific survival was defined as the cause of death registered as neuroblastoma in the SEER database. Similarly, the adolescent group showed better cancer-specific survival compared with the adult group (p<0.0001) (Fig1.d). To further study the cancer-specific death caused by neuroblastoma in the two age groups, we used the competing risk model to test for the cumulative incidence of cancer-specific death. By considering other causes of death as competing risks, the model showed that adults were more susceptible to neuroblastoma-caused death compared with adolescents. Interestingly, adolescents had a significantly higher incidence of death by other causes (Fig1.e).
Table 1. Clinical characteristics of adult and adolescent neuroblastoma patients
| |
adolescents
|
percent
|
adults
|
percent
|
p-value
|
|
Total
|
4368
|
|
193
|
|
|
|
Gender
|
|
|
|
|
0.7486
|
|
male
|
2292
|
52.5%
|
99
|
51.3%
|
|
|
female
|
2076
|
47.5%
|
94
|
48.7%
|
|
|
Race
|
|
|
|
|
0.6932
|
|
Black
|
555
|
12.7%
|
29
|
15.0%
|
0.3452
|
|
White
|
3429
|
78.5%
|
147
|
76.2%
|
0.44
|
|
Other
|
339
|
7.8%
|
16
|
8.3%
|
0.7882
|
|
Unknown
|
45
|
1.0%
|
1
|
0.5%
|
0.7423
|
|
Grade(differentiation)
|
|
|
|
|
|
|
I(well-differentiated)
|
125
|
2.9%
|
1
|
0.5%
|
0.0855
|
|
II(moderately-differentiated)
|
43
|
1.0%
|
10
|
5.2%
|
<0.0001
|
|
III(poorly-differentiated)
|
1302
|
29.8%
|
28
|
14.5%
|
<0.0001
|
|
IV(undifferetiated)
|
424
|
9.7%
|
16
|
8.3%
|
0.5141
|
|
unknown
|
2474
|
56.6%
|
138
|
71.5%
|
<0.0001
|
|
Primary Site
|
|
|
|
|
|
|
Brain
|
80
|
1.8%
|
50
|
25.9%
|
<0.0001
|
|
Retroperitoneum
|
528
|
12.1%
|
28
|
14.5%
|
0.3146
|
To determine whether there are significant differences between clinical characteristics in the two age groups, the chi-square test and Fisher’s exact test were deployed to test frequencies of each category. The most common grade of differentiation was grade III (poorly-differentiated) in both age groups, with the proportion significantly higher in adolescents compared with adults (29.8% vs 14.5%, adolescents vs adults, p<0.0001). The inverse was true in grade II tumors, where the adult group had a higher proportion of patients (1.0% vs 5.2%, adolescents vs adults, p<0.0001). However, the grade information was not obtained or recorded in most cases (56.6% vs 71.5%, adolescents vs adults). The primary site of the tumor had distinct distribution in the two groups (Fig2), the most common primary sites in adult patients included brain, retroperitoneum, soft tissue, endocrine organs, nasopharynx area, and cranial nerves, while the most common primary sites in adolescent patients were endocrine organs, soft tissue, retroperitoneum, respiratory organs. In comparison, the adult group had a significantly higher incidence of neuroblastoma in the brain (25.9% vs 1.8%, adults vs adolescents, p<0.0001), nasopharynx area (8.3% vs 0.1%, adults vs adolescents, p<0.0001), and cranial nerves (7.8% vs 2.5%, adults vs adolescents, p<0.0001). The adolescent group had significantly higher incidence in soft tissue (24.9% vs 13.5%, adolescents vs adults, p=0.0003) and endocrine organs (44.0% vs 10.9%, adolescents vs adults, p<0.0001). Histology type was also significantly different in the two age groups, adults had a higher proportion of ganglioneuroblastoma (23.8% vs 16.3%, adults vs adolescents, p=0.0056). Though contrary to the mortality rate, ganglioneuroblastoma is generally considered less aggressive than classic neuroblastoma, the results indicate that prognostic factors other than histology type might be stronger determinants of the prognosis of adult-onset neuroblastoma. The surgery rates were comparable between the two groups; however, the adolescent group had a higher resection rate (50.7% vs 36.3%, adolescents vs adults, p<0.0001), other forms of surgery include tumor destruction, tumor reduction, and explorative surgery with biopsy. The results suggest that although a similar proportion of patients underwent surgery in the two age groups, the adolescent patients were more likely to receive resection to achieve a better surgical outcome, this is possibly due to the nature of primary site locations and the complexity of surgery in adolescent patients. The adolescent group had a significantly more treatment rate of chemotherapy (66.2% vs 45.1%, adolescents vs adults, p<0.0001), but less treatment rate of radiology (19.2% vs 37.8%, adolescents vs adults, p<0.0001). The results are in line with the mortality rate since the current guideline for neuroblastoma treatment suggests that radiotherapy only applies to patients with recurrence after surgery or for palliative purposes, while chemotherapy is a common modality for low to mid-risk patients.
Univariate analysis of prognostic factors in adult patients.
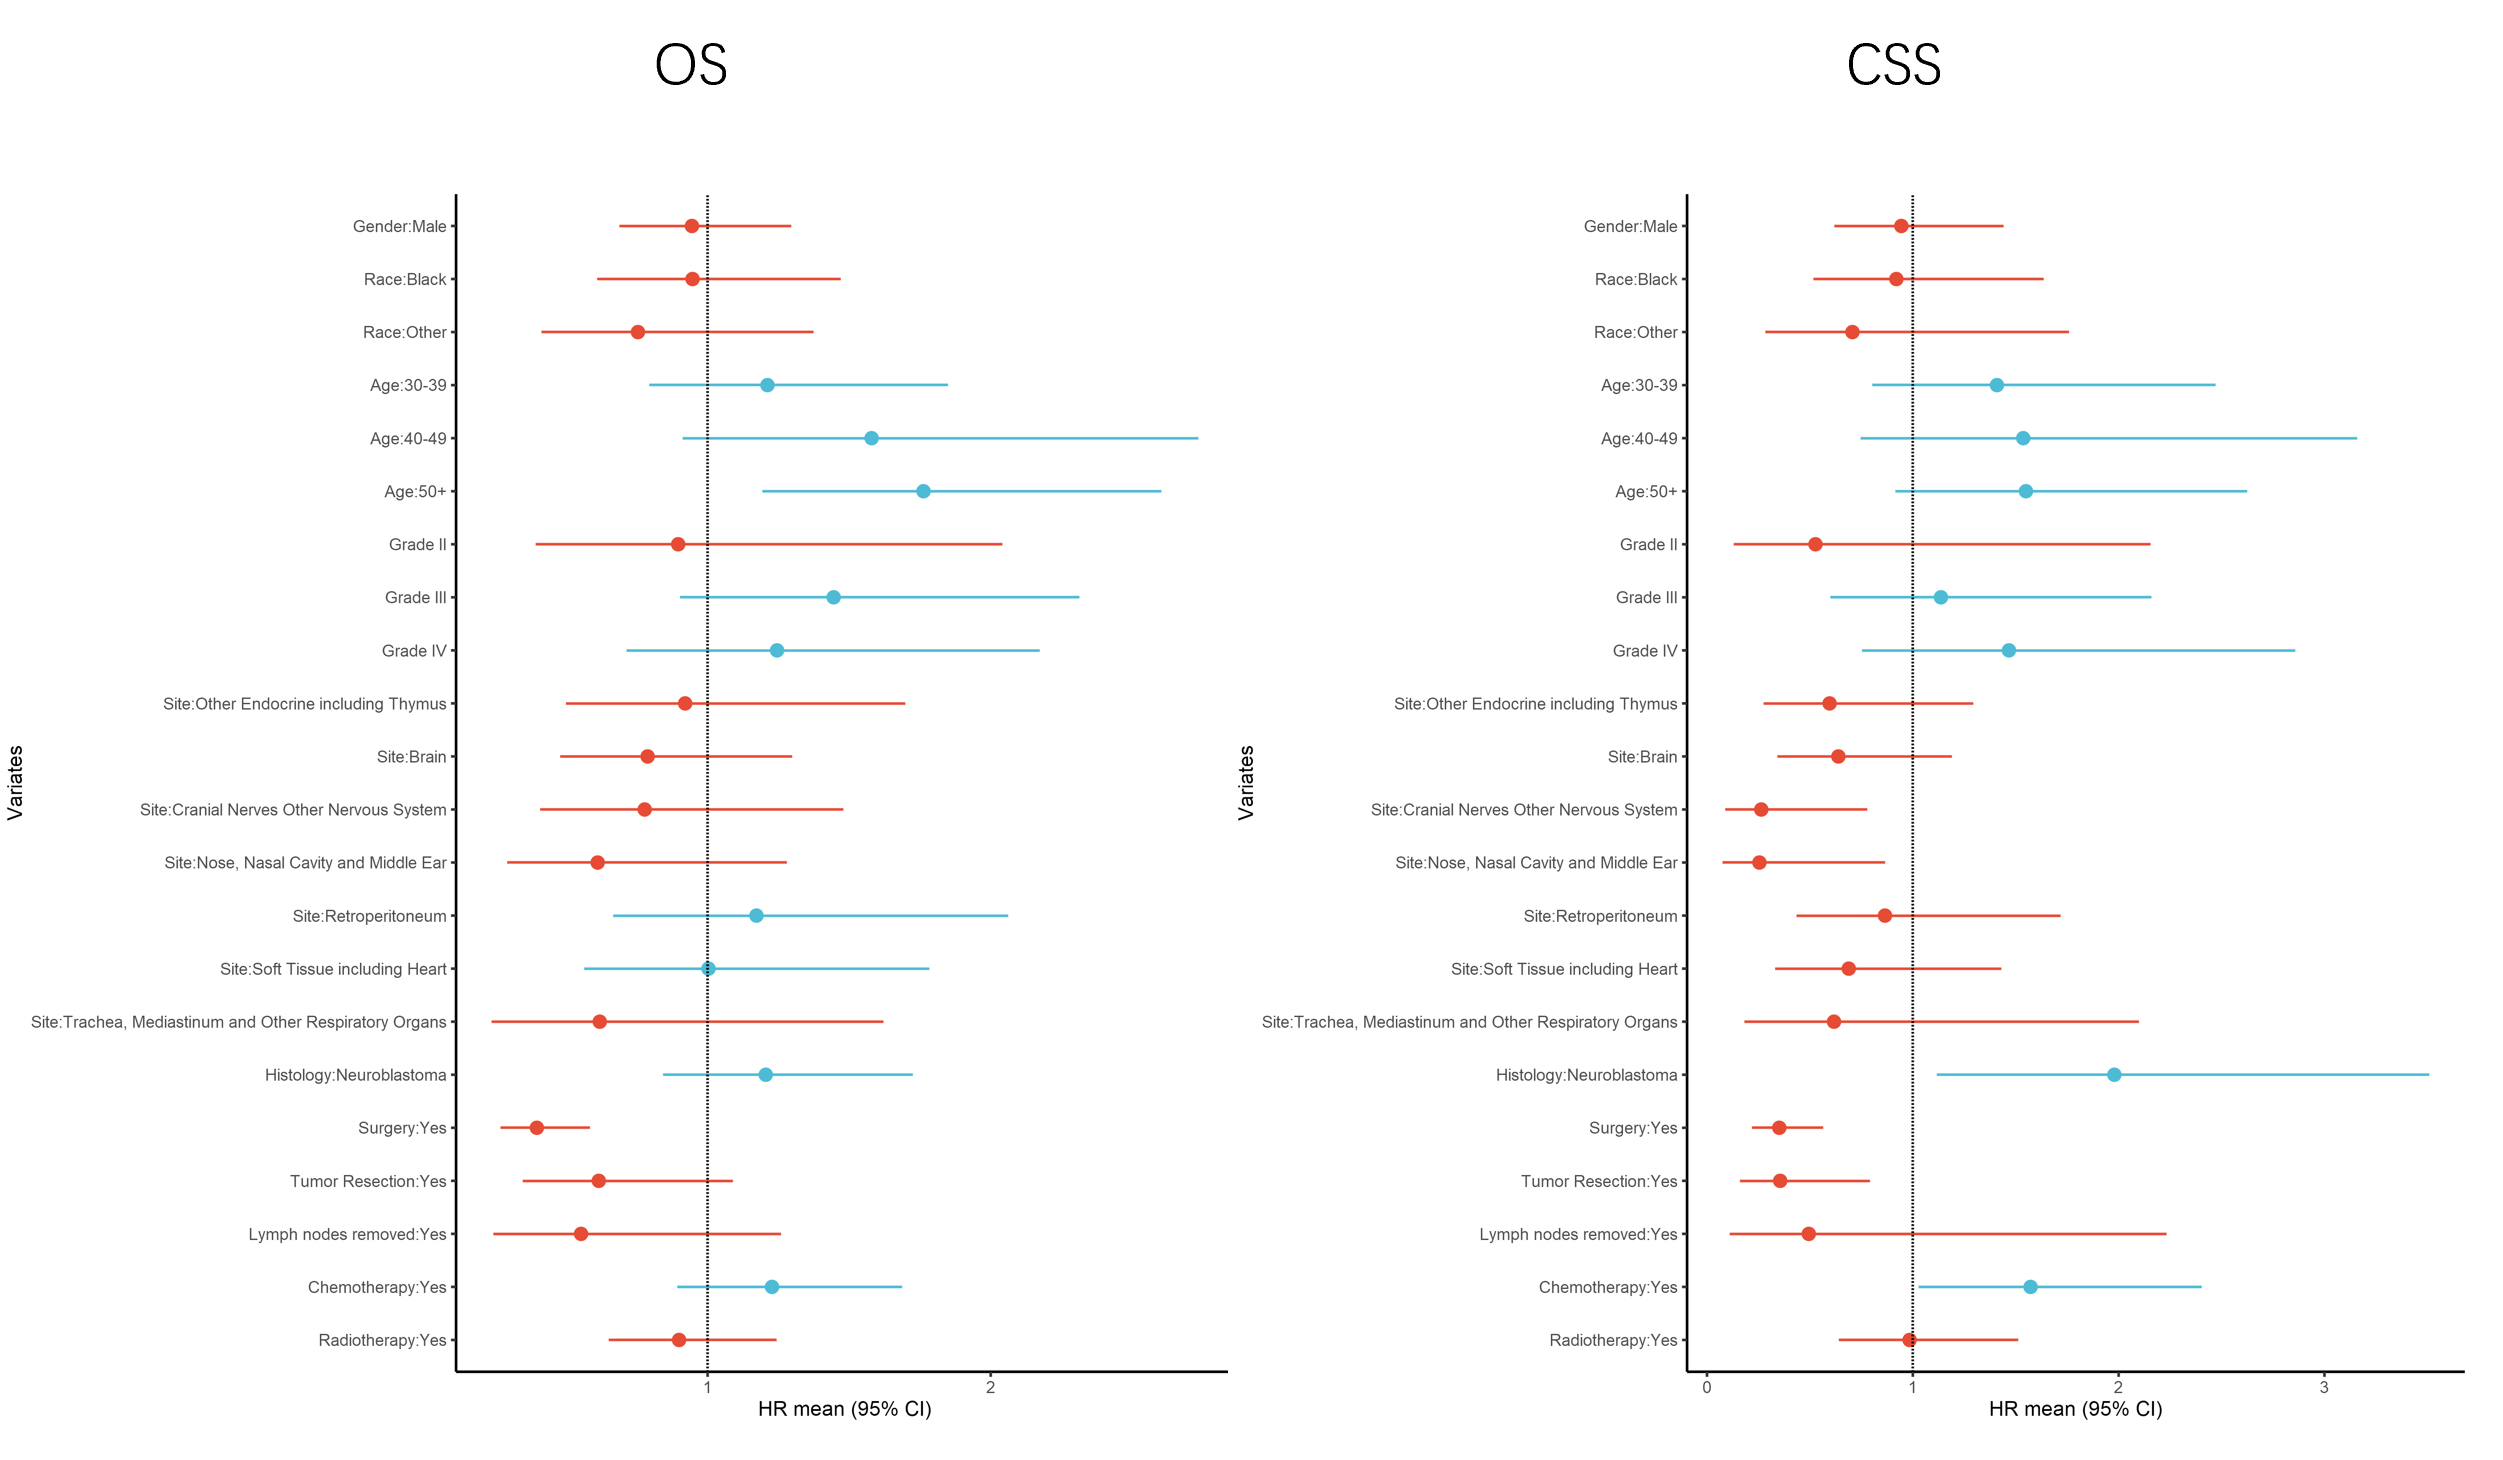
To study the determinants of the worsened prognosis in adult patients, univariate analysis was performed using a Cox proportional hazard regression model (Cox regression model) in the adult group. For model development, the adult group was randomly separated into training and validation groups at a ratio of 4:1 for further analysis. Cox regression model on overall survival in the training group showed that gender and race were not associated with prognosis (Table 2). However, increased age was associated with a worse prognosis, the onset-age of more than 50 had a hazard ratio of 1.7627 (95%CI: 1.1937-2.6027, p = 0.004), indicating that even after stratification of age by adults and adolescents, it remains a strong determinant of prognosis. Another statistically significant prognostic factor for overall survival is the treatment by surgery, with a hazard ratio of 0.3968 (95%CI: 0.2691-0.5852, p <0.0001), suggesting that surgical intervention is still the most effective treatment for adult neuroblastoma patients. Considering that the overall survival does not fully reflect the characteristics of the tumor since other factors such as comorbidities and environmental exposure might affect the results, we also analyzed the cancer-specific survival using the Cox regression model. The cancer-specific survival analysis revealed that primary site of the nasopharynx and middle ear (HR=0.2547, 95%CI: 0.0749-0.8659, p = 0.0285), as well as cranial nerves and other nervous system organs (HR=0.2637, 95%CI: 0.0892-0.7798, p = 0.0160), had significantly better prognosis compared with other sites as reference. However, these areas of primary sites are less common than other sites such as the brain and retroperitoneum. Therefore, although more favorable to prognosis, they contribute less to the general survival rate of adult patients. Surgery remained a significant prognostic factor for better prognosis in the cancer-specific survival (HR=0.3513, 95%CI: 0.2188-0.5639, p<0.0001) while tumor resection showed significant better prognosis compared with other forms of surgery (HR=0.3556, 95%CI: 0.1595-0.7928, p = 0.0115). Histology type of neuroblastoma was associated with worsened prognosis (HR=1.9792, 95%CI: 1.1159-3.5103, p = 0.0195), in line with the more aggressive nature of classic neuroblastoma. Interestingly, patients who received chemotherapy had worse survival (HR=1.5723, 95%CI: 1.0284-2.4037, p = 0.0367), this is probably because chemotherapy is more commonly used in patients with higher risk level or nonresectable tumor as replacement therapy, thus these patients generally have a more advanced stage of the tumor. We also tested the lymph node removal and positive lymph nodes by biopsy in the Cox regression model, however, these factors did not have a significant impact on survival. To further validate the Cox regression results, we plotted the overall survival and cancer-specific survival in the whole adult group stratified by different prognostic factors, all showed statistical significance (Fig.3 a-e).
Table 2. Univariate analysis of prognostic factors in adult-onset neuroblastoma patients
| |
OS
|
CSS
|
| |
HR
|
95% CI
|
p-value
|
HR
|
95% CI
|
p-value
|
|
Gender
|
|
|
|
|
|
|
|
Female
|
1.0000
|
|
|
1.0000
|
|
|
|
Male
|
0.9446
|
0.6885 - 1.296
|
0.724
|
0.9443
|
0.6184 - 1.4417
|
0.7905
|
|
Race
|
|
|
|
|
|
|
|
White
|
1.0000
|
|
|
1.0000
|
|
|
|
Black
|
0.9467
|
0.6094 - 1.4708
|
0.8075
|
0.92
|
0.5172 - 1.6363
|
0.7765
|
|
Other
|
0.754
|
0.4138 - 1.3739
|
0.3563
|
0.7066
|
0.2838 - 1.7595
|
0.4557
|
|
Unknown
|
1.0155
|
0.1413 - 7.3
|
0.9878
|
N/A
|
N/A
|
N/A
|
|
Age
|
|
|
|
|
|
|
|
20-29
|
1.0000
|
|
|
1.0000
|
|
|
|
30-39
|
1.2115
|
0.7936 - 1.8494
|
0.3741
|
1.4088
|
0.8032 - 2.4709
|
0.2319
|
|
40-49
|
1.5794
|
0.9124 - 2.734
|
0.1026
|
1.5366
|
0.7474 - 3.1591
|
0.2427
|
|
50+
|
1.7627
|
1.1937 - 2.6027
|
0.0044
|
1.5497
|
0.9148 - 2.6253
|
0.1033
|
|
Grade(differentiation)
|
|
|
|
|
|
|
|
I(well-differentiated)
|
1.0000
|
|
|
1.0000
|
|
|
|
II(moderately-differentiated)
|
0.8961
|
0.3933 - 2.0417
|
0.794
|
0.527
|
0.1289 - 2.155
|
0.3727
|
|
III(poorly-differentiated)
|
1.4453
|
0.9028 - 2.3138
|
0.125
|
1.1367
|
0.5984 - 2.1589
|
0.6956
|
|
IV(undifferetiated)
|
1.2453
|
0.7135 - 2.1734
|
0.4402
|
1.4669
|
0.753 - 2.8576
|
0.2601
|
|
unknown
|
N/A
|
N/A
|
N/A
|
N/A
|
N/A
|
N/A
|
|
Primary Site
|
|
|
|
|
|
|
|
Others
|
1.0000
|
|
|
1.0000
|
|
|
|
Brain
|
0.7881
|
0.4784 - 1.2983
|
0.3499
|
0.6383
|
0.3422 - 1.1908
|
0.1583
|
|
Cranial Nerves Other Nervous System
|
0.7778
|
0.4087 - 1.4802
|
0.444
|
0.2637
|
0.0892 - 0.7798
|
0.016
|
|
Nose, Nasal Cavity and Middle Ear
|
0.6117
|
0.2925 - 1.2793
|
0.1917
|
0.2547
|
0.0749 - 0.8659
|
0.0285
|
|
Other Endocrine including Thymus
|
0.9207
|
0.4993 - 1.6977
|
0.7913
|
0.5957
|
0.2744 - 1.2932
|
0.1903
|
|
Retroperitoneum
|
1.1726
|
0.6668 - 2.062
|
0.5804
|
0.8646
|
0.435 - 1.7187
|
0.6782
|
|
Soft Tissue including Heart
|
1.0032
|
0.5644 - 1.7831
|
0.9913
|
0.6889
|
0.3317 - 1.4305
|
0.3175
|
|
Trachea, Mediastinum and Other Respiratory Organs
|
0.6191
|
0.2364 - 1.6214
|
0.329
|
0.6171
|
0.1815 - 2.098
|
0.4394
|
|
Histology type
|
|
|
|
|
|
|
|
Ganglioneuroblastoma
|
1.0000
|
|
|
|
|
|
|
Neuroblastoma
|
1.2055
|
0.8424 - 1.7249
|
0.3067
|
1.9792
|
1.1159 - 3.5103
|
0.0195
|
|
Surgery
|
|
|
|
|
|
|
|
No
|
1.0000
|
|
|
|
|
|
|
Yes
|
0.3968
|
0.2691 - 0.5852
|
<0.0001
|
0.3513
|
0.2188 - 0.5639
|
<0.0001
|
|
Tumor resection
|
|
|
|
|
|
|
|
No/other surgery type
|
1.0000
|
|
|
|
|
|
|
Yes
|
0.6157
|
0.3478 - 1.0899
|
0.096
|
0.3556
|
0.1595 - 0.7928
|
0.0115
|
|
Nodes removal
|
|
|
|
|
|
|
|
No
|
1.0000
|
|
|
|
|
|
|
Yes
|
0.553
|
0.243 - 1.2587
|
0.1581
|
0.4946
|
0.1095 - 2.2335
|
0.3601
|
|
Nodes positive
|
|
|
|
|
|
|
|
No
|
1.0000
|
|
|
|
|
|
|
Yes
|
2.3586
|
0.6339 - 8.7765
|
0.2006
|
N/A
|
N/A
|
N/A
|
|
Chemotherapy
|
|
|
|
|
|
|
|
No
|
1.0000
|
|
|
|
|
|
|
Yes
|
1.2275
|
0.893 - 1.6873
|
0.2067
|
1.5723
|
1.0284 - 2.4037
|
0.0367
|
|
Radiology + Surgery
|
|
|
|
|
|
|
|
No
|
1.0000
|
|
|
|
|
|
|
Yes
|
0.8993
|
0.6504 - 1.2434
|
0.5208
|
0.9844
|
0.6408 - 1.5123
|
0.9429
|
Multivariate analysis of prognostic factors in adult patients.
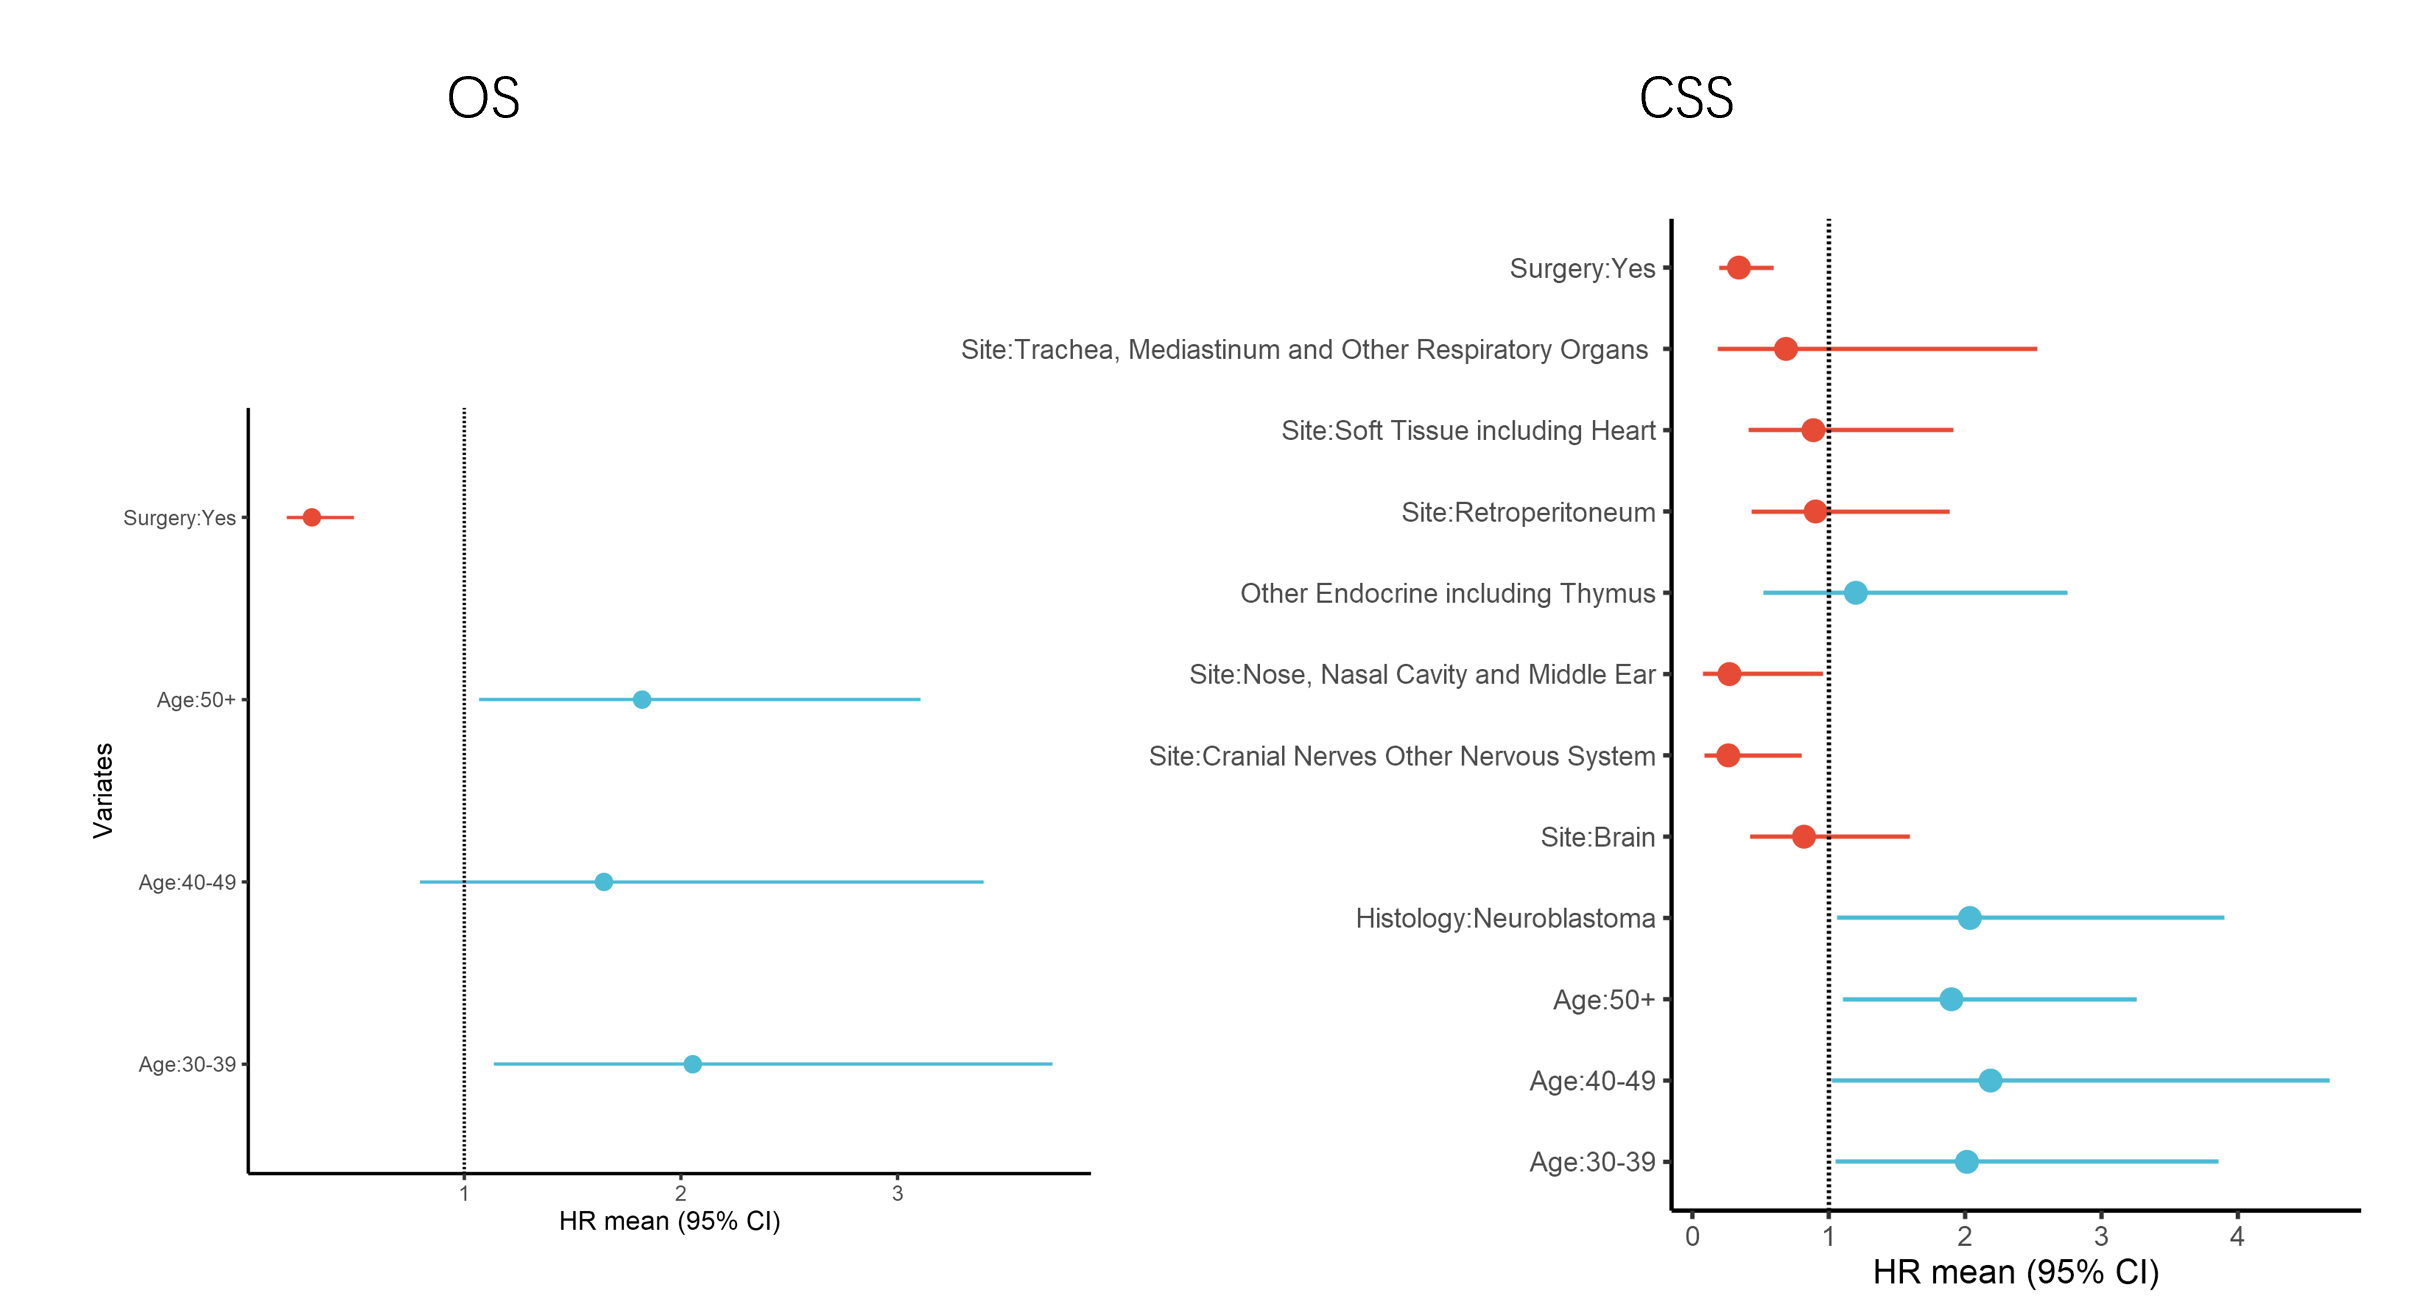
To adjust for different confounding factors and assess the adjusted significance of the prognostic factors for adult-onset neuroblastoma, we performed multivariate Cox regression on the training group to test for previously identified factors as well as the established confounding or prognostic factors. Factors highly correlated with each other were removed to avoid multicollinearity. Age and surgery treatment were identified as significant prognostic factors for overall survival after adjustment (Table2). Higher age of onset was associated with worsened prognosis while surgery was an important factor for better prognosis with a hazard ratio of 0.2966 (95%CI: 0.1796-0.4900, p<0.0001). Cancer-specific survival was also analyzed by the multivariate Cox regression model. Likewise, age was significantly associated with worsened prognosis, patients who were diagnosed at the age of 40-49 had the highest hazard ratio of 2.1865 (95%CI: 1.0028-4.6742, p=0.0436) as compared with the age group of 20-29 for reference. Surgery remained the most important factor for improved prognosis (HR=0.3412, 95%CI: 0.1951-0.5970, p<0.0001). The primary site was also a significant factor for the outcome after adjustment, patients who had primary tumor located at cranial nerves or nervous system other than the brain had a better survival (HR=0.2635, 95%CI: 0.0867-0.8004, p=0.0186), so did those with the primary site at nasopharynx and middle ear (HR=0.2717, 95%CI: 0.0769-0.9602, p=0.0431). Finally, the histology type of classic neuroblastoma was significantly associated with increased cancer-specific mortality (HR=2.0346, 95%CI: 1.0612-3.9011, p=0.0325). Chemotherapy was not significant in multivariate analysis, indicating that it should only be applied to a certain subset of patients.
Table 3. Multivariate analysis of adjusted prognostic factors in adult-onset neuroblastoma patients
| |
OS
|
CSS
|
| |
HR
|
95% CI
|
p-value
|
HR
|
95% CI
|
p-value
|
|
Gender
|
|
|
|
|
|
|
|
Female
|
1.0000
|
|
|
1.0000
|
|
|
|
Male
|
0.9996
|
0.651-1.5348
|
0.9984
|
0.9817
|
0.6237-1.5452
|
0.9363
|
|
Age
|
|
|
|
|
|
|
|
20-29
|
1.0000
|
|
|
1.0000
|
|
|
|
30-39
|
2.0547
|
1.1361-3.7162
|
0.0172
|
2.0132
|
1.05-3.8599
|
0.0351
|
|
40-49
|
1.6448
|
0.7964-3.3971
|
0.1787
|
2.1865
|
1.0228-4.6742
|
0.0436
|
|
50+
|
1.821
|
1.0673-3.1068
|
0.0279
|
1.8995
|
1.1063-3.2614
|
0.02
|
|
Surgery
|
|
|
|
|
|
|
|
No
|
1.0000
|
|
|
1.0000
|
|
|
|
Yes
|
0.2966
|
0.1796-0.4900
|
<0.0001
|
0.3412
|
0.1951-0.597
|
<0.0001
|
|
Unknown
|
1.6873
|
0.6973-4.0827
|
0.2459
|
1.8420
|
0.7000-4.8469
|
0.2159
|
|
Primary Site
|
|
|
|
|
|
|
|
Others
|
|
|
|
1.0000
|
|
|
|
Brain
|
|
|
|
0.8188
|
0.4207-1.5934
|
0.5562
|
|
Cranial Nerves Other Nervous System
|
|
|
|
0.2635
|
0.0867-0.8004
|
0.0186
|
|
Nose, Nasal Cavity and Middle Ear
|
|
|
|
0.2717
|
0.0769-0.9602
|
0.0431
|
|
Other Endocrine including Thymus
|
|
|
|
1.1988
|
0.5228-2.7489
|
0.6686
|
|
Retroperitoneum
|
|
|
|
0.9036
|
0.4329-1.8862
|
0.7872
|
|
Soft Tissue including Heart
|
|
|
|
0.8875
|
0.4111-1.9159
|
0.7612
|
|
Trachea, Mediastinum and Other Respiratory Organs
|
|
|
|
0.6867
|
0.1862-2.5317
|
0.5723
|
|
Histology type
|
|
|
|
|
|
|
|
Ganglioneuroblastoma
|
|
|
|
1.0000
|
|
|
|
Neuroblastoma
|
|
|
|
2.0346
|
1.0612-3.9011
|
0.0325
|
Development and validation of a nomogram to predict cancer-specific survival
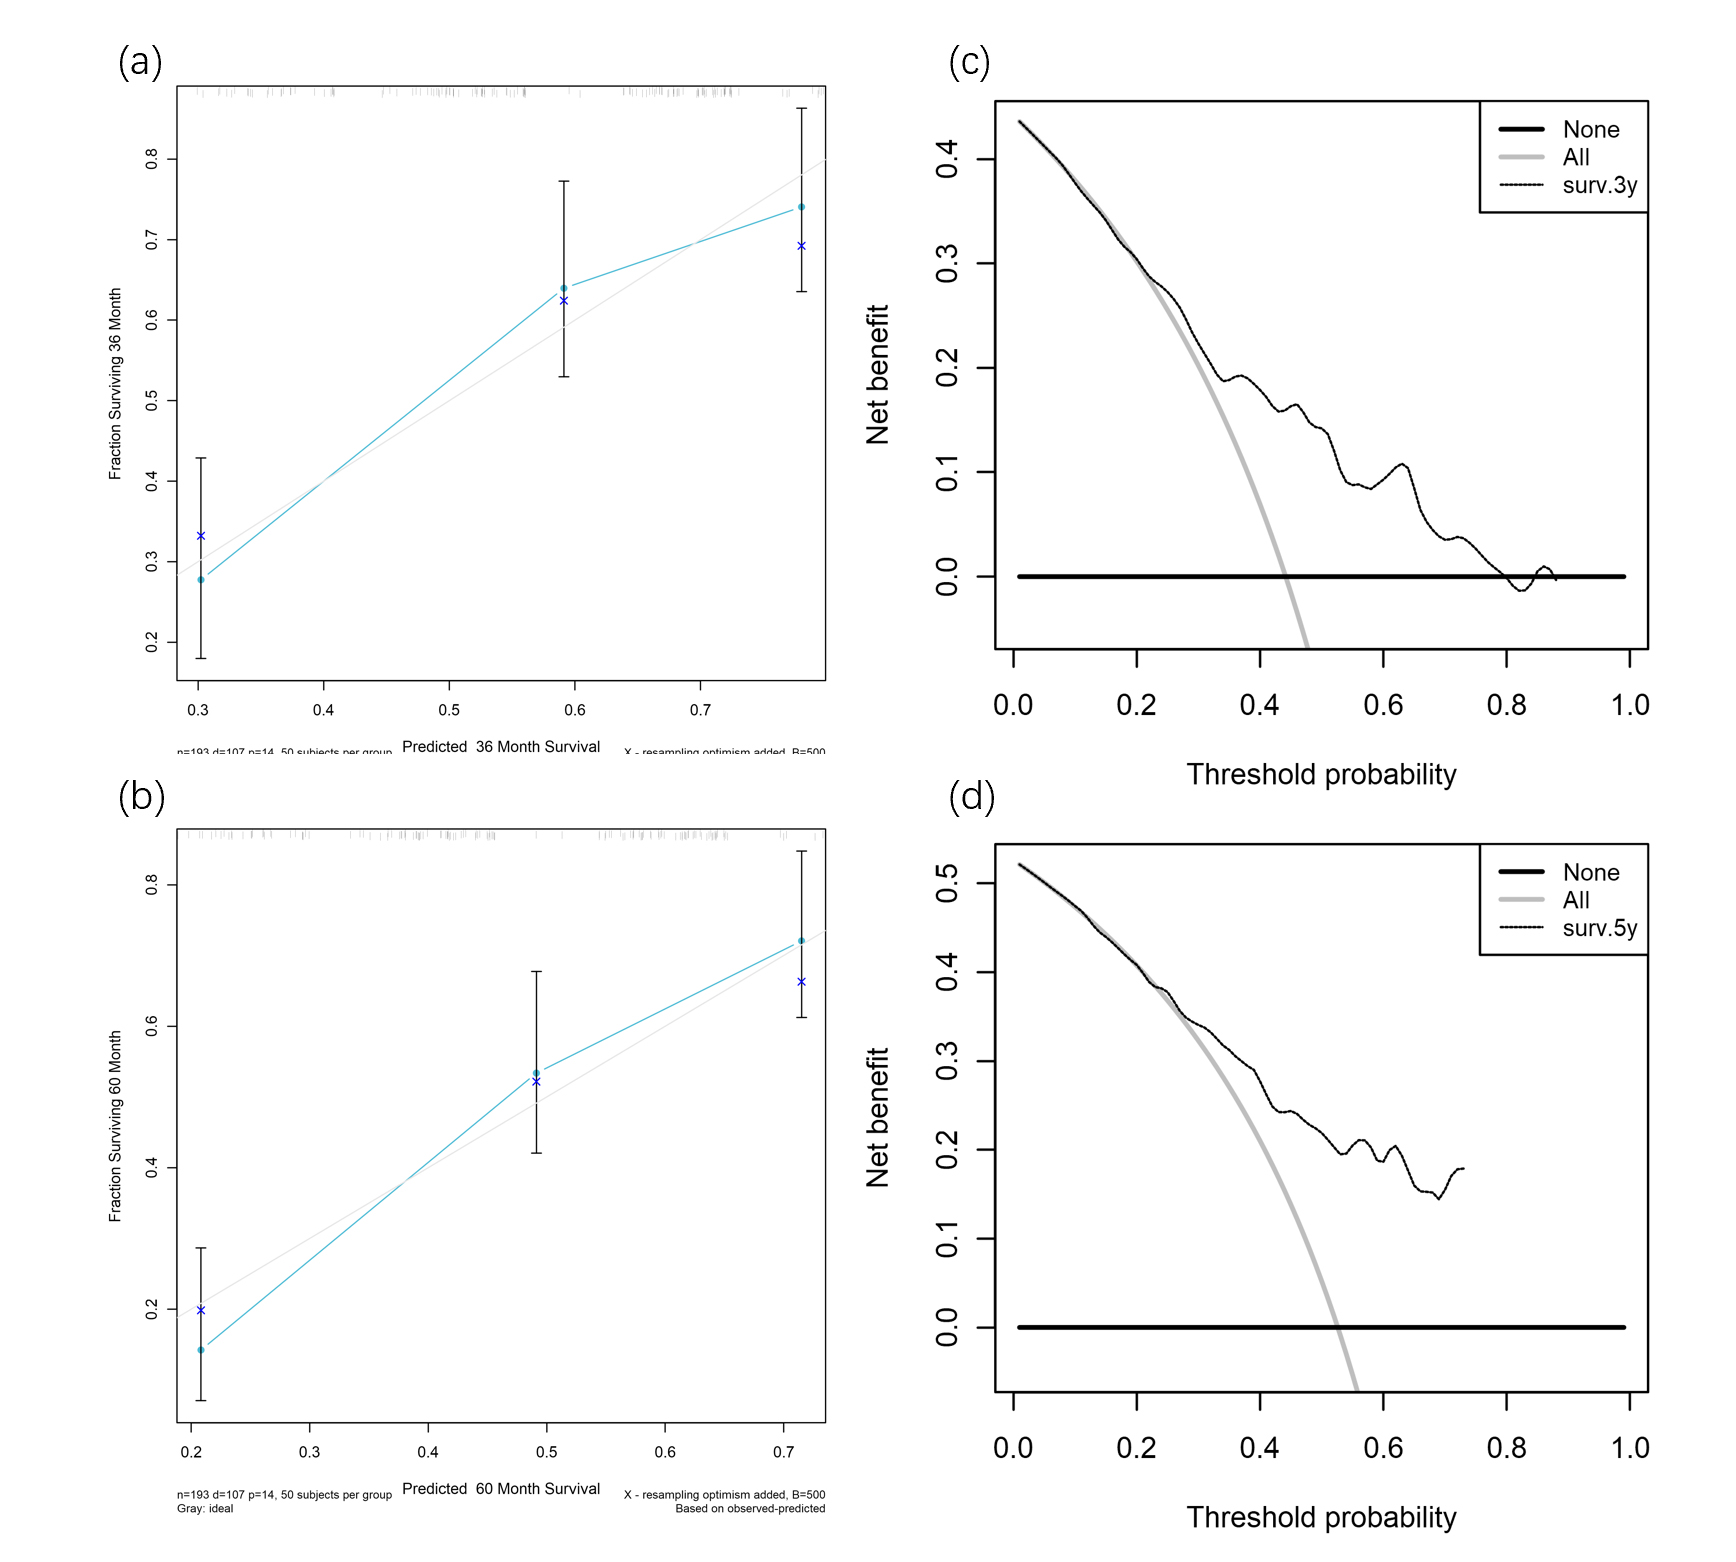
Next, to make the model more suitable for clinical application, we developed a nomogram based on the multivariate Cox regression model for cancer-specific survival. The 3-year and 5-year estimated survival rate was calculated from the model as readouts (Fig.4). By adding up the points generated by different prognostic factors and vertically refer the total points to the survival rate, one can easily generate the prognostic information for a certain patient. The nomogram was tested for the prognostic power using the ROC plot. In the training group, AUC for 5-year survival rate prediction was 0.726, 3-year survival rate prediction was 0.701. In the validation group, the nomogram also generated robust predictive power, with an AUC for a 5-year survival rate prediction of 0.698 and a 3-year survival rate prediction of 0.724 (Fig.5 a-b). The calibration plot also showed good consistency between nomogram predictions and actual observations (Fig.5 c-d, Supplementary). Finally, the DCA curve was plotted to ascertain that the nomogram was useful in clinical decision-making (Fig.5 e-f, Supplementary). The results in the 3-year and 5-year survival predictions both showed that the nomogram had good clinical applicability due to the increased net benefit and a wide range of threshold probabilities.
Stratification of high and low-risk patients according to the nomogram points.
Finally, we sought to find the cut-off value of the total points generated by the nomogram to achieve the best discriminating power of high-risk and low-risk patients. Multiple testing was conducted to identify the cut-off value of 178.3 (80% percentile). Kaplan-Meier plot and log-rank test were performed to validate the stratification of patients by the cut-off value. Both the validation group and the whole adult group showed significant separation of patients on the overall survival and cancer-specific survival (Fig.6 a-d). Therefore, apart from the prediction of survival rate, our nomogram also had an excellent performance in identifying high-risk patients from low-risk patients.