Socio-demographic characteristics
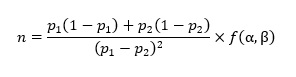
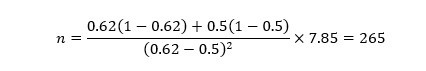
A total of 294 participants were targeted for this study. Of these, 294 participants were enrolled with a response rate of 100%. Their mean age of mothers and their partners’ were 27.4 and 32.8 respectively, 83.67 % of mothers and partners were educated formally. The majority (55.1%) of mothers were unemployed while only 31(10.54%) partners’ were unemployed. Two hundred and forty-two (82.3%) of mother’s perceive the presence of waiting area around the delivery room and 58.1 % of mothers were waited more than 1 hour before seeing doctors(Table 1).
Table 1: Socio-demographic characteristics of study participants’ at University of Gondar referral hospital from Dec 2018 to Jan. 2019 (n=294)
|
Characteristics
|
Mothers n=294 Prevalence of characteristics
|
|
Partners n=294 Prevalence of characteristics
|
|
Age
|
Less than 20
|
13 (4.42)
|
Less than 20
|
4 (1.36)
|
|
20-24
|
103 (35.03)
|
20-30
|
137 (46.60)
|
|
25-29
|
75 (25.51)
|
30-40
|
151(51.36)
|
|
30-35
|
51 (17.35)
|
Greater than 40
|
2 (0.68)
|
|
Greater than 35
|
52 (17.69)
|
|
Educational status
|
Educated
|
246 (83.67)
|
246 (83.67)
|
|
Uneducated
|
48 (16.33)
|
48 (16.33)
|
|
Occupational status
|
Employed
|
132 (44.90)
|
263 (89.46)
|
|
Unemployed
|
162 (55.10)
|
31 (10.54)
|
|
Religion
|
Orthodox
|
239 (81.29)
|
231 (78.57)
|
|
Muslim
|
21 (7.14)
|
29 (9.86)
|
|
Protestant
|
34 (11.56)
|
34 (11.56)
|
|
Marital status
|
Married
|
277 (94.22)
|
266 (90.48)
|
|
single
|
9 (3.06)
|
20 (6.80)
|
|
Divorced
|
8 (2.72)
|
8 (2.72)
|
|
Average amount of money paid for service
|
less than 157
|
224 (76.19)
|
|
|
greater than 157
|
70 (23.81)
|
|
|
Mother’s perception due to the presence of waiting area
|
Yes
|
242 (82.31)
|
|
|
No
|
52 (17.69)
|
|
|
Waiting time before seeing doctors
|
>1hr
|
171 (58.16)
|
|
|
<1hr
|
123 (41.84)
|
|
|
Privacy during the medical examination
|
Yes
|
264 (89.80)
|
|
|
No
|
30 (10.20)
|
|
Obstetrical Characteristics of Mothers
As the delivery character of women (Table 2), 52.7 % of parturient visited the hospital after referred from other health institutions. Majorities of parturient (71.1%) delivered in the hospital for the first time. Two hundred and fifty-four (86.4 %) of pregnancy was wanted and only 13.6% pregnancy unwanted. Among born babies, 94.9 % were live birth and cesarean delivery covered the majority (53.7%) mode of delivery.
Table 2: Obstetrical characteristics of mothers at University of Gondar referral hospital from Dec. 2018 to Jan. 2019 (n=294).
|
Delivery character
|
Frequency (%)
|
|
Mode of visiting
|
Referral
|
155 (52.7)
|
|
Not referral
|
139 (47.3)
|
|
Numbers of parity
|
Primi-para
|
209 (71.1)
|
|
Multipara
|
85 (28.9)
|
|
Wanted status of pregnancy
|
Wanted pregnancy
|
254 (86.4)
|
|
Unwanted pregnancy
|
40 (13.6)
|
|
Mode of delivery
|
Spontaneous vaginal delivery
|
49 (16.7)
|
|
Assisted delivery
|
87 (29.6)
|
|
Cesarean section
|
158 (53.7)
|
|
Fatal outcome
|
Live birth
|
279 (94.9)
|
|
Stillbirth
|
15 (5.1)
|
Mean comparison of mothers and partners level of satisfaction
When we analyzed the mean differences between the mothers’ and partners’ satisfaction level, we observed that the mothers considered themselves more prepared (p<0.00) and more supported by families (p<0.00).Meanwhile, there was no mean difference between mothers and partners satisfaction with distress experienced during labor/labor (p=0.12) and receipt of an obstetric intervention (p=0.89), as a whole there was the mean difference between mothers and partners’ birth satisfaction scale (p=0.02) (Table 3).
Table 3:- Paired t-test mean comparison of participants’ at University of Gondar referral hospital from Dec. 2018 to Jan. 2019 (n=294)
|
Themes of birth satisfaction score
|
Subthemes of birth satisfaction score
|
Mean satisfaction scores(SD)
|
Mean difference
|
p-Value
|
|
Mothers
|
Partners
|
|
Quality of Care provision (QC)
|
Home assessment
|
0.517(0.500)
|
0.629(0.483)
|
-0.112
|
0.004
|
|
Birth environment
|
0.146(0.353)
|
0.251(0.434)
|
-0.105
|
0.001
|
|
Sufficient support
|
0.108(0.311)
|
0.251(0.434)
|
-0.142
|
0.000
|
|
Relationships with health care professionals
|
0.278(0.449)
|
0.166(0.373)
|
0.112
|
0.000
|
|
Women’s Attributes (WA)
|
Ability to cope during labour
|
0.782 (0.413)
|
0.234 (0.424)
|
0.547
|
0.000
|
|
Feeling in control
|
0.323(0.468)
|
0.829 (0.376)
|
-0.506
|
0.000
|
|
Preparation for childbirth
|
0.755(0.430)
|
0.663 (0.473)
|
0.092
|
0.010
|
|
Relationship with baby
|
0.081 (0.274)
|
0.261(0.440)
|
-0.180
|
0.000
|
|
Stress experienced
|
Distress experienced during labour
|
0.378 (0.485)
|
0.320 (0.467)
|
0.058
|
0.129
|
|
Obstetric injuries
|
0.537(0.499)
|
0.731(0.444)
|
-0.193
|
0.000
|
|
Perception of having received sufficient medical care
|
0.530 (0.499)
|
0.799(0.401)
|
-0.268
|
0.000
|
|
Receipt of an obstetric intervention
|
0.833 (0.373)
|
0.836(0.370)
|
-0.003
|
0.895
|
|
Pain experienced
|
0.972(0.162)
|
0.748(0.434)
|
0.224
|
0.000
|
|
Long labour
|
0.758(0.428)
|
0.894(0.571)
|
-0.136
|
0.000
|
|
Health of baby
|
0.537 (0.499)
|
0.3571(0.479)
|
0.180
|
0.000
|
|
Total satisfaction
|
0.524 (0.500)
|
0.588(0.492)
|
-0.064
|
0.020
|
Only 35.4 % of mothers and 42.9 % of their partners were satisfied by the overall quality of care provision, satisfaction with women’s personal attribute were higher in partners’ (55.1%) compared with mothers (42.9%) and 34.0% mothers and 33.7 % partners were satisfied by stress experienced during labour/labor. Generally, 47.6% of the mothers and 41.2% of their partners were satisfied with the overall service of the delivery room in Gondar university referral hospital (Table 4).
Table 4: maternal and partners level of satisfaction at University of Gondar referral hospital from Dec 2018 and Jan 2019 (n=294)
|
Birth satisfaction scale themes
|
Maternal Level of satisfaction, Frequency (%)
|
Partners Level of satisfaction, Frequency (%)
|
|
Satisfied
|
dissatisfied
|
Satisfied
|
Dissatisfied
|
|
Quality of Care provision (QC)
|
104 (35.4)
|
190 (64.6)
|
126 (42.9)
|
168 (57.1)
|
|
Women’s Attributes (WA)
|
126 (42.9)
|
168 (57.1)
|
162 (55.1)
|
132 (44.9)
|
|
Stress experienced during Labour (SL)
|
100 (34.0)
|
194 (66.0)
|
99 (33.7)
|
195 (66.3)
|
|
Overall satisfaction
|
140 (47.6)
|
154 (52.4)
|
121 (41.2)
|
173 (58.8)
|
Factors associated with satisfaction of mothers in delivery room services
Maternal satisfaction with delivery care was associated with age[OR = 0.36, 95%CI (0.18, 0.72 )], religion [OR = 3.14, 95%CI (1.51, 6.51)], the perception about the presence of waiting area [OR =0.01, 95%CI (0.00,0.09)], waiting time before seeing a doctor or a nurse[OR =0.11 ,95%CI (0.00, 0.09)],visiting mode [OR = 0.01, 95%CI (0.00,0.08)], pregnancy status [OR = 0.04, 95%CI (0.00 ,0.33)] and fetal outcome[OR = 0.00, 95%CI (0.00,0.07)] were statistically significant effects.
Keeping all other variables constant; the odds of the maternal level of satisfaction were increased by 0.36 times [OR: 0.36, 95% CI (0.18, 0.72)]; for a unit difference of the age of mothers. Mothers who waited more than one hours before doctors seen were 0.11 times more satisfied than waited less than one hours [OR: 0.11, 95% CI (0.00,0.09)] (Table 5).
Table 5: Factors associated with satisfaction of mothers at University of Gondar referral hospital from Dec 2018 and Jan 2019 (n=294)
|
Variable’s
|
OR
|
SE.
|
Z
|
P>z
|
[95% Conf. Interval]
|
|
Lower
|
Upper
|
|
Age of Mothers’
|
0.361
|
0.128
|
-2.86
|
0.004**
|
0.180
|
0.725
|
|
Educational status of Mothers
|
11.75
|
15.79
|
1.83
|
0.067
|
0.843
|
163.78
|
|
Occupation status of Mothers
|
47.14
|
31.43
|
5.78
|
0.000***
|
12.761
|
174.20
|
|
Religion of Mother
|
3.143
|
1.168
|
3.08
|
0.002**
|
1.517
|
6.511
|
|
Average monthly income
|
0.369
|
.3913
|
-0.94
|
0.347
|
0.046
|
2.946
|
|
Amount paid to the service
|
2.756
|
1.731
|
1.61
|
0.106
|
0.804
|
9.438
|
|
Perceived presence of waiting area
|
0.017
|
.0147
|
-4.82
|
0.000***
|
0.003
|
0.091
|
|
Visiting mode
|
0.012
|
.0122
|
-4.57
|
0.000***
|
0.001
|
0.083
|
|
Waiting time before seeing a doctor or a nurse
|
0.110
|
.0707
|
-3.45
|
0.001***
|
0.032
|
0.387
|
|
Privacy during examinations
|
67.49
|
120.0
|
2.37
|
0.018**
|
2.068
|
2202.4
|
|
Number of parity
|
162.2
|
165.0
|
5.00
|
0.000***
|
22.112
|
1190.8
|
|
Pregnancy status
|
0.044
|
0.045
|
-3.04
|
0.002**
|
0.006
|
0.330
|
|
Mode of delivery
|
2.458
|
1.228
|
1.80
|
0.072
|
0.923
|
6.547
|
|
Immediate maternal condition after delivery
|
0.579
|
0.439
|
-0.72
|
0.472
|
0.131
|
2.564
|
|
Fatal outcome
|
0.001
|
0.003
|
-3.31
|
0.001***
|
0.000
|
0.074
|
*** = variables significant at the 0.01 level
**= variables significant at the 0.05 levela
Factors associated with satisfaction of partners in delivery room services
Partners’ satisfaction with delivery care was associated with age [OR = 0.161, 95%CI (0.053 0.496)],religion [OR = 3.584, 95%CI (1.783,7.205) , occupational status[OR = 0.027, 95%CI (0.003, 0.239), average monthly income [OR = 0.990, 95%CI (0.990, 0.999), amount of money to pay for service [OR = 2.87, 95%CI (1.068, 7.713),visiting mode of his wife/client [OR = 0.082, 95%CI (0.019, 0.346), waiting time of his wife/clients before seeing a doctor or a nurse [OR = 0.123, 95%CI (0.044, 0.334), care providers measure taken to assure privacy during examinations [OR = 10.611, 95%CI (3.001, 37.524), mode of delivery of his wife/client[OR =7.689, 95%CI (3.002, 19.696) were statistically significant factors.
Keeping all other variables constant; the odds of parents satisfaction were increased by 0.161 times [OR: 0.161, 95% CI (0.053, 0.496)]; for one unit increments of the age of families. Partners who follow orthodox Christian were 3.584 times more satisfied than other religion followers [OR: 3.584, 95% CI (1.783, 7.205)] (Table 6).
Table 6: Factors associated with satisfaction of partners at UOGRH from Dec 2018 and Jan 2019 (N=294)
|
Variables
|
Odds Ratio
|
Std. Err.
|
Z
|
P>z
|
[95% CI]
|
|
Lower
|
Upper
|
|
Age of parents
|
0.161
|
0.092
|
-3.19
|
0.001***
|
.053
|
0.496
|
|
Marital status of parents
|
0.540
|
0.321
|
-1.04
|
0.300
|
0.168
|
1.730
|
|
Religion of parents
|
3.584
|
1.277
|
3.58
|
0.000***
|
1.783
|
7.205
|
|
Occupational status of parents’
|
0.027
|
0.030
|
-3.25
|
0.001***
|
0.003
|
0.239
|
|
Average monthly income
|
0.995
|
0.000
|
-2.56
|
0.010**
|
0.994
|
0.999
|
|
Service paid
|
2.87
|
1.447
|
2.09
|
0.037**
|
1.068
|
7.714
|
|
Visiting mode of his wife/attendant
|
0.082
|
0.060
|
-3.41
|
0.001***
|
0.019
|
0.346
|
|
Waiting time before seeing a doctor or a nurse his wife/attendant
|
0.121
|
0.062
|
-4.09
|
0.000***
|
0.044
|
0.333
|
|
privacy during examinations
|
10.611
|
6.838
|
3.67
|
0.000***
|
3.001
|
37.524
|
|
Number of parity
|
83.745
|
84.306
|
4.40
|
0.000***
|
11.642
|
602.369
|
|
Mode of delivery of his wife
|
7.6895
|
3.690
|
4.25
|
0.000***
|
3.001
|
19.696
|
|
maternal condition after delivery
|
.97789
|
.5232
|
-0.04
|
0.967
|
.34262
|
2.7910
|
|
Fatal outcome
|
.00324
|
.01213
|
-1.53
|
0.125
|
2.13e-06
|
4.9480
|
*** = variables significant at the 0.01 level
**= variables significant at the 0.05 level