The frequency-magnitude distribution (FMD) relates the magnitude of the earthquakes (M) and the cumulative number of earthquakes (N) (Gutenberg and Richter 1944), as shown in the following equation.
The parameters a and b are constants, and the b-value is generally close to 1 (Utsu 1971). Rock studies have reported that the b-values decrease with increasing differential stress (Scholz 1968). This result suggests that spatiotemporal changes in b-values reflect stress conditions (Wiemer and Wyss 1997; Schorlemmer and Wiemer 2005; Nanjo et al. 2012).
In the southern Okinawa Trough of southwestern Japan, low b-value (below 0.8) areas are distributed along the rift-axis of the Okinawa Trough (Arai 2021). The b-value in the Ryukyu arc is approximately 1.0–1.2, whereas the b-value in the southern Okinawa Trough is 0.5–0.9. In particular, regions with a b-value of 0.7 or less are distributed in the rift-axis of the southern Okinawa Trough. This is interpreted as being due to stress concentration due to dyke intrusion occurring in the rift-axis of the trough, resulting in a lower b-value in the earthquake swarm area (Arai 2021). Aseismic crustal deformation has been observed in the rift-axis of the southern Okinawa Trough, with possible dyke intrusion during the earthquake swarms (Tu and Heki 2017; Nakamura and Kinjo 2018). Additionally, seismic reflection surveys have found traces of dyke intrusion in the rift-axis of the southern Okinawa Trough (Arai et al. 2017).
However, the method of Arai (2021) potentially does not determine the b-value correctly in the Okinawa Trough. Clearly, it is necessary to have accurate b-values to discuss the relation between the distribution of b-values and tectonic background. To discuss the spatial variation of the b-value, the FMD must first be linear. Another problem is that the previous analysis uses earthquakes with smaller magnitude than the earthquake detection capacity (magnitude completeness [MC]).
Regarding the first problem, if the FMD of seismicity is not linear, the accurate b-value cannot be determined. For example, when multiple earthquake swarms with different MC are analyzed together, a nonlinear FMD is generated (Wiemer and Wyss 2000). In another case, the linearity of the FMD may not hold due to incomplete methods of magnitude determination. In 2003, the Japan Meteorological Agency (JMA) revised the method of magnitude determination. Before 2003, when the displacement magnitude (Tsuboi 1954; Katsumata 1964) and velocity magnitude (Kanbayashi and Ichikawa 1977; Takeuchi 1983) were determined, the JMA set the average of both to the JMA magnitude (MJ) for the earthquake. After the change, new formulas for displacement magnitude (Katsumata 2004) and velocity magnitude (Funasaki 2004) were adopted. Moreover, when displacement magnitude and velocity magnitude are determined, both are listed in the catalog, and the displacement magnitude is given priority over the JMA magnitude. The exact preference of priority for JMA magnitudes is as follows: displacement magnitude (MD) using three or more stations, velocity magnitude (MV) using four or more stations, displacement magnitude (Md) using fewer than three stations, and velocity magnitude (Mv) using fewer than four stations. The previous JMA magnitude underestimated the cumulative number of earthquakes with magnitudes around M4.0–4.5, compared to what would be expected from the FMD. This was caused by the fact that the previous JMA magnitude tended to calculate a velocity magnitude smaller than the displacement magnitude for earthquakes over M4.0 (Funasaki 2004). Since 2003, the magnitude formula was thus revised to reduce the above trend, resulting in a linear FMD connecting the cumulative number curves for earthquakes over and below M4.0 (Data Analysis Section, Earthquake Prediction Information Division, Seismological and Volcanological Department, Japan Meteorological Agency 2004). As a result of the improvements, the cumulative number of earthquakes at the new JMA magnitude almost satisfied the linear FMD requirement.
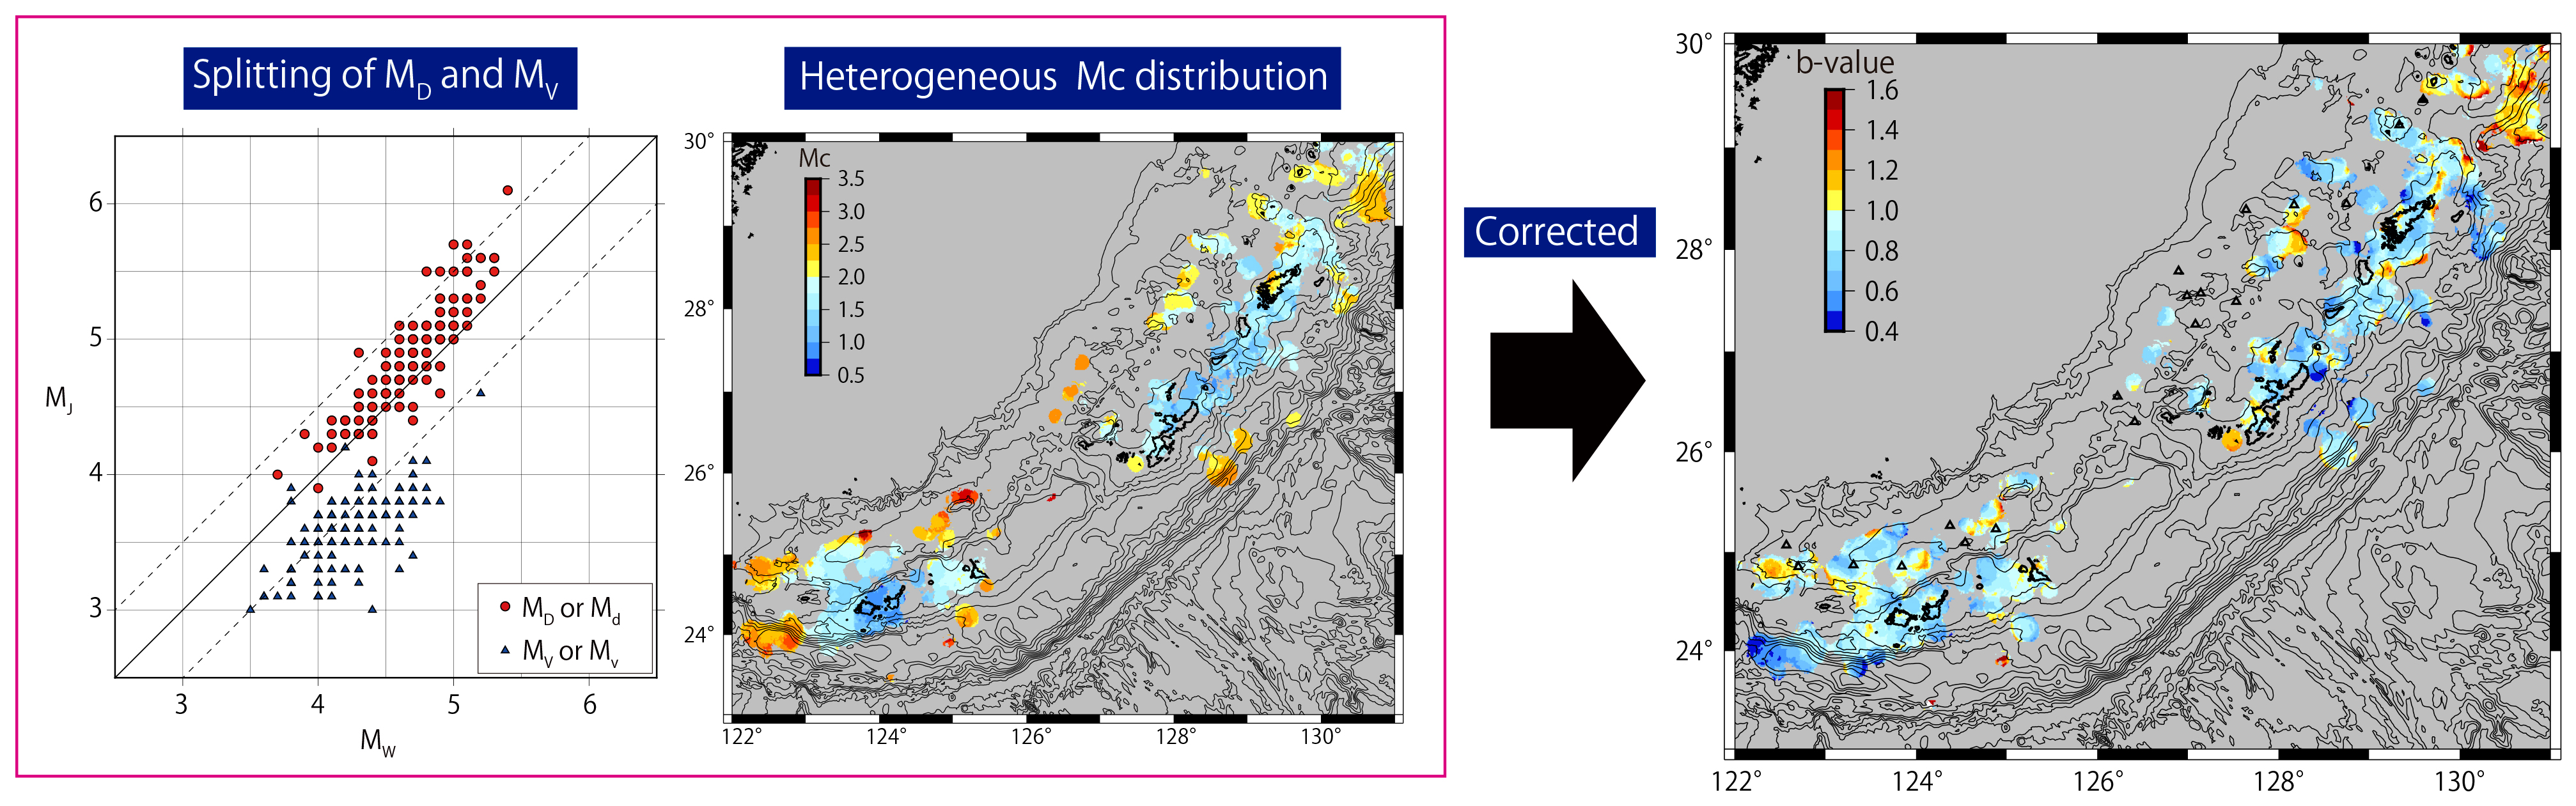
However, the difference between displacement magnitude and velocity magnitude remained large in some areas even after the improvement, particularly in the Ryukyu area. In earthquakes off the northwest coast of Ishigaki Island, the displacement magnitude is approximately 0.5 greater than the velocity magnitude (Data Analysis Section, Earthquake Prediction Information Division, Seismological and Volcanological Department, Japan Meteorological Agency 2004). This effect decreases the frequency of earthquakes around MJ 4.0, using the new JMA magnitude. Notably, this was not seen in the frequency distribution of earthquakes using the previous earthquake catalog. This feature becomes evident by comparing MJ and moment magnitude (MW) from the Full Range Seismograph Network of Japan (F-net) centroid moment tensor (CMT). The MW 4.0–5.0 earthquake group can be separated into larger and smaller MJ, depending on whether MD or MV (or Mv) is employed (Fig. 1c). If MD is adopted for the analysis, the MJ is determined to be 0.17 larger than the MW. On the other hand, if MV is adopted, the MJ is determined to be 0.63 smaller than the MW. This causes the counted number of MJ 4.0–4.5 earthquakes to be lower. The FMD of MW shows no decrease in the frequency between MJ 4 and MJ 5, while the FMD of MJ shows a depression in frequency from MJ 4.0 to MJ 4.2 (Figs. 1d and 1e). When the MC in MJ is around MJ 4.0, the apparent b-value calculated will be smaller, as the slope of the FMD becomes gentler around MJ 4.0–5.0.
The second problem is regarding the temporal and spatial variation of MC. Immediately after a major earthquake, many aftershocks are missed from observations when the high frequency of aftershocks exceeds the discriminating ability of the observation network (Ogata 1983; Utsu et al. 1995; Kagan 2004). For M7-class earthquakes, the MC increased by 0.5–1.0 for 0.5–3 days immediately after the mainshock (Wiemer and Katsumata 1999). In the southern Ryukyu arc and southern Okinawa Trough, the MC has been less than 2.0 since 2001 (Nakamura and Kinjo 2018). However, when earthquake swarms occurred in the southern Okinawa Trough, the MC increased temporarily. Figure 2 shows the temporal variation of MC values in the southern Okinawa Trough. Active earthquake swarms were observed off the north coast of Ishigaki Island in October 2002 and April 2013 (Fig. 2a). The MC values in this region were approximately 2.0 before 2003 and ranged from 1.6 to 2.0 after 2003 (Fig. 2b). However, during the October 2002 earthquake swarm, the MC increased temporarily to 3.8 (Fig. 2b). Similarly, during the 2013 earthquake swarm, the MC increased temporarily to 3.2 (Fig. 2b). The period of increased MC was very short (a few days). However, most of the seismic activity in the rift-axis of the Okinawa Trough is due to short-term earthquake swarms. Alternatively, the b-value could be calculated using the smaller steady-state MC, even though the MC increased due to the swarm earthquakes. In this case, the FMD slope would be determined by including the magnitude range of many undetected earthquakes. This would have caused the underestimation of the b-value in the rift-axis of the Okinawa Trough. The increased MC during earthquake swarms was also observed in other earthquake swarms in the Okinawa Trough (Figure S1–S2). Therefore, in this study, I examined b-values in the central to southern Okinawa Trough rift-axis and investigated whether the low b-values in the southern Okinawa Trough rift-axis were due to the aforementioned problems. The MC and b-values were analyzed using MV to remove the effect of the separation of MJ around MW 4.0.
Essentially, MD should be used because it is closer to MW (Fig. 1c). However, the MD can only be used for large magnitude earthquakes, so the number of earthquakes used for analysis is small, as large earthquakes are limited to a narrow area. Therefore, it is impossible to determine the spatial variation of b-values using MD. Thus, the MV was obtained for the smaller magnitude earthquakes that were used in the analysis. Furthermore, I examined the spatial variation of MC and its temporal variation in the earthquake swarm area to investigate the relationship between the b-value and MC.