Induction of EAE model
Female Lewis rats at 6-8 weeks of age were purchased from Beijing Vital River Laboratory Animal Technology Co., Ltd (Beijing, China). The antigen emulsion was prepared from an emulsion of guinea pig spinal cord white matter homogenates in phosphate-buffered saline (PBS, 50% w/v) mixed with an equal volume of complete Freund’s adjuvant (Sigma-Aldrich) supplemented with 4 mg/mL Mycobacterium tuberculosis. Each rat was immunized by subcutaneous injection of antigen emulsion at a dose of 0.75 ml/kg into its footpad, followed by an auxiliary injection of 8 μg/kg diluted in 0.5 mL pertussis toxin (List Biological Laboratories) in the dorsum of the foot. The second immunization was administered 7 days after the first immunization. Clinical signs of EAE were monitored daily. According to different groups, animals were orally treated with teriflunomide (10 mg/kg) diluted in the Tween 80 or Wnt agnonist R-spondin1 (1mg/kg) or Tween 80 once daily.
After immunization, the rats were observed in a double-blind manner every day and given clinical scores with the following criteria: 0, no clinical signs; 0.5, partial loss of tail tone; 1, affected tail tonus; 2, paresis of hind legs; 3, complete paralysis of the hind legs; 4, complete hind leg paralysis and foreleg paresis; and 5, death due to EAE. These criteria were established and modified according to previous clinical scale systems.
BBB permeability in vivo
For analysis of BBB permeability in the EAE model, 2% Evans blue in PBS were injected intravenously into the tail vein (4mg/kg) of rats. 24 h after injection, rats were perfused with PBS, and the brain and spinal cord were removed. Tissues were homogenized in in 5 ml of formamide and were maintained at room temperature for 48 h. Samples were centrifuged at 14,500g for 30 min, and the supernatant was removed for analysis. The absorbance of the supernatant at 630 nm was measured with a microplate reader (BioTek, Winooski, USA).
NFLs detection
Serum samples were separated at the peak of EAE. The levels of NFLs in each sample were measured by the scanning microplate reader (BioTek, Winooski, USA) using the Bradford method according to the manufacturer’s instructions (Simoa NF-Light Advantage Kit, 103186).
Clinical analysis
For the serum samples, we included all RRMS patients referred for MRI by the MS clinic at our hospital. Inclusion criteria were: (1) an established diagnosis of MS, (2) clinical indication for treatment with definite drug use, (3) age=15 to 50 years and (4) disease duration less than 15years. For DCE-MRI, on a voluntary basis, we included 11 patients with exclusion criteria: (1) other concurring disease and (2) contraindication to MRI scan or MRI contrast agent.
DCE-MRI was performed on a 3T magnetic resonance unit (Verio, Siemens AG, Erlangen, Germany) using a 20-element phased-array head coil. Two pre-contrast T1-weighted (flip angle 2° and 15°, TR/TE 4.09/1.42 ms, 3.0 mm slice thickness, FOV 230 mm * 230 mm, matrix 192 * 192 * 77) images were acquired. After the pre-contrast scan, 60 dynamic contrast-enhanced T1-Weighted (flip angle 15°, TR/TE 5.08/1.8 ms, 3.0 mm slice thickness, FOV 230 mm * 230 mm, matrix 192 * 192 * 77) images were obtained. Then, a bolus dose of 0.1 mmol/kg of gadolinium-based contrast agent (Bayer AG, Leverkusen, Germany) was injected intravenously via the elbow at 3 mL/s with a power injector, followed by 20 mL of normal saline for irrigation.
The DCE-MRI processing was dealt with the commercial software tool (Tissue 4D, Syngo.via, Siemens Healthcare) including motion correction, alignment, and processing. The concentration curve of the volume of interest was generated according to the Tofts model. A population-based arterial input function (AIF) was used and set to “fast”, “intermediate”, or “slow” model with the minimum of chi-square parameter. Regions of interest (ROIs) were drawn on lesions to each of permeability maps (Ktrans, Kep, Ve, and iAUC). For each subject, we used the median value of permeability to exclude effects of possible outliers.
Cell culture and treatment
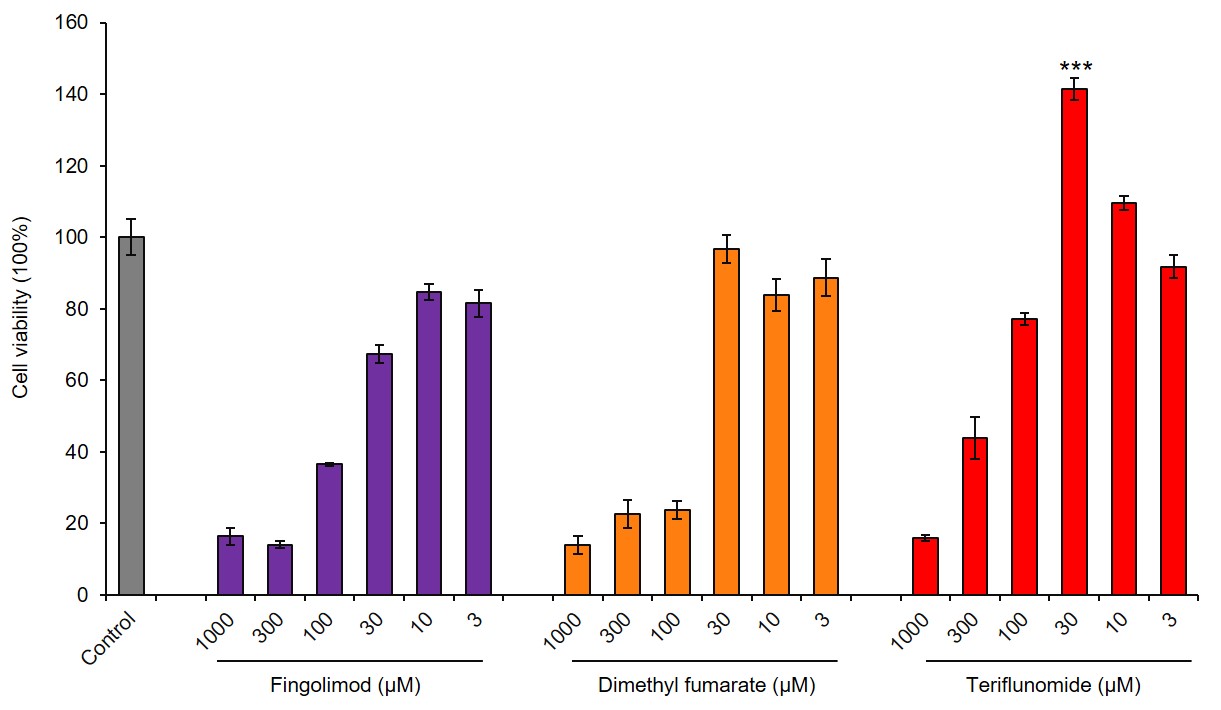
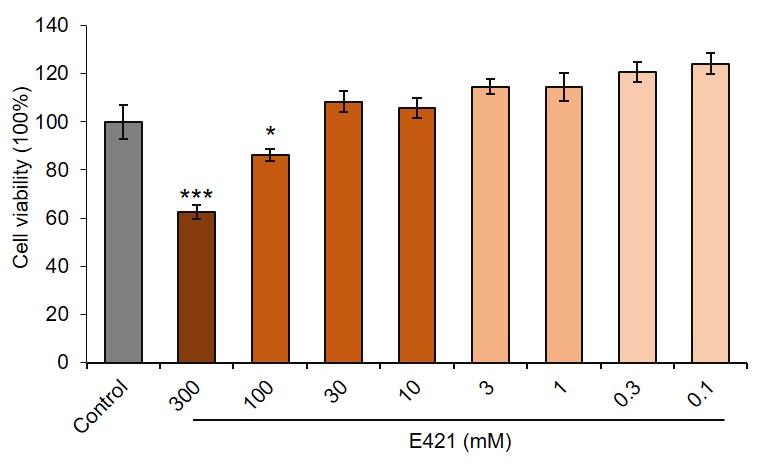
The human brain microvascular endothelial cells (HBMECs) was purchased from BeNa Culture Collection Co. Ltd (Beijing, China) and cultured with endothelial cell medium (ECM). The different concentrations of teriflunomdie (MCE, HY-15405), fingolimod (MCE, HY-11063), dimethyl fumarate (MCE, HY-17363) and mannitol (Aladdin, M119324) were added in the medium for 48 h to observe the effects on HBMECs viabilities. 10 ng/ml TNF (Proteintech, HZ-1014) and 5 ng/ml IFN-γ (Proteintech, HZ-1301) were used for inflammatory stimulation. Wnt signal pathway modulator LGK974 (1 nM, MCE, HY-17545), IWR-1 (10 µM, MCE, HY-12238), R-spondin1 (10 ng/ml, Proteintech, HZ-1328) and SKL2001 (20 µM, MCE, HY-101085) were added in the medium for 48 h to observe the regulation of Wnt signaling on HBMECs. SiRNA of CLDN1 or CTNB (RIBOBIO) was transfected into HBMECs with INTERFERin (DAKAWE).
Cytotoxicity assay
Cell viabilities were measured with CCK-8 according to the manufacturer’s instructions. Briefly, 5 μl of CCK-8 reagent was added into each well and incubated for 1-4 hours. The absorbances at 450 nm were measured using the scanning microplate reader (BioTek, Winooski, USA).
BBB permeability in vitro
The HBMECs were cultured in polyester transwell (1×10⁵ cells per well). When the cells reached confluence, the formed monolayer was used to mimic the BBB morphology and activity in vitro. We used a Millicell-ERS volt-ohmmeter (Millipore, Burlington, USA) to monitor the integrity of the monolayer. The NaF solution was added to the upper layer of the transwell and the lower layer was measured 1 hour later using the scanning microplate reader (BioTek, Winooski, USA).
Quantitative PCR
Total RNA was isolated using TRIzol reagent according to the manufacture’s protocols. Then, cDNA was synthesized using a SuperScript VILO cDNA Synthesis Kit. Quantitative PCR was performed using the StepOnePlus Real-Time PCR System (Life Technologies, New York, USA). The levels of gene expression were normalized to GAPDH. The specific primers (synthesized by GENEWIZ, Suzhou, China) were used as following: TJP1 (forward: AAAGGCGGATGGTGCTACAA, reverse: CGCCTTCTGTGTCTGTGTCT), TJP2 (forward: TGAAGACA CGGACGGTGAAG, reverse: GTCCACGAGAGTGCAAGGAA), TJP3 (forward: TGTGGCCTCATGCCCATCTT, reverse: GATCGCAATGCCA AAGCCC), OCLN (forward: AGCAGCGGTGGTAACTTTGA, reverse: CCTCCAGCTCATCACAGGAC), JAM1 (forward: GGCGGCTGTTGTG TCAGTG, reverse: CGAGTAGGCACAGGACAACTT), JAM2 (forward: AGGCCTATGGGTTTTCTGCC, reverse: CAAAGGAGACACTCCGA CCC), JAM2 (forward: AGGCCTATGGGTTTTCTGCC, reverse: CAA AGGAGACACTCCGACCC), JAM3 (forward: GCCCCTCAGCAACCC TC, reverse: TACCACTGGGGTTCGATTGC), CLDN1 (forward: CTGT CATTGGGGGTGCGATA, reverse: CTGGCATTGACTGGGGTCAT), CLDN3 (forward: TCGGCCAACACCATTATCCG, reverse: CCGTG TACTTCTTCTCGCGT), CLDN5 (forward: TGTCGCAGAAGTACGAG CTG, reverse: TCTTCTTGTCGTAGTCGCCG), CLDN12 (forward: TGT ACCTCGCTGGGAACG, reverse: ATCTGAGCCTGCTTCTCACAC), beta-actin (forward: TTCCTTCCTGGGCATGGAGT, reverse: AATGC CAGGGTACATGGTGG).
Western blot
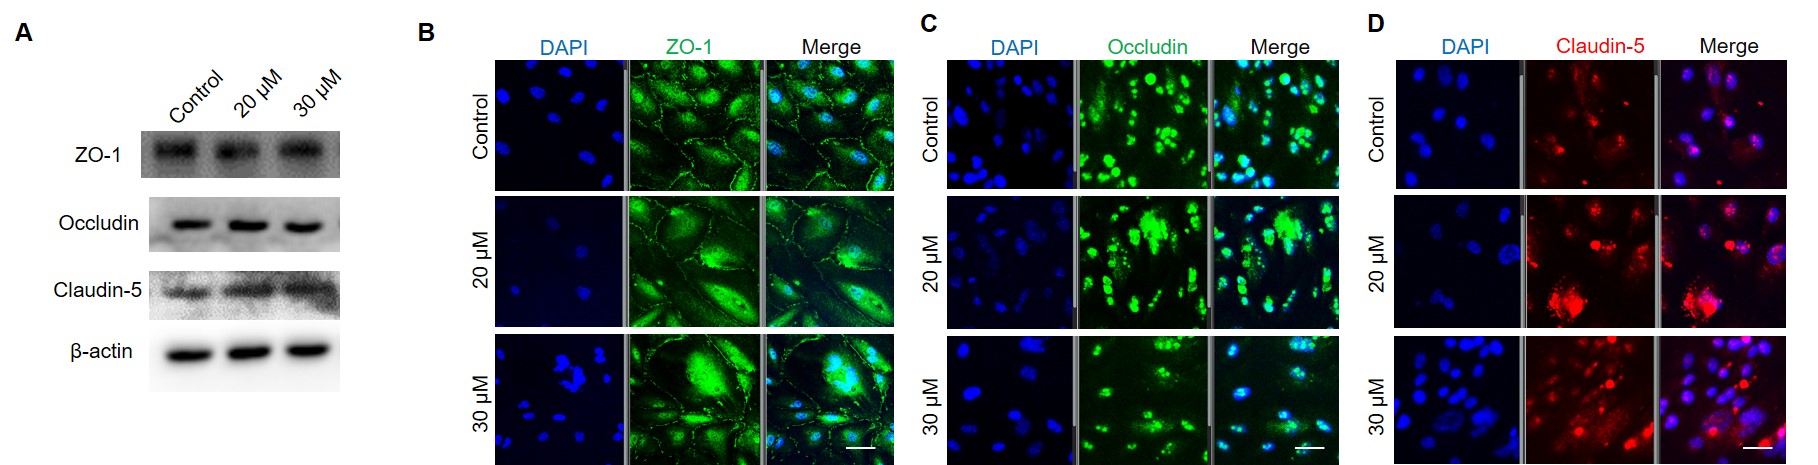
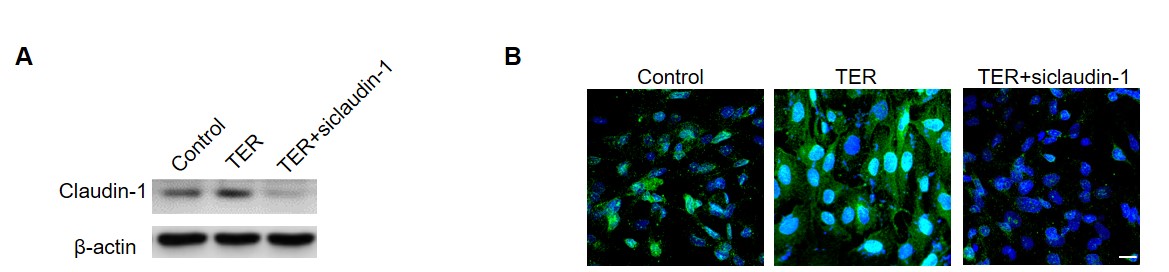
The cultured cells were lysed on ice by RIPA lysates. Protein concentrations were determined with a BCA Protein Quantitation Kit. A total of 10-30 μg protein was loaded in each lane and was separated by 10% SDS-PAGE. After separation, the proteins were transferred to PVDF membranes. The membranes were blocked with 5% defatted milk powder for 1 h. Blots were incubated overnight with the primary antibodies as follows: ZO-1 (1:500, Abcam, ab96587), occludin (1:500, Abcam, ab235986), claudin-5 (1:1000, Abbkine, abp50990), claudin-1 (1:500, CST signaling, 13995S) and β-catenin (1:500, CST signaling, 9587T). The β-actin (1:3000, Proteintech, 66009-1-Ig) was used as a control. Then horseradish peroxidase (HRP)-conjugated secondary antibody were incubated with corresponding primary antibody blots for 1h. Blots were visualized using the ECL western blotting substrate and recorded by the gel imager (Bio-Rad, Hercules, USA).
Immunohistochemistry
For monochromatic immunofluorescence, the cells were cultured in confocal dishes. After fixed with 4% paraformaldehyde for 15 min, triton X-100 (1%) were incubated with cells for 15 min to help the antibody permeating the cell membrane. Then, cells were blocked with 1% of goat serum for 1 h and incubated with antibodies at 4°C overnight. After washed with PBS for three times, cells were incubated with fluorochrome conjugated antibodies for 1 h. Next, DAPI was added for nuclei staining. The images were collected by confocal microscopy (Zeiss, Oberkochen, Germany) and analyzed by Image J software.
For polychromatic immunofluorescence, the sections were incubated with single primary antibody followed by corresponding fluorochrome conjugated second antibody. After staining, the sections were washed and stained for the next indicator. Primary antibodies were used as following: ZO-1 (1:100, Abcam, ab96587), occludin (1:100, Abcam, ab235986), claudin-5 (1:100, Abbkine, abp50990), claudin-1 (1:100, CST signaling, 13995S), β-catenin (1:100, CST signaling, 9587T) and Wnt2b (1:100, invitrogen, MA5-42480).
RNA sequencing
Total RNA of cultured HBMECs was isolated using TRIzol reagent (Invitrogen) according to the manufacturer’s protocol. The RNA was qualified and quantified using a Nano Drop and Agilent 2100 bioanalyzer (Thermo Fisher Scientific, USA). The strand-specific cDNA libraries were generated and amplified with phi29 to make DNA nanoball (DNB) which had more than 300 copies of one molecular, DNBs were loaded into the patterned nanoarray and single end 50 bases reads were generated on BGIseq500 platform.
The sequencing data was filtered with SOAPnuke by (1) Removing reads containing sequencing adapter; (2) Removing reads whose low-quality base ratio (base quality less than or equal to 5) is more than 20%; (3) Removing reads whose unknown base ratio is more than 5%, afterwards clean reads were obtained and stored in FASTQ format. The clean reads were mapped to the reference genome using HISAT2. Bowtie2 was applied to align the clean reads to the reference coding gene set, then expression level of gene was calculated by RSEM. The heatmap was drawn by PHEATMAP according to the gene expression in different samples. Essentially, differential expression analysis was performed using the DESeq2 with Q value ≤ 0.05. To take insight to the change of phenotype, GO and KEGG enrichment analysis of annotated different expressed gene was performed by Phyper based on Hypergeometric test. The significant levels of terms and pathways were corrected by Q value with a rigorous threshold (Q value ≤ 0.05) by Bonferroni.
Luxol fast blue (LFB) staining
After the experiments, anesthetized rats were intracardially perfused with PBS, followed by 4% paraformaldehyde in PBS. The rats were euthanized, and the lumbar spinal cords were removed and immersed for 48 hours in 4% paraformaldehyde for fixation. 4 μm thick transverse sections taken from embedded blocks of spinal cord were deparaffinized and stained with LFB to assess demyelination.
Statistics
Data are presented as the mean ± s.e.m. of at the least three independent experiments. For experiments with two groups, Student’s t test was used for statistical analysis. For experiments with multiple comparisons, significance was determined using ANOVA with Newman-Keuls test. The clinical scores curves were statistically analyzed by the generalized equation. *p<0.05, **p<0.01, ***p<0.001.
