Sampling strategy and ethical approval
This animal study was reviewed and approved by the University of Edinburgh. All procedures were conducted in accordance with Natural England / British Trust for Ornithology license authority and Home Office license authority (Project license PB8A1D5C7, local AWERB review identifier PL10-17).
Blood samples and biometrics were obtained from 51 golden eagle chicks in 37 nests distributed across Scotland’s Highlands and Islands undergoing handling for leg ringing during 2018-19 (Peniche et al. 2022). Chicks ranged from 2- 7½ weeks of age. Age was estimated using a protocol created from descriptions of weekly feather development of American and Scottish golden eagle chicks (Driscoll 2010; Watson 2010).
Biometrics measured
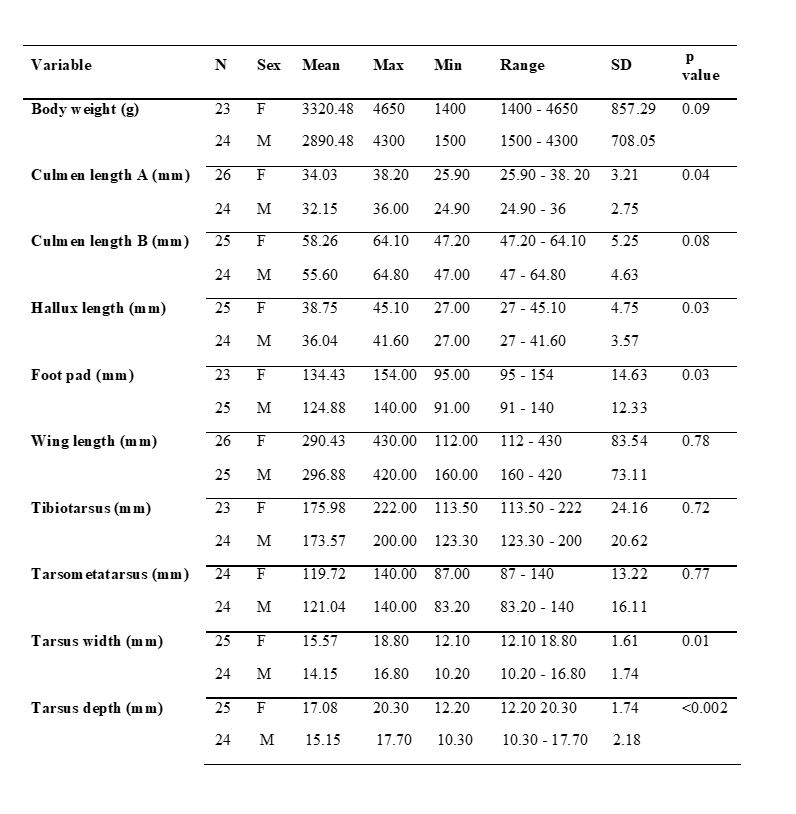
Eleven biometric measurements were attempted per chick; ten linear measurements (bill depth (mm), two different measurements of culmen length (mm), hallux (mm), length of wing (mm), foot pad (mm), length of tibiotarsus (mm), length of tarsometatarsus (mm), tarsus width (mm) and tarsus depth (mm)) and body weight (g) (Supplementary figure 1). Head, wing and leg biometrics were adapted from (Hardey 2006), with the exception of the metatarsal measurement which was an addition. One person measured all biometrics with the same equipment. Body weight was obtained with a spring balance with the chick suspended in a cloth bag (Salter Brecknell™ Super Samson). Wing, metatarsus and tarsometatarsus were measured to nearest 1mm with a 1500mm tailors tape measure, all others were measured to nearest 0.1mm with a Wiha dialMax 4112102 Sliding Clock Vernier Calliper (Wiha Tools Ltd., Bromsgrove, UK).
Molecular sexing by polymerase chain reaction (PCR)
A drop of fresh blood was obtained by brachial vein venipuncture and spotted onto either a Whatman FTA® card or Whatman FTA® Elute card (GE Healthcare, Buckinghamshire, UK) for molecular sexing (Supplementary material 5). Each card was stored in a sealed bag containing silica gel beads with moisture indicator (Fisher Scientific, Leicestershire, UK) to preserve samples whilst in the field.
Data analysis
Molecular data were analysed using Genemapper v4 to determine individual sex. All statistical analyses were performed using R version 3.5.1 (RStudio Team 2016). The ‘bill depth’ biometric was rejected due to the percentage (15%) of birds that kept the mouth open during measuring.
Univariate biometric analysis
Two-sample t-tests were performed on the remaining measurements to compare between males and females.
Principal component analyses
Two principal component analyses (PCAs) were conducted: i) using raw data to assess for size and shape of the individuals (‘Size and shape PCA’); ii) size component was removed to focus on shape (‘Shape PCA’). Both analyses looked at the combined explanatory power of all variables in determining sex. Individuals with missing measurements, due to field constraints, were removed from the PCA to retain as large a set of biometrics as possible, leaving 43 individuals in the final analyses. Body weight was removed from the PCA due to the influence lifetime food availability may have on this variable, irrespective of sex.
Shape PCA
Prior to analysis measurements were normalised to size using isometric calculations. Isometry considers whether proportions of components change during growth, acknowledging that as an individual matures its body parts increase in size but not all parts increase at the same rate. The size component of each chick’s set of biometrics were calculated using the Mosimann (1970) formula:
I = 10 ^ mean (log10 (x))
Where I represents ‘isometry’ and x is the biometric values for that chick. Using the isometric values, the measurements were normalised to the size component.
Maturation analysis
Due to the possibility that growth rates of different body parts may be neither continuous nor comparable between individuals, it was important to find a proxy for individual maturity. To investigate the relationship between age and all other variables, regression plots of each biometric against age were produced. Any biometric that showed a positive relationship with age was then assessed by linear regression against all other biometrics to look for sex differentiation.