Clinical Characteristics of Datasets
A total of 624 glioma samples from the TCGA database with sufficient IDH status were included for differential expression analysis. However, 616 samples were used for construction of the prognostic model due to eight patients without sufficient survival data. Meanwhile, there were 588 primary glioma samples from the mRNAseq_693 and mRNAseq_325 cohorts as an external validation cohort. And Table 1 showed the clinical characteristics of glioma patients in two databases. The flow diagram of the present study was provided in Fig. 1.
Table 1
Clinic pathological characteristics of glioma samples from the TCGA and CGGA databases
| Characteristics | Training cohort | Validation cohort |
| (TCGA, N = 616) | (CGGA, N = 588) |
| Age (%) | | |
| ≤ 46 | 321 (52.11) | 353 (60.03) |
| > 46 | 295 (47.89) | 234 (39.80) |
| NA | - | 1 (0.17) |
| Gender (%) | | |
| Female | 267 (43.34) | 241 (40.99) |
| Male | 349 (56.66) | 347 (59.01) |
| Grade (%) | | |
| G2 | 239 (38.80) | 208 (35.37) |
| G3 | 256 (41.56) | 169 (28.75) |
| G4 | 121 (19.64) | 211 (35.88) |
| IDH_status (%) | | |
| IDH_mut | 411 (66.72) | 309 (52.55) |
| IDH_wt | 205 (33.28) | 279 (47.45) |
| MGMT_status (%) | | |
| Methylated | 459 (74.51) | 187 (31.80) |
| Unmethylated | 149 (24.19) | 332 (56.46) |
| NA | 8 (1.3) | 69 (11.74) |
| TCGA, The Cancer Genome Atlas; CGGA, Chinese Glioma Genome Atlas; G2, grade 2; G3, grade 3; G4, grade 4; IDH, Isocitrate dehydrogenase; IDH_mut, IDH mutation; IDH_wt, IDH wild type; NA, not available. |
Correlation Between mRNAsi and Clinical Traits in Glioma Patients
The relationships between mRNAsi and some clinical information were investigated. As shown in Fig. 2C, mRNAsi was higher in glioma patients with IDH mutations (P < 0.0001). Additionally, patients older than 60 years old were associated with low levels of miRNAsi (Fig. 2A, P < 0.0001), while there was no obvious difference in gender (Fig. 2B, P = 0.69). Intriguingly, mRNAsi levels gradually decreased as the glioma grade increased (Fig. 2D, P < 0.0001). In addition, we observed that glioma patients with low mRNAsi score had an unfavorable prognosis (Fig. 2E, P < 0.0001), with an optimal cut-off value of 0.30 calculated by X-tile software. However, the difference in EREG-mRNAsi was no statistically significant (Fig. 2F, P = 0.13). Hence, we selected mRNAsi as the main trait for the next analysis.
Identification of Differentially Expressed Genes (DEGs)
Considering that mRNAsi was closely associated with glioma OS and the difference in IDH wild-type and IDH mutant glioma was significant, our aim was to investigate the DEGs between the two groups. Subsequently, the “limma” package was adopted to conduct differential expression analysis in 207 cases with wild-type IDH and 417 cases of IDH mutant gliomas after removing batch-batch differences. Using the absolute value of log2FoldChange (|log2FC|) > 1.0 and an adjusted P-value (adj.P) < 0.05 as the cut-off value, we identified 2441 DEGs (Supplementary Table 1), with up-regulation of 1616 and down-regulation of 825 DEGs.
WGCNA
Essential modules
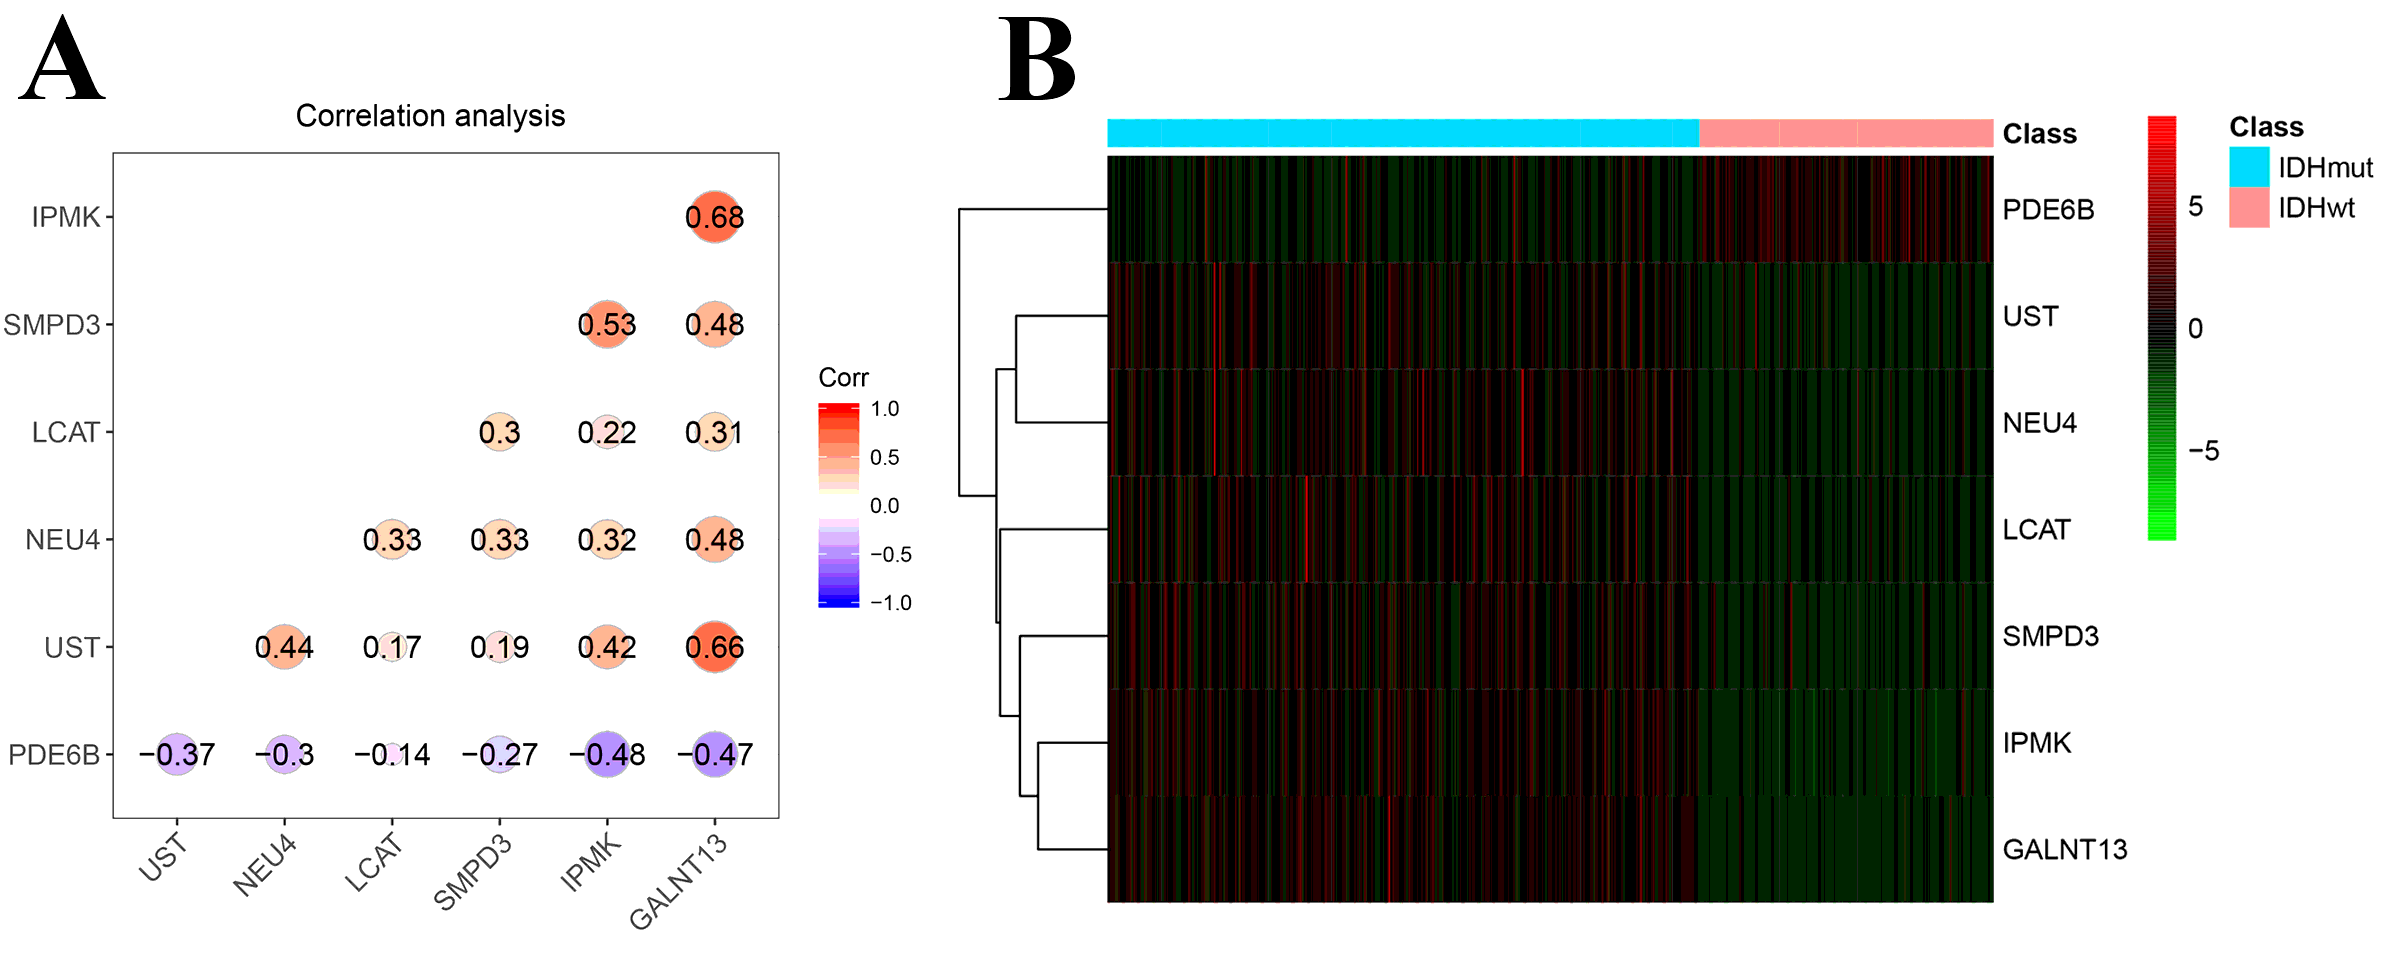
After eliminating four outlier samples (Supplementary Figure 1), a total of 2441 DEGs were used to establish a coexpression network using the “WGCNA” package . The value of β was six based on the scale-free topology distribution, making the R^2 reach 0.88 (Figure 3A). We selected 0.25 as the MEDissThres value, resulting in eight modules (black, blue, brown, green, grey, pink, red and yellow), with the gene number contributing to each ranging from 67 to 1132 (Figure 3B). Each color module represents a common gene expression module. Next, in a correlation analysis of these modules and glioma traits (mRNAsi and EREG-mRNAsi), we found that the blue (R^2=0.70, P <0.0001, Figure 3C) module was obviously positively correlated with mRNAsi and the brown (R^2=-0.6, P <0.0001, Figure 3C) module was negatively correlated with mRNAsi. Then, by application of intramodular analysis, we determined that the blue module was characterized by higher GS and MM as the most significant module (cor=0.83, P=1.3e-96, Figure 3D). Ultimately, the Venn diagram showed that a total of seven genes, including LCAT, UST, IPMK, NEU4, GALNT13, PDE6B and SMPD3 genes, were cancer stem cell-pertinent metabolic genes (Figure 3E), designated as core genes. In addition, the correlation analysis among these genes revealed that they had medium positive correlations with each other at the mRNA expression level except PDE6B, which was negatively correlated with other genes (Supplementary Figure 2A). Meanwhile, higher PDE6B expression was observed in IDH wild-type glioma patients via a hierarchical clustering heatmap (Supplementary Figure 2B).
Functional enrichment analyses
To further describe the functions of the genes in the blue module, gene ontology (GO) terms and Kyoto Encyclopedia of Genes and Genomes (KEGG) pathway enrichment analyses were undertaken. As shown in Figure 4, the GO chord plots of GO term and KEGG pathway enrichment analyses indicated that the blue module’s genes were mainly enriched in regulation of the membrane potential, postsynapse, ion channel activity (GO terms, Figure 4A-C), neuroactive ligand-receptor interaction and the cAMP signaling pathway (KEGG, Figure 4D).
Survival Analysis
To explore the prognostic value of core genes in glioma, the best truncation values were determined by X-tile software and glioma patients were classified into high/low expression groups. Of note, KM survival curves denoted that most of the core genes with low expression were associated with unfavorable OS (P <0.0001, Figure 5A-F). By contrast, high expression of PDE6B was associated with a worse prognosis for glioma patients (P <0.0001, Figure 5G). Next, we included all core genes for univariate Cox regression analysis, where the results demonstrated that six core genes (HR <1.0, P <0.0001, Table 2) were protective factors of glioma, other than PDE6B, which had an HR value of 1.257 (95%CI: 1.187-1.33) (P <0.0001, Table 2), functioning as a risk factor.
Construction of a Prognostic Signature
Multivariate Cox proportional hazard regression analysis with the AIC algorithm had identified a four gene-based signature, including LCAT, UST, GALNT13 and SMPD3 genes (Table 2, Figure 6A), with the coefficients of the four core genes used to calculate the risk score according to equation 1. The risk score formula was as follows: risk score = (-0.028787) * LCAT expression level + (-0.024918) * UST expression level + (-0.031937) * GALNT13 expression level + (-0.26647) * SMPD3 expression level, which had the minimal AIC value of 2158.69 and C-index of 0.798 (95%CI: 0.769-0.827). Additionally, survival curve revealed that glioma patients with high risk score had worse OS than low risk patients (Figure 6B, HR=5.992, 95%CI: 4.373-8.209, P<0.0001). The 5-year survival rates were separately 8.79% and 69.2% in high and low score groups classified by an optimal cut-off value of 1.659003. Furthermore, a GO chord plot demonstrated that four genes were enriched in ammonium ion metabolic process, glycoprotein biosynthetic process, dermatan sulfate biosynthetic process, steroid esterification (GO term, category = “BP”, Figure 6C) and O-acyltransferase activity (GO term, category = “MF”, Figure 6C).
Assessment of the Prognostic Value of the Four-gene-based Signature
We used the TCGA cohort to internally verify the prognostic performance of the risk score model. Firstly, the area under the curve (AUC) of the time-dependent ROC curves were 0.845, 0.85 and 0.811 for 1-year, 3-year and 5-year OS, respectively (Figure 6D). Second, we evaluated whether the four-gene-based signature was an independent prognostic indicator of the glioma. According to the result of univariate Cox regression analysis, we did not take the gender trait (HR=1.113, 95%CI: 0.849-1.458, P=0.439, Table 3) into consideration for performing multivariate Cox regression analysis. Then we used a forest plot to show that the risk score (HR=2.840, 95%CI: 1.961-4.113, P <0.001, Figure 6E, Table 3) was an independent prognostic factor via multivariate Cox regression analysis combining significant clinical traits, such as age ( ≥60 vs. <60), tumor grade (HGG vs. LGG), MGMT status (unmethylated vs. methylated) as well as histological subtypes (ASTR vs. GBM; ODG vs. GBM; mixed glioma vs. GBM). Intriguingly, compared with GBM, astrocytoma (ASTR, HR=0.401, 95%CI: 0.265-0.607, P<0.001), oligodendroglioma (ODG, HR=0.332, 95%CI: 0.204-0.541, P<0.001) and mixed glioma (HR=0.393, 95%CI: 0.233-0.661, P<0.001) were pertinent to better prognosis of glioma patients. Remarkably, age (HR=2.137, 95%CI: 1.511-3.021, P<0.001), tumor grade (HR=2.461, 95%CI: 1.632-3.713, P<0.001) and MGMT status (HR=1.680, 95%CI: 1.248-2.261, P<0.001) were significantly associated with gliomas’ prognosis, with a C-index of 0.854 (95%CI: 0.830-0.878). Table 3 showed the results from the univariate and multivariate Cox regression analyses. A nomogram integrating the prognostic model and the above mentioned clinical characteristics was developed for predicting the 1-OS, 3-OS, and 5-OS of glioma patients (Figure 6F). Additionally, calibration curves (Figure 6G) were adopted to evaluate the consistency between the predictive values from the nomogram and observed values in 1-OS , 3-OS and 5-OS of glioma patients, showing that the nomogram had superior predictive capacity.
Validation of the Prognostic Model
We selected a total of 588 glioma patients from the CGGA database as an external validation cohort. Based on equation 1, the risk score of each patient was calculated. Then, KM survival curve revealed that the high risk glioma population had worse OS than low risk patients, grouped by a optimal cut-off value of 0.2926944, and these results were consistent with the TCGA training set (Figure 7A). And the 5-year survival rates of high and low risk patients were 28.50% and 66.30%, respectively. The risk distribution, patients survival status as well as the heatmap of the four gene-based signature were also depicted (Figure 7B). Then, the AUC of the ROC curves for 1-year, 3-year and 5-year OS were 0.758, 0.763 and 0.738, respectively (Figure 7C). Also, multivariate Cox proportional hazard regression analysis for the risk score and clinical characteristics (such as age, glioma grade, MGMT status and histological subtypes) was performed, indicating that the risk score (HR=1.423, 95%CI: 1.104-1.834, P=0.0065) was an independent prognostic indicator (Figure 7D), with a C-index of being 0.783 (95%CI: 0.759-0.807). Additionally, we constructed a nomogram via multivariate Cox regression analysis for the risk score and clinical traits (Figure 7E). We found that ASTR and GBM had higher scores than oligoastrocytoma (OAST) and ODG patients in the nomogram, which might be related to the presence of anaplastic astrocytoma (AASTR) in the ASTR patients. Ultimately, the calibration curves (Figure 7F) discovered that the nomogram had good predictive performance for the 1-OS, 3-OS, and 5-OS of glioma patients.
Comparison of the Four Gene Expression Levels using the CGGA Cohort
We used the CGGA dataset to compare the expression of the four gene based on IDH status, denoting IDH mutant glioma with higher LCAT (Figure 8A, P<0.0001), UST (Figure 8B, P<0.0001), GALNT13 (Figure 8C, P<0.0001) and SMPD3 (Figure 8D, P<0.0001) levels. Also, we performed survival analyses to determine the impact of the four core genes on glioma survival. The results indicated that these core genes with high expression were involved in favorable prognosis of the glioma (Figure 8E-H, P<0.001).
Immunohistochemistry
Due to the absence of immunohistochemical results of the LCAT protein in normal brain and glioma tissues in the HPA database, the comparison between the two groups were unavailable. Compared with normal cerebellum tissues, the UST, GALNT13 and SMPD3 brown protein granule in LGG and HGG tissues were decreased (Figure 9), indicating that the consistent results of gene and protein expression in three core genes.
TABLE 2 Univariate and Multivariate Cox regression analysis of the core genes
|
Genes
|
Univariate analysis
|
Multivariate analysis
|
|
HR
|
95%CI
|
P-value
|
HR
|
95%CI
|
P-value
|
Coef.
|
|
LCAT
|
0.937
|
0.920-0.954
|
<0.0001
|
0.972
|
0.955-0.989
|
0.00124
|
-0.028787
|
|
UST
|
0.94
|
0.926-0.954
|
<0.0001
|
0.975
|
0.958-0.993
|
0.00767
|
-0.024918
|
|
IPMK
|
0.466
|
0.392-0.553
|
<0.0001
|
|
|
|
|
|
NEU4
|
0.937
|
0.921-0.953
|
<0.0001
|
|
|
|
|
|
GALNT13
|
0.938
|
0.928-0.949
|
<0.0001
|
0.969
|
0.954-0.984
|
<0.0001
|
-0.031937
|
|
PDE6B
|
1.257
|
1.187-1.33
|
<0.0001
|
|
|
|
|
|
SMPD3
|
0.686
|
0.630-0.747
|
<0.0001
|
0.766
|
0.707-0.831
|
<0.0001
|
-0.26647
|
HR, hazard ratio; Coef, coefficients; CI, confidence interval; LCAT, Lecithin-Cholesterol Acyltransferase; UST, Uronyl 2-Sulfotransferase; IPMK, Inositol Polyphosphate Multikinase; NEU4, Neuraminidase 4; GALNT13, Polypeptide N-Acetylgalactosaminyltransferase 13; PDE6B, Phosphodiesterase 6B; SMPD3, Sphingomyelin Phosphodiesterase 3; Bold text shows the P-value less than 0.05.
TABLE 3 The univariate and multivariate Cox regression analyses for clinical characteristics
|
Traits
|
Univariate
|
Multivariate
|
|
HR
|
95%CI
|
P-value
|
HR
|
95%CI
|
P-value
|
|
Age
|
5.688
|
4.262-7.591
|
<2e-16 ***
|
2.137
|
1.511-3.021
|
1.75e-05 ***
|
|
Gender
|
1.113
|
0.849-1.458
|
0.439
|
-
|
-
|
-
|
|
Grade
|
5.327
|
3.699-7.673
|
<2e-16 ***
|
2.461
|
1.632-3.713
|
1.76e-05 ***
|
|
Risk_Score
|
7.315
|
5.424-9.865
|
<2e-16 ***
|
2.840
|
1.961-4.113
|
3.28e-08 ***
|
|
MGMT_status
|
3.326
|
2.516-4.397
|
<2e-16 ***
|
1.680
|
1.248-2.261
|
0.000622 ***
|
|
Histological subtypes
(Ref.=GBM)
|
|
|
|
|
|
|
|
ASTR
|
0.126
|
0.088-0.180
|
<2e-16 ***
|
0.401
|
0.265-0.607
|
1.56e-05 ***
|
|
ODG
|
0.068
|
0.044-0.103
|
<2e-16 ***
|
0.332
|
0.204-0.541
|
9.64e-06 ***
|
|
Mixed_glioma
|
0.084
|
0.054-0.132
|
<2e-16 ***
|
0.393
|
0.233-0.661
|
0.000440 ***
|
MGMT, O-(6)-methylguanine-DNA methyl transferase; GBM, glioblastoma; ASTR, astrocytoma; ODG, oligodendroglioma; HR, hazard ratio; Bold text shows the P-value less than 0.05; ***, P<0.0001.
