Particle size of WPEs
Table 1
Effect of different homogenization methods on particle size (D4, 3) and zeta potential of WPEs
|
Samples
|
Particle size (D4, 3)
|
Zeta potential
|
|
Untreated WPE
|
14.17 ± 0.43b
|
-22 ± 0.49a
|
|
Conventional homogenized WPE
|
32.49 ± 0.39a
|
-26 ± 0.36b
|
|
Microfluidized WPE
|
10.03 ± 0.56c
|
-28 ± 0.45c
|
Different letters within homogenization methods (Untreated WPE, Conventional homogenized WPE, Microfluidized WPE) and WPE property are significantly different at the 0.05 level
The homogenization method significantly affected the particle size of the emulsion. As seen in Table 1 and Fig. 2, the particle size (D4, 3) of the untreated WPE is primarily distributed in the 10 µm-90 µm range, with a peak around 14 µm, while the particle size of the WPE produced by conventional homogenization was the largest. This indicates that conventional homogenization caused demulsification, aggregation of protein molecules, and a macromolecular state of oil droplets (Oliete et al., 2019; Verma, Tarafdar, Mishra, et al., 2021). Compared with the previous two samples, WPE treated by microfluidization had the smallest droplet size and most uniform distribution. This was due to the dispersion and division of the macromolecules caused by higher pressures and a stronger shear effect on the emulsion during microfluidization (Pierron et al., 2019). Therefore, microfluidization homogenization can ensure efficient protein aggregate disruption and small droplet size to obtain a more stable emulsion (Oliete et al., 2019).
Zeta potential of WPEs
Zeta potential is an indicator of particle stability and increases when particle charges are high enough to repel each other (Guldiken et al., 2018). The zeta potential of three emulsion samples did not significantly change with different homogenization methods but tended to decrease in the following order: microfluidication < conventional homogenization < untreated (Table 1). This indicates that there were more negative charges on the surface of WPE proteins produced by microfluidication, and that more negative charges on the surface and higher electrostatic repulsion prevented droplet polymerization. A similar explanation has been proposed by Ravindran et al. (2018), who revealed that electrostatic interactions are the primary repulsive effect that maintains emulsion stability. This confirms that WPE prepared by microfluidization was more stable and that microfludidization was superior to other methods.
Rheological properties of WPEs
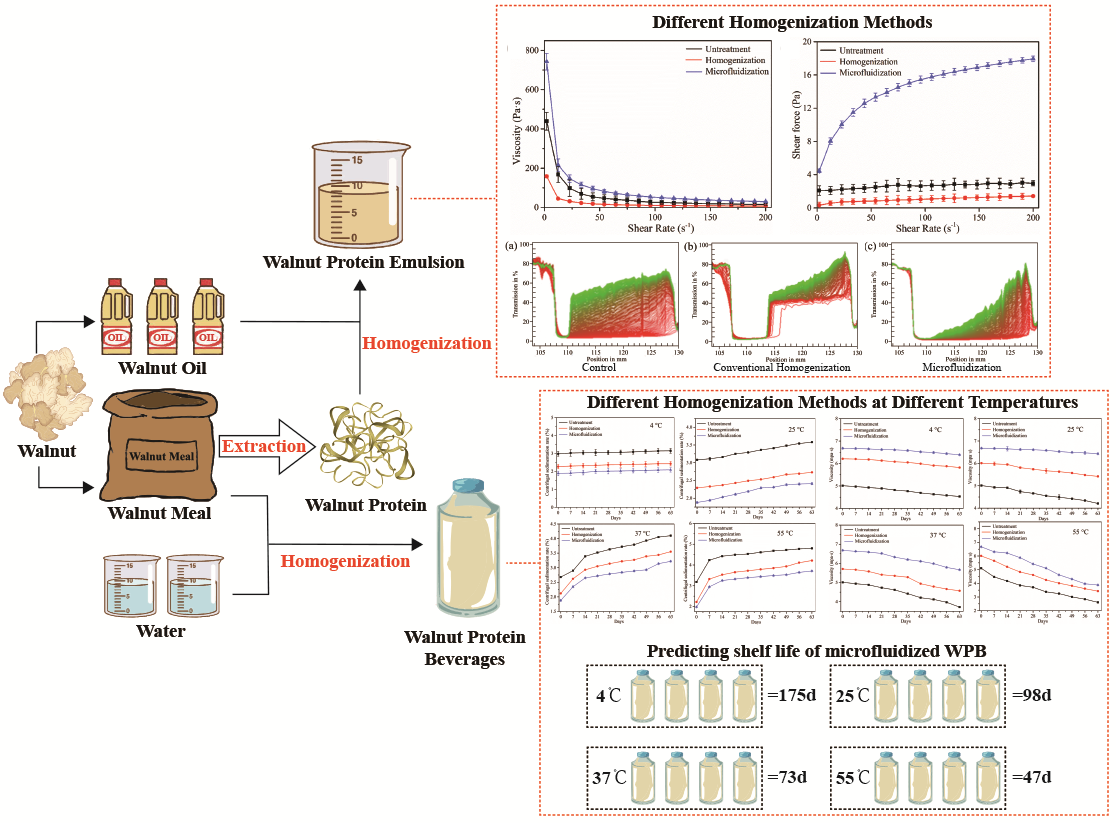
The apparent viscosity is the reverse force produced by the fluid resisting the external shear stress and is related to the attraction between molecules in the fluid (Colodel et al., 2019). Strong intermolecular interactions were generally resulted in high viscosity (Evangelista et al., 2020, Li et al., 2021). The effect of different homogenization methods on the apparent viscosity versus the shear rate of WPEs is displayed in Fig. 3a. As the shear rate increased, the viscosity of the microfluidized WPE declined rapidly from 743 mPa·s to 147 mPa·s (which was the largest decrease), and the shear stress increased 4.5 times as the shear rate increased (Fig. 3b). When the shear rate exceeded 23 s-1, the apparent viscosity of emulsions steadily declined as the rate increased. The microfluidized WPE exhibited typical non-Newtonian fluid (shear thinning) behavior and had a higher viscosity than the other two WPEs. The formation of non-Newtonian fluids is attributed to the decomposition of the aggregated structure when the shear stress increases, which increases the attractive force between molecules (Rodriguez-Ramos et al., 2021).
Furthermore, changes in shear stress varied with the shear rate for WPEs prepared with different homogenization methods, which is displayed in Fig. 3b. The results indicated that the shear stress of the microfluidized WPE was the largest and increased fastest of all emulsions, while the other two WPEs remained essentially unchanged. Similarly, the change in the shear stress of the microfluidized WPEs were consistent with the characteristics of non-Newtonian fluids (Bi et al., 2019, Li et al., 2013). The strong interaction between molecules, such as the rotational motion, bending movement, and high-frequency dissipation of protein molecules in WPE, contributed to the rheological behavior (Li et al., 2013). The zeta potential results demonstrated increases in the negative charge and electrostatic repulsion of protein molecules, which increased the viscosity and shear stress of emulsions. Therefore, the WPE prepared by microfluidization has the best rheological properties.
Physical stability of WPEs
The LUMiSizer determined the original transmission as a function of the sample position, reflecting the physical stability of the emulsion (Cai et al., 2020, Zheng et al., 2022). Fig. 4 displays the original transmissions of WPE sample positions that were untreated, conventionally homogenized, and microfluidized. The liquid WPE levels corresponded to a position of approximately 105 mm and a position of the bottom of the sample located at approximately 130 mm. The first transmission profiles at the bottom and the last transmission profiles at the top are shown in red and green, respectively. The emulsion transmission peaks varied widely with different treatments. The transmission of untreated WPE slowly changed over a long time and a sharp front was not observed (Fig. 4a). The creaming layer of untreated WPE was approximately 2.5 mm and the final integral transmission was approximately 70%. Fig. 4b indicates that the shape of conventional homogenized WPE broadened in the early stage of analysis, after which a gentle slope slowly formed. The creaming layer of conventional homogenized WPE was approximately 7 mm and the final integral transmission was approximately 80%. As shown in Fig. 4c, the transmission peak of the microfluidized WPE was lower and narrower than that of untreated and conventional homogenized WPEs, indicating that microfluidized WPE particles have the best homogeneity and collectivity of all three samples. Therefore, the physical stability of microfluidized WPE was relatively better than that of untreated and conventional homogenized WPEs. This can be attributed to a decrease in protein granules after microfluidization, and higher adsorption of protein molecules on the oil-water interface, which maintains emulsion stability (Cai et al., 2020).
Thermodynamic properties of WPEs
The thermal properties of WPEs obtained using the three homogenization methods are shown in Fig. 5. The heat flow of the three samples followed a unimodal distribution at all temperatures, and the transition midpoint represents the denaturation temperature. This indicates the high purity of the walnut protein (Hu et al., 2020). All three WPEs showed obvious endothermic peaks (transition midpoint) from 120℃ to 180℃, which indicates protein denaturation. The accurate denaturation temperatures of WPEs obtained by non-homogenization, conventional homogenization, and microfluidization were 135.65℃, 144.52℃, and 154.87℃, respectively, and the enthalpies (△H) that were 89.48 J ·g-1, 102.1 J ·g -1 and 111.76 J ·g -1, respectively. These results demonstrated that the denaturation temperature and enthalpy of microfluidized WPE were higher, indicating that microfluidization can produce WPE with better thermal stability than traditional methods. The reason for this phenomenon could be that stretching protein molecules during the microfluidization process changed surface hydrophobicity (Du et al., 2020). Initially, the WPE proteins were hydrophilic. The protein molecules further denatured and aggregated during the DSC detection process, which broke the combination of the protein molecules and the water solvent. This made it more difficult to swell, thermally stabilizing the walnut protein (Q. Zhu et al., 2018).
Color of WPBs during storage at different temperatures
Color measurement of WPBs was performed using the CIE system. In walnut protein beverages, color is a significant evaluation index for the consumer to assess freshness. Different homogenization methods were used to increase the stability of WPBs to maintain the color of the beverage and improve the attractiveness of WPBs. This method could be a substitute for an artificial color retention agent.
Table S1 indicates that the L* value of WPBs followed an overall downward trend and declined as temperature increased during storage. However, microfluidized WPB was always the brightest in the L* value, which indicates that microfluidization can protect the brightness of beverages better than other homogenization methods. The decline of brightness at 55℃ was significantly greater than at 4℃, 25℃, and 37℃. This could be because chromogenic substances in the emulsion decomposed and temperature increased accelerated the reaction process (Cheng et al., 2018). As shown in Table S1, the a* value of WPBs was initially close to 0 and the b* value exceeded a* at the beginning of storage. Subsequently, both the a* value and b* value increased, though the b* value increased more rapidly. This indicates that the initial emulsion had a yellow color, which deepened early in the storage period and tended to turn red. This phenomenon was primarily caused by the Maillard reaction. Both the a* value and b* value of the microfluidized WPB was always lower than the other samples at a different temperature, which also indicates that WPB was closer to its original color after microfluidization. Additionally, total color differences (ΔE) refer to the magnitude of the color difference between fresh WPB and WPB with different homogenization methods under different storage conditions. As shown in Fig. 6, the ΔE of WPBs after conventional homogenization and microfluidization had a significant relationship at 4℃, 25℃, 37℃, and 55℃ (P< 0.05). The variation range of ΔE increased as the temperature increased, since the high storage temperature accelerated the Maillard reaction and produced distinct changes in color. Microfluidization effectively prevented the discoloration of WPB in low-temperature conditions.
Centrifugal sedimentation rate of WPBs during storage at different temperatures
The centrifugal precipitation rate is commonly used to characterize the stability of a beverage system and reflects the number of unstable particles in the solution. The larger the centrifugal sedimentation rate, the more sedimentation caused by the aggregation of emulsion particles (Li et al., 2019). As shown in Fig. 7, the centrifugal sedimentation rate of the three WPB samples stored at 4℃ changed slightly and the centrifugal sedimentation rate of WPBs steadily increased with storage time when stored at 25℃. However, at a storage temperature of 37℃, there was a rapid growth of the centrifugal sedimentation rate from 0 to 14 d, and a slow increase in later periods. At 55℃, the centrifugal sedimentation rates of WPBs had the same development trend as at 37℃, but they were higher than the centrifugal sedimentation rate at 37℃. During storage, the centrifugal sedimentation rates of untreated, conventional homogenized, and microfluidized WPBs increased from 2.98%, 2.22%, and 1.98% to 4.8%, 4.21%, and 3.71%, respectively. This demonstrates that the centrifugal precipitation rates of WPBs treated by different homogenization methods increased as the temperature increased. This could be because temperature increases increased the energy of molecules in the emulsion, intensifying the movement of molecules and making it easier for them to aggregate due to collisions (Bakkalbasi et al., 2015). The centrifugal precipitation rate of microfluidized WPB was at its lowest level at different temperatures because the macromolecules in the emulsion were greatly reduced after microfluidization. Therefore, microfluidization can improve storage stability by producing a low centrifugal precipitation rate.
Viscosity of WPBs during storage at different temperatures
As shown in Fig. 8, the viscosity of the three WPBs stored at 4℃ changed slightly. As the storage temperature increased, the viscosity of the beverages decreased more quickly. There were rapid decreases in viscosity at storage temperatures of 37℃ and 55℃, which could be due to the gradual aggregation of small molecules in the beverage as storage time increased. This reduces the attractiveness of the molecules (Manassero et al., 2019). Moreover, polysaccharides are prone to slight degradation as storage time increases, which reduces the viscosity of the beverage (Wan & Xu, 2018). However, the viscosity of the microfluidized WPB was always greater than the viscosity of the beverages treated with the other two methods, under all storage conditions. This indicates that WPB treated with microfluidization can keep small molecules stable for a long time at room temperature.
Predicting Shelf Life Of Microfluidized Wpb
WPB produced by microfluidization maintained its high quality at different storage temperatures compared with other WPBs. Therefore, the shelf lives of microfluidized WPB under different storage temperatures (4℃, 25℃, 37℃, and 55℃) were studied. WPB quality decreases during storage, which is reflected in changes in characteristic indicators. Changes in the acidity of WPBs were analyzed at different storage temperatures. As shown in Table S2, the acidity of the WPB rose rapidly as the storage temperature increased, while the fitted first-order kinetic model had a high R2 value (R2 > 0.95) at four storage temperatures. The model equations at 4℃, 25℃, 37℃, and 55℃ were y = 0.004034172*x + 8.41, y = 0.007007428*x + 8.41, y = 0.00907761*x + 8.41, and y = 0.017194334*x + 8.41, respectively. Therefore, we used a first-order kinetic model to study the changes in acidity in microfluidized WPB.
The Arrhenius approach is the most popular method for predicting shelf life, and describes the relationship between food spoilage rate and temperature. This is displayed in Eq. (5) (Gorji & Mohammadi, 2013):
$$k={k}_{0}\text{e}\text{x}\text{p}(-Ea/RT)$$
6
Where k is the reaction rate constant, k0 is the pre-exponential factor, Ea is the activation energy, R is the universal gas constant, and T is the absolute temperature.
After obtaining the k value at different temperatures using Eq. (5), the plot of ln k as a function of 1/T was obtained. Values of k0 (124.37) and Ea (2923.15 KJ/mol) were calculated according to the regression equation outlined in Eq. (7) (Gorji & Mohammadi, 2013):
\(lnk=4.82-2923.15/T\) ,\({R}^{2}=0.98\) (7)
According to equations (5) and (7), the shelf life prediction model was given in Eq. (8):
\(t=\text{l}\text{n}\left(C/{C}_{0}\right)\times \text{e}\text{x}\text{p}(2923.15/T-4.28)\) , \({R}^{2}=0.9877\) (8)
Therefore, according to Table S2, the shelf-life of microfluidized WPB stored is predicted to be 175 d at 4℃, 98 d at 25℃, 73 d at 37℃, and 47 d at 55℃.