The MS group consisted of 31 females and 19 males, with a median age of 30.5 ± 9.9 years, 44 of them being diagnosed with relapsing-remitting MS (RRMS) and 6 with clinically isolated syndrome (CIS), a mean Expanded Disability Status Scale (EDSS) score of 1.8 points and a mean disease duration of 3.4 years. All the MS specific characteristics are presented in table 1. The majority of them were naive (with no previous disease modifying treatment (DMT)), only 4 patients received treatment that was interrupted in the previous year.
The HC group was assembled considering people with similar demographic features as the MS group: 62% females and 38% males, a median age of 28 ± 9.7 years.
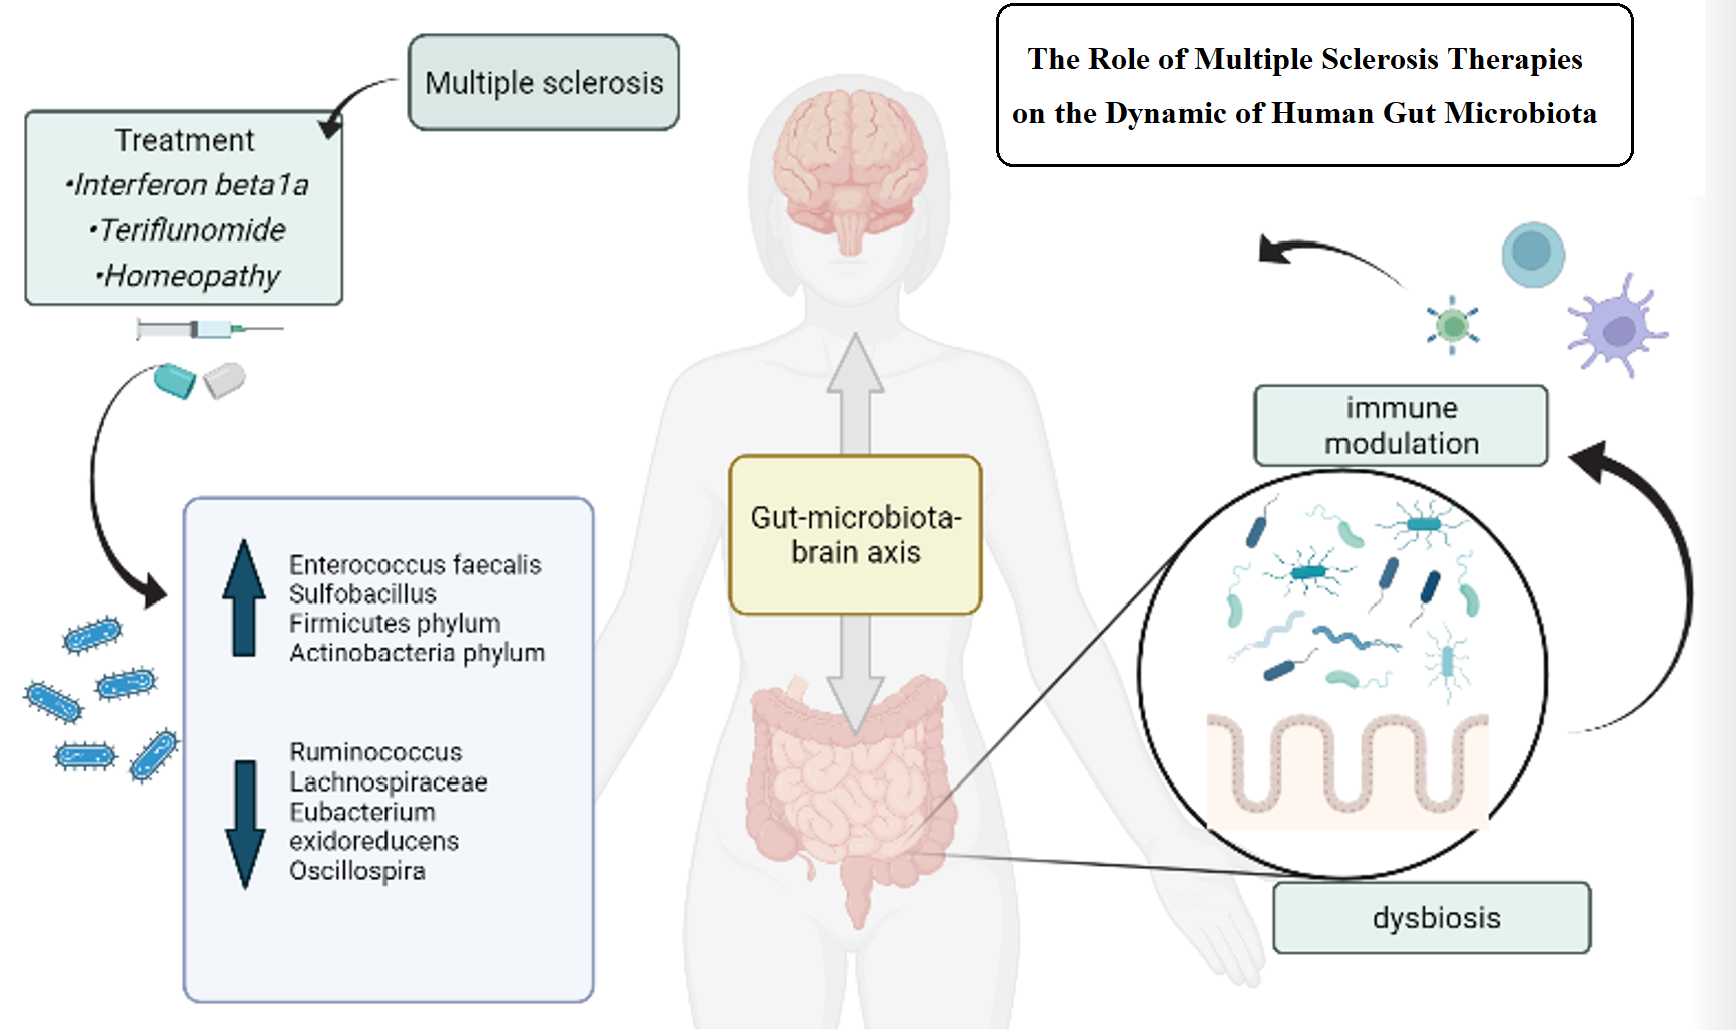
All subjects were separated into four different groups, presented in table 2. Group 1 (G1) received a form of DMT: either interferon beta1a (subgroup G1A), or teriflunomide (subgroup G1B). Group 2 (G2) agreed on a combination of DMT and homeopathy: subgroup G2A with interferon beta1a and homeopathy, subgroup G2B with teriflunomide and homeopathy. Group 4 (G4) was composed of patients who refused conventional therapy and accepted homeopathic treatment. Group 5 (G5) was formed of HC.
Regarding the homeopathic treatment distribution, each patient received a personalized medication. Both groups 2 and 4 had patients receiving one of the following: Phosphorus, Lycopodium, Natrium muriaticum, Lac Caninum, Nux Vomica, Lachezis, Nitric acid, Rhus Toxicodendron and Tarentula Hispanica. In group 2 there were also patients receiving Pulsatilla, Calcarea Carbonica, Sulphur, Ignatia, Aconitum or Causticum.
Table 1. Multiple sclerosis (MS) specific characteristics of our cohort
|
Characteristics
|
MS patients (n=50)
|
|
MS type, n (%)
|
|
|
RRMS
|
44 (88%)
|
|
CIS
|
6 (12%)
|
|
EDSS score, mean (range)
|
1.8 (0-5)
|
|
Confirmed disease duration, mean (SD) (y)
|
3.4 (6.2)
|
|
Number of relapses, mean (SD)
|
2.5 (2.13)
|
|
MMSE score, mean
|
29.4
|
|
Treatment, n (%)
|
|
|
teriflunomide
|
10 (14.28%)
|
|
interferon beta1a
|
10 (14.28%)
|
|
teriflunomide+ homeopathy
|
10 (14.28%)
|
|
interferon beta+ homeopathy
|
9 (12.8%)
|
|
homeopathy
|
11 (15.7)
|
Abbreviations: MS=multiple sclerosis, n=number of patients, SD=standard deviation, y=years, RRMS= relapsing-remitting MS, CIS= clinically isolated syndrome, EDSS=Expanded Disability Status Scale, MMSE=Mini-Mental State Exam.
Table 2. Group naming convention
|
Group
|
Number of subjects
|
Subgroup
|
Number of subjects
|
|
G1 (DMT)
|
20
|
G1A (interferon beta1a)
|
10
|
|
G1B (teriflunomide)
|
10
|
|
G2 (DMT+ homeopathy)
|
19
|
G2A (interferon beta1a+ homeopathy)
|
9
|
|
G2B (teriflunomide+ homeopathy)
|
10
|
|
G4 (homeopathy)
|
11
|
|
|
|
G5 (HC)
|
21
|
|
|
|
G1G2G4 (all MS patients)
|
50
|
|
|
Table 2 summarizes the acronyms we use for groups identification.
Abbreviations: DMT=disease modifying treatment, HC=healthy controls
3.1. Microbiome diversity
We studied overall differences in microbial composition by using alpha and beta diversity. There was no statistically significant difference in alpha diversity between MS patients and HC before (p=0.85) and after the treatment (p=0.95), between other group combinations ,for sample 2 (S2): G1 vs G2 (p=0.89), G2 vs G4 (p=0.98), G1 vs G4 (p=0.64), and their subgroups, G2A vs G2B (p=0.23), G1A vs G2A (p=0.06) between sample 1 (S1) and S2 for MS patients (p=0.93), G2 (p=0.38) or G4 (p=0.79). Also, there was no difference in alpha diversity between the MS patients treated with DMT (G1G2) and the patients not following DMT (G4), p=0.81. All p values are presented in table 3.
As we analysed beta diversity, there was a difference for S2 between G4 and G2B (p=0.007) (figure 1) and between G4 and G1A (p=0.012), but no statistically significant difference between the MS patients and HC or between the two samples for MS patients (all p<0.05). Other results are outlined in table 3 and fig.1* (*supplementary data files).
Table 3. Overview of all p values for microbial diversity
|
Comparison
|
Alpha diversity
|
Beta diversity
|
|
Chao
|
Shannon
|
Simpson
|
Bray-Curtis
|
Jaccard
|
|
G5vsG1G2G4(S1)
|
p=0.85
|
p=0.33
|
p=0.55
|
p=0.15
|
p=0.13
|
|
G5vsG1G2G4(S2)
|
p=0.95
|
p=0.16
|
p=0.39
|
p=0.14
|
p=0.12
|
|
G1vsG2(S2)
|
p=0.89
|
p=0.69
|
p=0.59
|
p=0.85
|
p=0.9
|
|
G2vsG4(S2)
|
p=0.98
|
p=0.97
|
p=0.87
|
p=0.12
|
p=0.2
|
|
G1vsG4(S2)
|
p=0.64
|
p=0.8
|
p=1
|
p=0.15
|
p=0.13
|
|
G1G2vsG4(S2)
|
p=0.81
|
p=0.91
|
p=0.91
|
p=0.19
|
p=0.2
|
|
G1AvsG2A(S2)
|
p=0.06
|
p=1
|
p=0.84
|
p=0.06
|
p=0.06
|
|
G1BvsG2B(S2)
|
p=0.13
|
p=0.68
|
p=0.68
|
p=0.23
|
p=0.35
|
|
G2AvsG4(S2)
|
p=0.47
|
p=0.41
|
p=0.66
|
p=0.06
|
p=0.06
|
|
G2BvsG4(S2)
|
p=0.55
|
p=0.39
|
p=0.47
|
p=0.007
|
p=0.012
|
|
G1AvsG4(S2)
|
p=0.2
|
p=0.35
|
p=0.72
|
p=0.012
|
p=0.016
|
|
G1BvsG4(S2)
|
p=0.62
|
p=0.62
|
p=0.72
|
p=0.62
|
p=0.33
|
|
G2AvsG2B(S2)
|
p=0.23
|
p=0.14
|
p=0.14
|
p=0.06
|
p=0.11
|
|
S1vsS2(G1G2G4)
|
p=0.93
|
p=0.26
|
p=0.36
|
p=0.88
|
p=0.93
|
|
S1vsS2(G2)
|
p=0.38
|
p=0.6
|
p=0.69
|
p=0.95
|
p=0.99
|
|
S1vsS2(G4)
|
p=0.79
|
p=0.4
|
p=0.44
|
p=0.98
|
p=0.98
|
|
S1vsS2(G2A)
|
p=0.96
|
p=0.86
|
p=0.8
|
p=0.87
|
p=0.93
|
|
S1vsS2(G2B)
|
p=0.24
|
p=0.58
|
p=0.68
|
p=0.96
|
p=0.98
|
*Values in bold are statistically significant. This table presents specific comparisons between our cohorts and diversity indexes applied, along with the p value of each test.
Abbreviations: S1=sample 1; S2=sample 2;
3.2. Taxonomic differences
The 16S analysis results include the frequency and relative abundance of the species.
For the MS cohort, we identified 51 Operational Taxonomic Units (OTUs) at the phylum level, with the majority composing of Firmicutes (49.45%), Bacteroidetes (34.3%), Actinobacteria (4.77%) and Proteobacteria (3.6%). At the species level, we analysed 1505 OTUs, with the highest relative abundance of Prevotella copri (10.75%) and Bacteroides (10.3%), followed by Faecalibacterium prausnitzii (6.63%) and Blautia (4.49%).
We analysed taxonomic differences between our MS cohort (G1G2G4) and HC (G5) before any treatment (S1). Untreated MS patients presented, compared to HC, increased relative abundance of Lentisphaerae phylum (p=0.005), Prevotella stercorea species (p=0.02) (Bacteroidetes phylum). They had a decreased level of Actinobacteria phylum (p=0.01), with its species Bifidobacterium (p=0.01) and Bifidobacterium adolescentis (p=0.007), also decreased level of Bacteroides coprophilus (p=0.02) (from Bacteroidetes phylum). Firmicutes phylum has reduced relative abundance of Faecalibacterium prausnitzii (p=0.03), Lachnospiraceae (p=0.01), Staphylococcus hominis (p=0.02) and Staphylococcus bacterium (p=0.02). Proteobacteria phylum has a decreased in Haemophilus (p=0.04) and Escherichia coli (p=0.04). The other statistically significant differences are presented in figure 2A, fig.2*-4*.
When we analysed the second samples, the results for the MS treated patients compared to the HC were slightly different, with reduced Bifidobacterium (p=0.02), Ruminococcus (p=0.04) and Clostridiales (p=0.01) and a higher prevalence of Gemella (p=0.04), Megaspherae (p=0.02) and Prevotella stercorea (p=0.02) for MS patients compared to HC (figure 2B,fig.5*-7*).
We analysed different comparisons between groups after a two months treatment. When analysing the microbiota of the MS patients who received DMT (G1) compared to the patients undergoing complementary homeopathic treatment (G2), we outlined the following results. G1 had , compared to G2, enriched relative abundance for Catenibacterium (p=0.02), Lachnospiraceae (p=0.02), Sharpea (p=0.02) and Gammaproteobacteria (p=0.02) and decreased level of Shuttleworthia (p=0.04), Cytophaga (p=0.03) and Rumen (p=0.02). The G1A subgroup is more abundant in Cyanobacteria (p=0.002), Catenibacterium (p=0.01), Alloprevotella (p=0.03), Lachnospiraceae (p=0.003), Clostridium (p=0.01), Prevotella copri (p=0.04), Prevotella stercorea (p=0.03) compared to G2A, after treatment. On the other side, G2A shows higher levels of Proteobacteria (p=0.02), Escherichia shigella (p=0.01), Barnesiella (p=0.03), Serratia (p=0.008), Lactobacillus zeae (p=0.02). In the G1B group Escherichia shigella (p=0.007), Lactobacillus (p=0.01), Enterobacter (p=0.02), Enterococcus faecalis (p=0.03) is more prevalent than in G2B, while G2B shows higher signs of Rickenellaceae (p=0.01) and Lachnospiraceae (p=0.02). We also compared the two groups having received homeopathic treatment, G2 and G4. We outlined that G2 presented a higher relative abundance for Megasphaera (p=0.04), Eubacterium oxidoreducens (p=0.02), Veillonellaceae (p=0.02) and Gardnerella (p=0.02), compared to G4. G4 was enriched in Faecalibacterium prausnitzii (p=0.01), Akkermansia muciniphila (p=0.02), Lachnospiraceae (p=0.003), Bacteroides acidifaciens (p=0.04) and pectinophilus (p=0.03), Veilonella (p=0.01), compared to G2 (fig.8*-20*).
Another point of interest in our research was to emphasize how the microbiome changes in time, from the moment the patients were prescribed a therapeutic scheme (S1) until two months after the treatment began (S2). For the MS cohort, the taxonomic changes are shown in figure 3 with the most abundant 25 organisms. The statistically significant differences between the two samples were more prevalent for Firmicutes phylum, as there were identified reduced levels for Ruminococcus (p=0.03), Oscillospira (p=0.0004), Anaerotruncus (p=0.02), Lachnoclostridium (p=0.01), Lachnospiraceae (p=0.02) and Eubacterium oxidoreducens (p=0.04) in the MS patients after treatment compared to the baseline sample. The MS treated patients presented more diverse bacteria changes, with an increase in Firmicutes phylum (Sulfobacillus p=0.02, Enterococcus faecalis p=0.02), Bacteroidetes (Hymenobacter p=0.04), Proteobacteria (p=0.04), Actinobacteria (Amycolatopsis p=0.04), Fusobacterium (Leptotrichiaceae p=0.04) after treatment compared to before (fig.21*-25*).
The G2 group presented a lower relative abundance in some Firmicutes components (Oscillospira p=0.01, Lachnoclostridium p=0.03, Lachnospiraceae p=0.03) and Proteobacteria (Helicobacteraceae p=0.01, Undibacterium p=0.03) after treatment, compared to baseline. The group with only homeopathic treatment (G4) had reduced Eubacterium oxidoreducens after treatment, compared to the first sample (p=0.03) (fig.25*-32*).