Identification of differential autophagy-associated genes
All steps and processes of this study are shown in the flow chart (Fig. 1). We identified 552 autophagy-associated BC genes in total through the dataset of BC patients in TCGA and the Human Autophagy Database (HADb). Then, according to the above autophagy-associated bladder cancer genes, using Univariate COX regression analysis and differential analysis of cancer and paracancer tissues, we obtained 117 prognosis-related genes and 148 differentially expressed genes, respectively, which were merged together and obtained 44 differential autophagy-related genes (Fig. 2A). The forest map showed that TRIM2, SNRNP70, SRC, IRF5, CHMP4C were protective genes with HR values less than 1, and the rest were risk genes with HR values greater than 1 (Fig. 2B). The heat map showed the expression status of 44 genes in normal and cancerous tissues (Fig. 2C). These 44 genes were associated with each other as shown in the Protein-protein interaction (PPI) network (Fig. 2D).
Construction and validation of an autophagy-related prognostic risk model
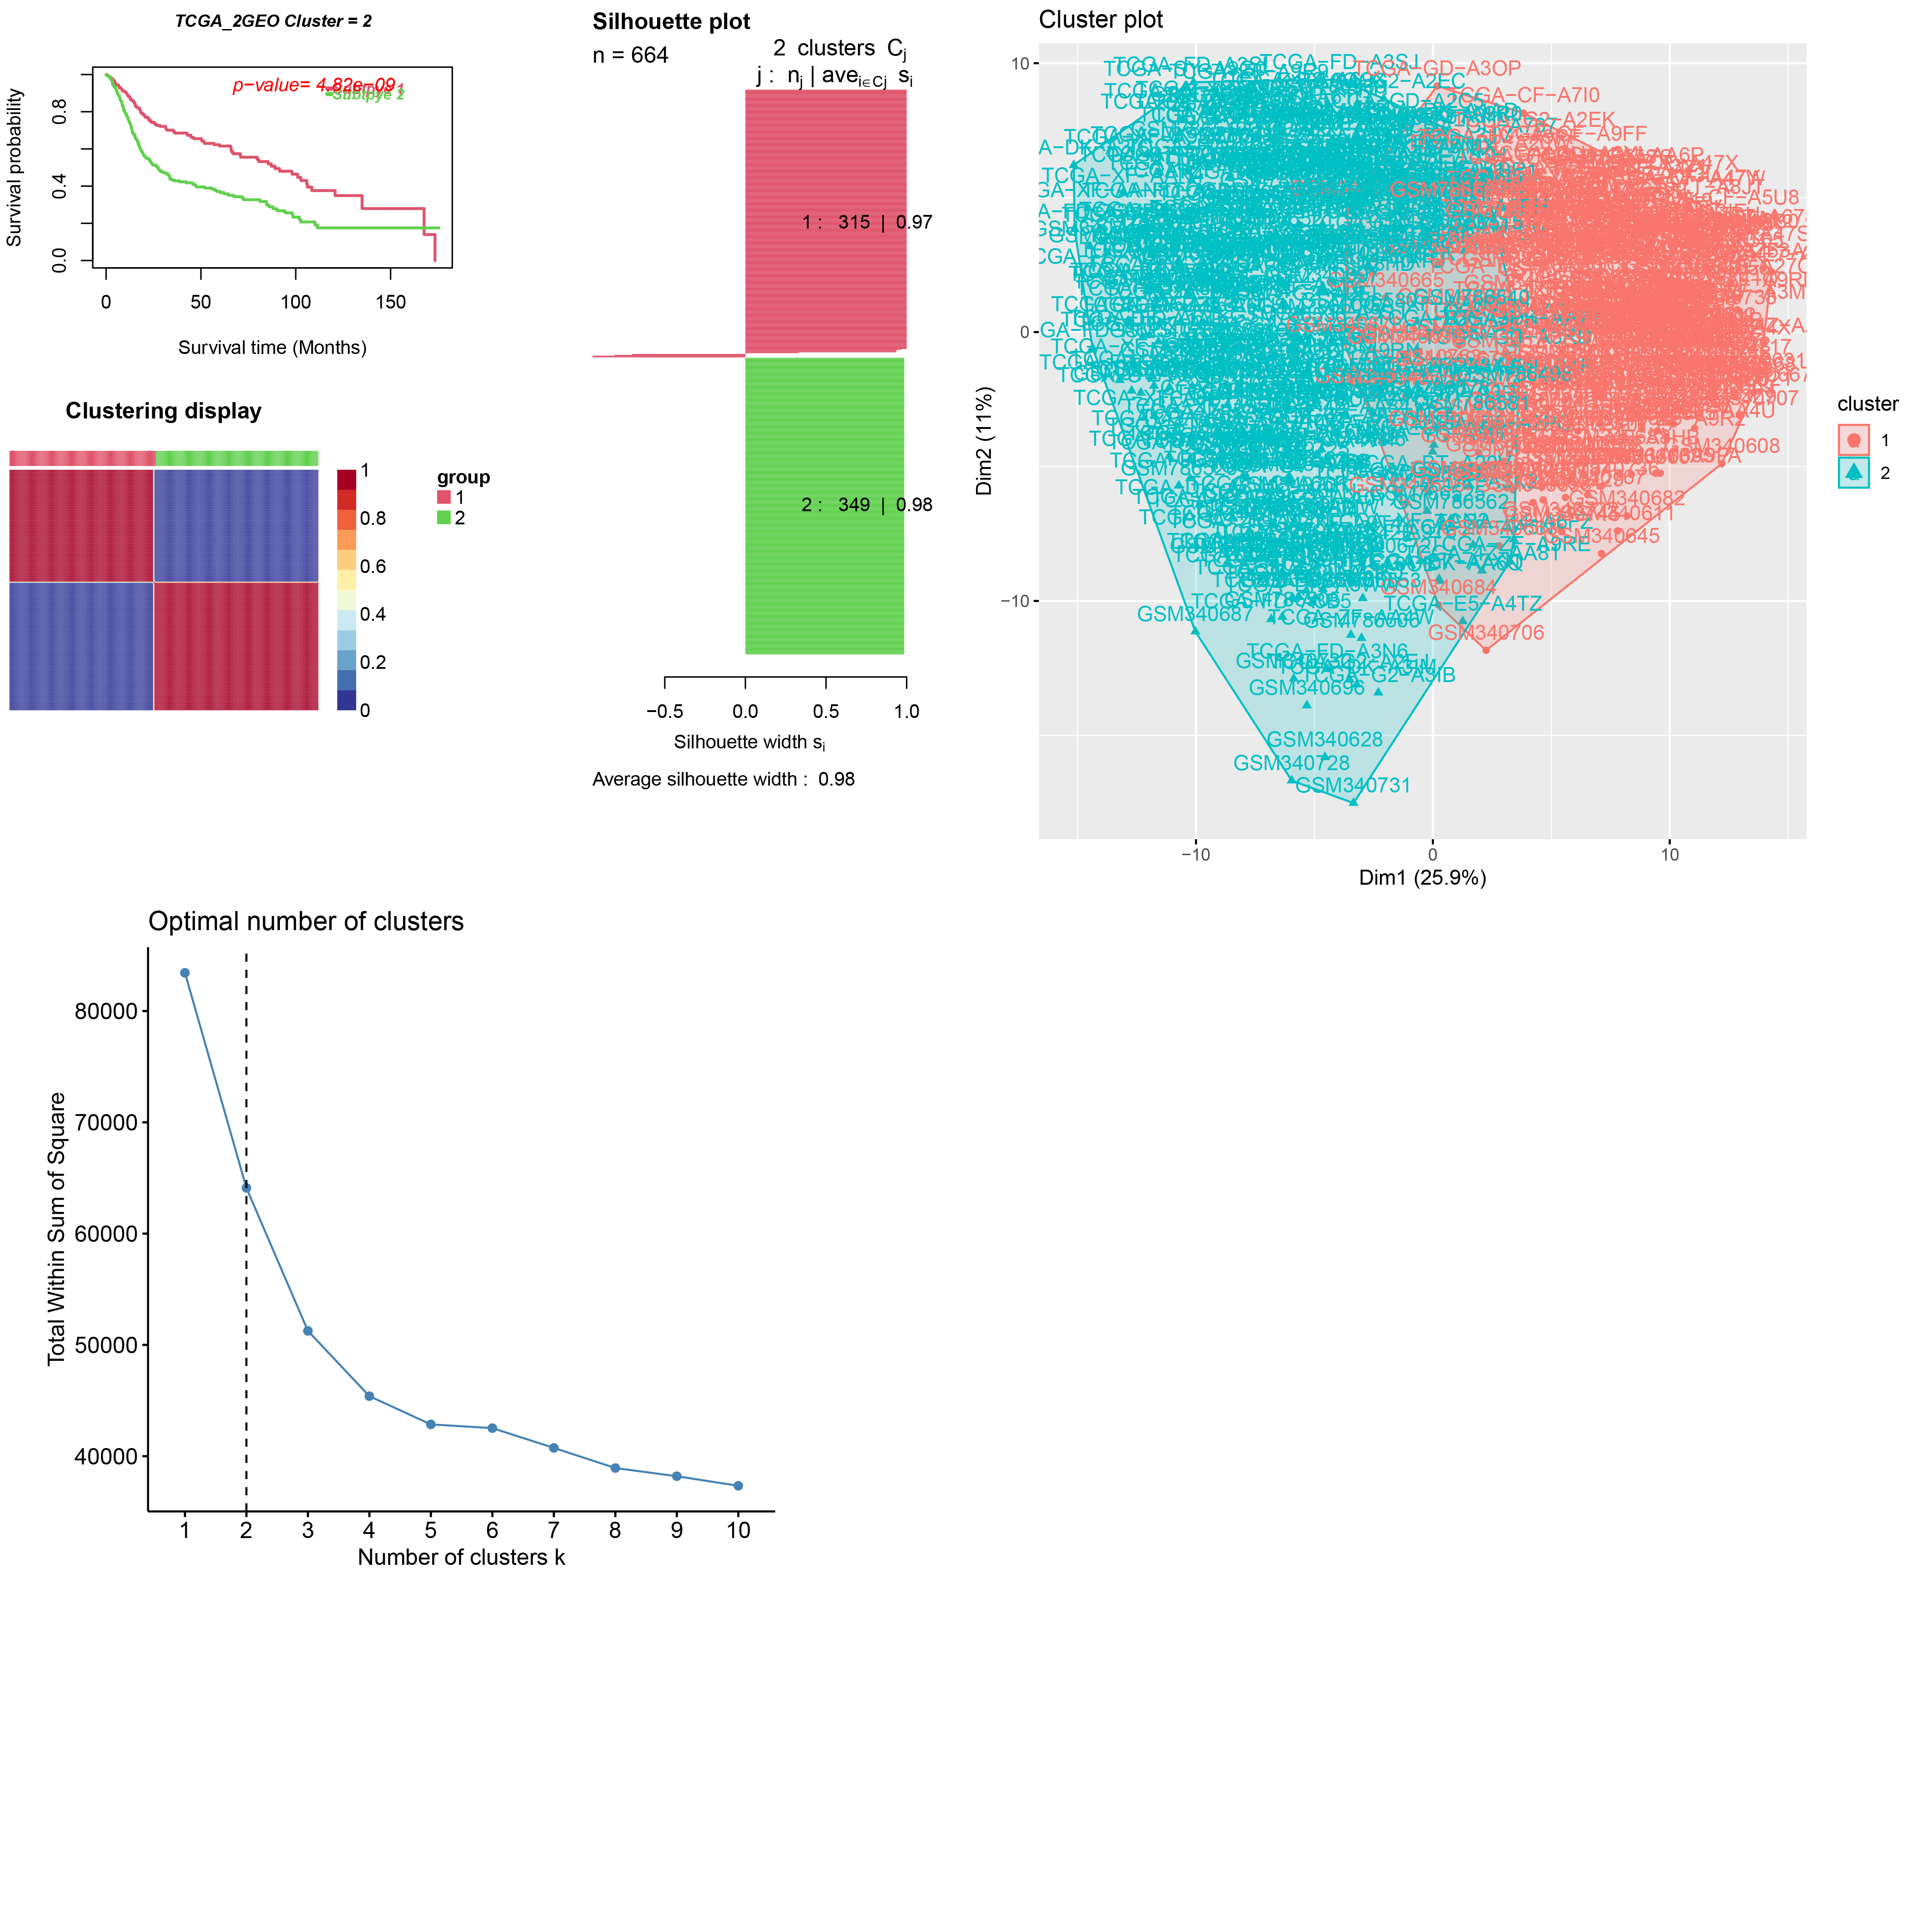
Depending on the TCGA and GSE31684/GSE15307 merged datasets with 664 samples, we finally get the expression level of 39 differential autophagy-related genes and distinguished the molecular subgroups of BC samples C1, C2. Next, we made a consensus clustering analysis, and an optimal division was reached when k = 2 according to the CDF curve of consensus score, with Average silhouette width = 0.96. According to the curve of survival probability, C2 was better than that of C1, and the visualization of the merged gene clusters was shown (Fig. 3A). Similarly, we apply the CancerSubtypes package to classify the genes of merged datasets, and the results are shown (Supplementary document 1). We further explored the prognosis of molecular and genotypes. Molecular subtypes C1 and C2 of BC, which showed significant differences in disease-specific survival (DSS), progression-free survival (PFS) (log-rank p < 0.05) and no statistically significant disease-free survival (DFS) (log-rank p > 0.05). (Fig. 3B). The results for gene clusters A and B of BC, with DSS, PFS and DFS, were similar to those of the molecular subtypes. (Fig. 3C). For selecting genes associated with prognosis, we used least absolute shrinkage and choice of operator (LASSO) regression and multifactorial COX regression algorithm (Supplementary document 2) based on the three fused datasets to construct a model (Fig. 3D).
Next, the risk scores were calculated for each BC sample and the three datasets were divided into low- and high-risk groups on the basis of the median value of the risk scores. The survival status of BC patients is shown in the plot (Fig. 4A). We then compared the overall survival of patients in the whole group, training group, and test group, respectively, and found that the overall survival of patients in the low-risk group was better than that in the high-risk group (Fig. 4B). We also analyzed the model in the all, training and test datasets separately for comparison, and the calibration curve was also close to 45° (Fig. 4C). Then we conducted ROC analysis to demonstrate the sensitivity and specificity of the survival prediction model for BC patients by assessing the area under the curve (AUC). We calculated total AUCs of 0.703, 0.679.0.661 for 1, 3 and 5 years of follow-up, respectively; AUCs of 0.616, 0.641 and 0.619 for 1, 3 and 5 years of follow-up in the test cohort; and AUCs of 0.740, 0.697 and 0.680 in the training cohort (Fig. 4D).
Nomogram Construction and Validation
we explored genes with underlying differences in molecular clusters and screened 897 genes with differences between molecular subgroups using Fdr ≦ 0.05, |LogFc|>1 as criteria, and obtained genotyping A,B using consistency clustering analysis. We demonstrated that these 6 risk genes can equally distinguish between molecular and the genotype of BC using the 6 risk genes screened, which is consistent with the previous findings. Among the molecular subtypes, SPOCD1 and NAT8B genes were highly expressed in C1, and FKBP10, LDLR, STM3, and ANXA2 were highly expressed in C2, and the results of gene clusters were the same as those of molecular subtypes (Fig. 5A). To establish the relationship between molecular subtypes, genotyping, risk scoring, and prognosis of BC, we risk scored each subclasses separately. The results showed that among the molecular subtypes, the C1 typing had a higher risk score (Fig. 5B). To evaluate the relationship between patients' clinicopathological characteristics, risk scores and overall survival, we aimed to explore whether risk scores could be used as independent predictors. The results of the univariate and multivariate COX regression analysis (Fig. 5C), showing that the risk score model we have constructed can serve as an independent prognostic factor (P value < 0.001). To predict the clinical prognosis of patients, we constructed a nomogram including age, sex, risk score and other relevant variables to predict the survival of BC patients at 1, 3 and 5 years (Fig. 5D). The line segment of the calibration curve as shown is close to the 45° line, which suggests that the model has good predictive performance (Fig. 5E).
Functional enrichment analysis and correlations between risk score and TMB
As previously described, the survival probability of C2 subgroup of bladder cancer is superior than C1. Afterward, we obtained 83 pathways totally that lead to differences between molecules with different prognostic outcomes (Supplementary document 3), 15 pathways each of upregulated and downregulated are shown here (Fig. 6A). We observed leishmania infection, hematopoietic cell lineage, cell adhesion molecules cams and other inflammation-related pathways were positively correlated with C1 subclass, but metabolic-related pathways such as Glycerophospholiplid metabolism, Alpha linolenic acid metabolism, Linoleic acid metabolism, Fatty acid metabolism were positively associated with C2 subgroup.
We also investigated the expression analysis of differential genes intrinsic to the molecular typing of BC and obtained 897 differentially expressed genes, and then we performed a functional enrichment analysis (Fig. 6B). In biological processes, these differentially expressed genes were mainly enriched in extracellular matrix organization, extracellular structure organization, negative regulation of immune system process, leukocyte cell adhesion, and cell chemotaxis processes. In cellular components, differential genes are mainly enriched in collagen_ containing, focal_ adhesion, cell_ substrate junction. In molecular functions, they are mainly enriched in extracellular matrix structural constituent, glycosaminoglycan binding, heparin binding. In KEGG, Cytokine_ Cytokine receptor interaction, P13_ Akt signaling pathway, Focal adhesion, Proteoglycans in cancer, Cell adhesion molecules and other pathways.
Next, we further verified the richness and difference of pathway enrichment in the high and low risk groups and conducted GO enrichment and KEGG pathway analysis for different risk groups (Fig. 6C). GO analysis showed that extracellular matrix structural constituent, external encapsulating structure organization, collagen containing extracellular matrix myeloid leukocyte migration, granulocyte migration were enriched in the high-risk group. KEGG pathways enrichment analysis revealed that ECM receptor interactions, focal adhesion, leishmania infection, cytokine receptor interactions were particularly significant in high-risk group.
In addition, we explored whether the TMB correlated with the risk score signature or not. we analyzed the relationship between risk groups and gene mutations. The status of the top 20 mutational genes was as shown (Fig. 6D). There is no difference in the type of these mutated genes, but TP53, RB1, and FGFR3 were highly variable across risk subgroups. We analyzed the relationship between risk score and TMB using K-M survival curves, whose results showed that the prognosis was best for low risk and high TMB and worst for high risk and low TMB.
Table 1
Comparison of clinical features within the training and validation datasets
|
Covariates
|
Type
|
Total
|
Test
|
Train
|
P value
|
|
Sex
|
Female
|
162(24.47%)
|
49(25%)
|
113(24.25%)
|
0.9154
|
|
Male
|
500(75.53%)
|
147(75%)
|
353(75.75%)
|
|
Age
|
≦ 65
|
263(39.73%)
|
76(38.78%)
|
187(40.13%)
|
0.812
|
|
> 65
|
399(60.27%)
|
120(61.22%)
|
279(59.87%)
|
|
T
|
T1-2
|
289(43.66%)
|
84(48.26%)
|
205(43.99%)
|
0.6833
|
|
T3-4
|
340(51.36%)
|
105(53.57%)
|
235(50.43%)
|
|
Unknown
|
33(4.98%)
|
7(3.57%)
|
26(5.58%)
|
|
N
|
Negative
|
434(65.56%)
|
125(63.78%)
|
309(66.31%)
|
0.8478
|
|
Positive
|
170(25.68%)
|
51(26.02%)
|
119(25.54%)
|
|
Unknown
|
58(8.76%)
|
20(10.2%)
|
38(8.15%)
|
|
Grade
|
High
|
528(79,76%)
|
151(77.04%)
|
377(80.90%)
|
0.237
|
|
Low
|
131(19.79%)
|
45(22.96%)
|
86(18.45%)
|
|
Unknown
|
3(0.45%)
|
0(0%)
|
3(0.64%)
|
|
Future state
|
Alive
|
388(58.61%)
|
107(54.59%)
|
281(60.30%)
|
0.2023
|
|
Dead
|
274(41.39%)
|
89(45.41%)
|
185(39.70%)
|
The relationship between risk scores and clinical characteristics
According to the classification of clinical characteristics, we scored the risk separately for each stratum of clinical characteristics. Based on information from the TCGA and GSE31684/GSE15307 databases, patients aged > 65 years had significantly higher risk scores in the former compared with those aged ≤ 65 years; males had higher risk scores than female patients; and high-grade had higher risk scores than low-grade patients; in addition, the T-stage (T1/ T2 and T3/T4) and N-stage (N0 and N1/N2/N3) of the tumor, the former had higher risk scores than the latter (P < 0.05); regarding the future survival status of patients, those with lower risk scores had better long-term survival status. Meanwhile, based on the molecular subclasses of BC, we performed another chi-square test for the above clinical characteristics and obtained similar results (Fig. 7A-B). We further explored the survival outcomes of patients with different clinical characteristics in different risk groups using K-M survival analysis. Among patients with higher risk scores, regardless of age > 65 or ≦ 65 years, male or female, high-grade or low-grade, T-stage (T1/ T2 or T3/T4) and N-stage (N0 or N1/N2/N3) of the tumor, risk The higher the scoring, the lower the probability of survival in the long term (Fig. 8).
The immune cell infiltration analysis, Immune checkpoint genes and Immunotherapy Response Prediction
We used the CIBERSORT and ESTIMATE algorithms to evaluate the degree of infiltration of 23 immune cell types in different BC molecular subtypes and different risk groups. According to the results, the proportion of activated B cells, activated CD4 T cells, activated CD8 T cells, myeloid-derived suppressor cellna (MDSCna), natural killer cells (NK), neutrophils, monocytes, and regulatory T lymphocytes was significantly higher in the C1 group than in the C2 group (Fig. 9A,9C). In the high-risk score group, activated CD4 T cells, activated CD8 T cells, MDSC, macrophages, mast cells, NK cells, neutrophils, plasma cells, regulatory T lymphocytes, and Type.27 helper cellna were more abundant in the high-risk group than in the low-risk group. To establish the relationship between molecular subtypes, genotyping, risk scoring, and prognosis of BC, we risk scored each subclasses separately. The results showed that among the molecular subtypes, the C1 typing had a higher risk score (Fig. 9B). As shown in Fig. 9D, high risk scores were positively associated with higher immune scores, and stromal scores. In the high-risk group, CD27, LAG3, PDCD1, CD274, CTLA4, CD276, CD44, CD48, NRP1, PDCD1LG2 checkpoint genes were highly expressed (Fig. 9E). HLA can be classified into class I, class II and class III gene regions, which are mainly involved in antigen presentation on the cell surface and in the immune regulation of the body. HLA can activate the immune response by delivering processed antigens to T lymphocytes. It has been shown that low expression of some molecules in HLA is associated with poor prognosis in some human cancers. As shown in the figure (Fig. 9F), the expression of HLA-A, HLA-B, HLA-C, HLA-DRA, HLA-DRB and other genes was significantly higher in the high-risk group than in the low-risk group. We established a correlation between immune checkpoint genes and immunophenoscore (IPS) based on the expression status of CTLA-4 and PD-1, and we compared the IPS between the high and low risk groups, whose results showed that PD-L1 and CTLA-4 gene positivity had significantly different immune responses in the high and low risk subgroups (Fig. 9G).
The sensitivity of prognostic gene expression to chemotherapy
To explore the correlation between risk genes and the efficacy of chemotherapeutic agents for BC, we used a constructed risk score model to screen these compounds for sensitive chemotherapeutic agents by analyzing the transcriptomes of 60 cancer cell lines collected from the CellMiner database based on the correlation between inhibitory concentration (IC50) and risk gene expression. All risk genes were significantly correlated with the sensitivity of some chemotherapeutic agents (P < 0.05), and the top 20 alignments with bigger |cor| are shown here (Fig. 10). Raloxifene, Etoposide, Camustine, Arsenic trioxide, Cyclophosphamide Dromostanolone, Tamoxifen and Teniposide were negatively correlated with increased expression of ANXA2 gene, but positively correlated with high expression of Lrofulven. For SPOCD1 gene, rapamycin, abiraterone, zoledronate, tromethamine, bleomycin, everolimus, and cabozantinib were found to be sensitive. Difttox ontak was shown to be sensitive to high expression of NAT8B gene, however, oxaliplatin was apparently insensitive to LDLR expression.
Signature validation in imvigor210 dataset
To prove whether the autophagy-related prognostic model constructed for the 6 risk genes is reliable, we chose to perform external validation in an additional database, IMvigor210. We calculated risk scores for 348 samples in the IMvigor210 dataset using the same formula and divided them using the same cutoff values. The results showed that in the external validation set, the overall survival rate was significantly higher in the low-risk patients compared to the high-risk group of BC patients. In addition, the different risk score distributions and the comparison of survival time and status of patients in the high and low risk groups were shown in Figure (Fig. 11A). the ROC curves showed that the model was accurate and had good predictive performance (Fig. 11B). the expression of ANXA2, LDLR, FKBP10, STMN3 genes were more highly expressed in the high-risk group, while the remaining genes were more highly expressed in the low-risk group, which was consistent with the results of the TCGA-2GEO fusion dataset. For immunotherapy response, the ratio of patients in complete remission (CR)/partial remission (PR) and stable disease (SD)/progressive disease (PD) in both risk groups was shown (Fig. 11C). we found a significant difference between the two groups. Subsequently and analyzed the differences in immune cell infiltration in different risk subgroups using ssGSEA, and the results showed a higher proportion of memory B cells, CD4 T cells, resting state NK cells, activated NK cells, activated mast cells and neutrophils in the high-risk group (Fig. 11D-E). The relationship between stromal cells, immune scoring and risk score is shown (Fig. 11F).
Validation of the expression properties of six genes using RT-qPCR and HPA
The mRNA expression levels of 6 genes were measured in normal human bladder tissues and bladder tumor tissues by using RT-qPCR. The results showed that the levels of four of the six genes (FKBP10, LDLR, STMN3, ANXA2) were significantly different between BC and normal bladder cells (Figure). Moreover, a representative IHC image of FKBP10, LDLR and ANXA2 expression levels between normal and tumor tissues in HPA was shown in Fig. 12.