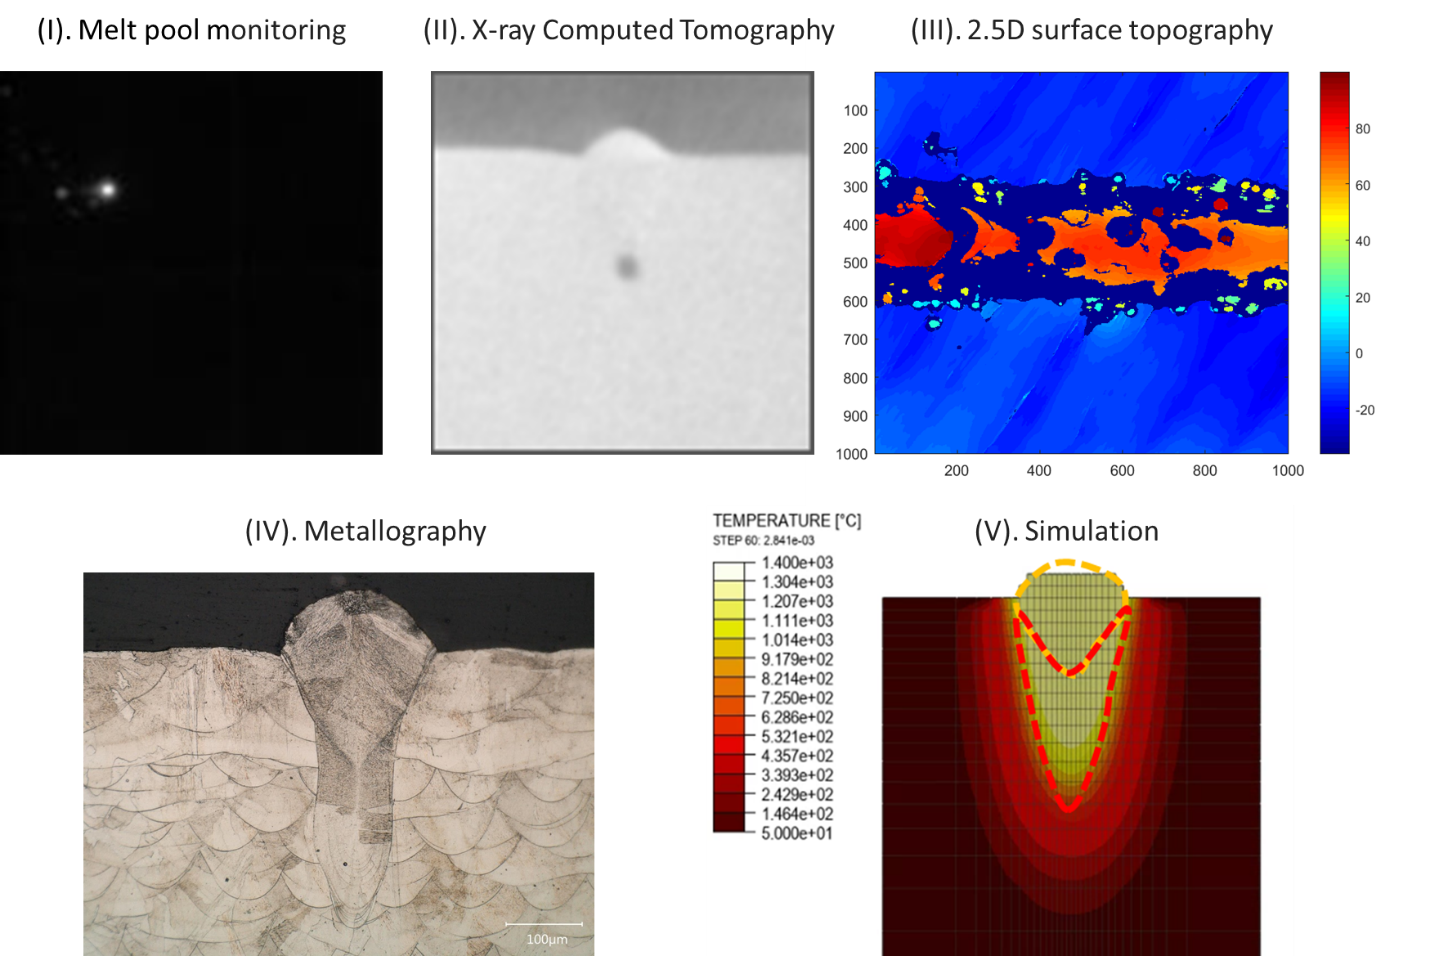
Physics-based image features related to process-related defects are studied and discussed in this section. As the resolution of the off-axis camera does not allow to individually detect the melt pool and the vapor plume, both are combined in an area that is labelled the ‘process zone’. The first part of this section discusses the process zone features extracted from off-axis camera monitoring for the line track experiment, specifically process zone area, process zone length-to-width ratio, and process zone mean intensity. The second section presents the spatter features segmented from raw images, specifically the number of spatters, spatter speed, and spatter direction. The third part shows the results of automatic spatter identification from 2.5-D surface topography measurements. The fourth subsection presents melt pool geometry features such as depth and width extracted from both finite element modeling and optical microscopy of the line tracks cross-section. In the final part, a correlation between signature features extracted from real-time monitoring data and X-ray computed tomography for the line track is discussed.
3.1 Melt pool and vapor plume feature analysis from monitoring data
Several process zone (combined melt pool and vapor plume) features are extracted, measured in the XY plane, and discussed in the current section for the line tracks. The process zone dimensions such as area and length-to-width ratio are of major importance in LPBF since these dimensions have a large influence on the process stability. The process zone area and length-to-width ratio depend on the processing parameters being used (laser power, scanning velocity) and on the thermal diffusivity of the material being processed. The melt pool will be more elongated (i.e., a larger length-to-width ratio) for the material with smaller thermal diffusivity, whereas it will lead to a more equiaxed melt pool (i.e., a length-to-width ratio closer to 1) for the material with a high thermal diffusivity. On the other hand, the influence of the processing parameters on the process zone area and length-to-width ratio is rather complex. Laser power and scanning speed are not interchangeable, i.e., the same energy density with different laser power and scanning speed will lead to different results. To understand the effect of combinations of laser power and scanning speed on process zone area and length-to-width ratio, line tracks with varying laser power and scanning speed were produced as discussed above (Table 1).
Figure 7 shows the mean value of process zone area along the different line tracks on the process window that covers the seven combinations of laser power and scanning speed conditions that were studied. It was observed that the process zone area was similar for optimum as well as keyhole porosity conditions, whereas it varied for Plateau-Rayleigh instability and lack-of-fusion conditions. A significant influence of laser power on the process zone area was observed. It is known that the laser power influences the temperature reached in the molten part and the powder bed since it determines the total amount of energy added per second by the laser source to the powder bed. At higher laser powers, process zone temperatures will be larger as compared to process zone temperatures when using low laser power, therefore a higher process zone area was observed at higher laser power as compared to the process zone area at lower laser power. It was observed from the monitoring data that conditions that form Plateau-Rayleigh instability result in the highest process zone area, whereas the lowest process zone area was observed for the lack-of-fusion conditions.
In contrast to the process zone area, quite different results for the process zone length-to-width ratio are obtained for a combination of several laser power and scanning speed conditions. Here, a significant influence of the scanning speed on the process zone length-to-width ratio was observed. The length-to-width ratio increases with increasing scanning velocity, specifically for the Plateau-Rayleigh instability conditions. The possible reason for the resulting higher length-to-width ratio at the higher scanning speed condition is that the amount of radiative heat loss is lower since there is simply not enough time to radiate a significant amount of energy. It is also possible that a higher laser speed will heat up a larger area over the 30 µs that the camera is recording the image. At low scanning speeds, a large part of the added energy is lost through heat radiation, which results in smaller melt zone dimensions. In this study, a length-to-width ratio of 2.5 was observed for Plateau-Rayleigh instability condition, whereas a length-to-width ratio of 1.5 was measured for optimum, keyhole porosity and lack-of-fusion conditions (Fig. 8).
In general, any object radiates heat. By measuring this radiation, one can estimate the temperature of an object. The melt pool emits thermal radiation at the wavelengths that correspond to the melting temperature (Planck's law). One way to estimate the temperature of the melt pool is by capturing the intensity of the process zone [6, 36]. The grey value of a pixel in an image from a CMOS camera is a function of the emitted light intensity. Here, a linear relation is taken between the process zone intensity and the grey value (on an 8-bit grayscale). The mean value of intensity within the process zone is calculated by taking an average of process zone mean intensity for all the frames along a line track of 8.8 mm. Figure 9 presents the average value of the process zone mean intensity for the line tracks in the process window.
For the optimum process parameters, heat transfer happens mainly via heat conduction, however, heat transfer via heat radiation also takes place. For keyhole mode melting, convective heat transfer (also known as thermo-capillary convection) is the most common form of heat transport. As mentioned earlier, for the higher scanning speed such as the Plateau-Rayleigh instability condition, the heat transport via heat radiation is lower. As can be seen from Fig. 9, the process zone mean intensity value for optimum condition is in the range of 91–96, and for Plateau-Rayleigh instability and keyhole porosity region, the mean intensity of the process zone is in range of 86–91. Clearly the grey value decreases with decreasing laser power such as for lack-of-fusion defects, since with lower laser power, the temperature of the process zone is quite low. The influence of laser power and scanning speed on the process zone mean intensity seems complex and further research is required to characterize it.
3.2 Spatter feature analysis from monitoring data
In this section, the effect of laser power and scanning speed on spatter features is discussed, specifically the number of spatters, spatter speed, and spatter direction. It is known that molten metal is ejected from the melt pool once the dynamic pressure, due to the recoil pressure and the Marangoni force, is higher than the pressure produced by the surface tension [28, 37]. In this work, spatter features extracted from raw monitoring data are of high intensity (similar to the process zone) and are therefore called “hot spatter”. Moreover, powder spatters are ejected near the process zone and due to their low intensities, these “cold spatter” cannot be recorded in our real-time monitoring data. The spatters move in three dimensions, but in this work, we can only observe spatter particle motion and trajectory in the projection on the XY plane parallel to the sensor of the camera. Some studies showed the feasibility of spatter tracking using a high-speed stereo vision and 3D particle tracking velocimetry [38, 39].
From Fig. 10, it can be seen that scanning speed has a significant influence on the spatter generation and it will later be correlated with quality of the part in section 3.5. For the keyhole porosity condition, the mean value of the number of spatters was approximately 1 for all the frames along a line track of 8.8 mm, whereas for all the other conditions, almost no hot spatter was observed along the line track. The spatter that forms during the keyhole mode melting is because of the recoil pressure and the Marangoni force as mentioned earlier.
In addition to the number of spatters, spatter speed and orientation might also provide useful information of the process stability. On the macroscopic scale, the spatter ejection trajectory is possibly dominated by the vapor plume and the gas flow [13, 28, 40, 41]. Most of the droplet spatters are of 100–400 µm size as calculated from the monitoring data. This is much larger than the size of the powder particles. The speed of spatters was calculated by considering the spatter distance between two consecutive frames. The calculated spatter speed ranged from ∼0.4 m/s to ∼7.8 m/s. The average spatter speed along the line track was lowest with 0.2 m/s for the lack-of-fusion condition, and highest with value of 3.3 m/s for the Plateau-Rayleigh instability condition. For the optimum and keyhole porosity conditions, the spatter speed is almost similar with mean value of 1.4 m/s and 1.6 m/s per 8.8 mm line tracks, respectively.
Figure 11 presents the polar histogram of the spatter orientation for different laser power and scanning speed conditions. Here, 0° represents the melt pool and laser scan direction and 90° represents the gas flow direction. The radius in the polar histogram is the normalized amount of spatter (in pixels) along each frame of 120 × 120 pixels. For the optimum condition, spatters are oriented to both gas flow direction and backward to melt pool scan direction, whereas for both Plateau-Rayleigh instability and lack-of-fusion conditions, spatters were observed moving mainly in the opposite direction of the moving melt pool. A uniform distribution in all directions was seen for the keyhole condition, similar to what is found in the literature [28]. Due to the vapor plume emission being constrained in the vertical direction by the keyhole walls, Ly et al. [28] observed the spatters rising almost vertically in the keyhole mode melting condition. Conversely, for the low energy input, the vapor plume emits mainly in the backward direction, which causes droplet spatters to orient in the similar direction. Meanwhile, Zhao et al. [42] discovered a new mechanism for droplet spatter in keyhole conditions based on the X-ray synchrotron imaging technique. A tongue-like protrusion on the front keyhole wall undergoes a bulk explosion, which causes spattering to occur. Consequently, the momentum released by the explosion of the protrusion determines the spatter speed, and spatters are seen being ejected along both the front and the rear keyhole rims. This is in agreement with the results obtained in the current study about spatter orientation in keyhole mode melting.
3.3 Spatter identification from 2.5-D surface topography measurements
Confocal microscopy was performed for post-process spatter analysis where several spatter features were extracted from monitoring data. Several studies have already been performed to identify the spatter features from surface topography measurements [43, 44]. In this work, spatters were automatically identified along the line track via cross-correlation, where the kernel is a 70 × 70 pixels spatter feature (Fig. 12 (a)). The cross-correlation map shows spatters being identified along the line track (Fig. 12 (c)). A spatter map was extracted after applying a thresholding to the cross-correlation map (Fig. 12 (d)). The threshold value selected is 0.015. To confirm the number of spatters observed from monitoring data, a spatter map is obtained from the surface topography measurements. A comparison of spatter maps for keyhole mode melting and optimum conditions is made (Fig. 12 (d) and (e) respectively), which confirms that more spatter is identified along the line track for keyhole condition than for the optimum condition.
3.4 Finite element modeling of melt pool
The relationship between the melt pool dimensions and the laser parameters (scanning velocity and laser powder) were predicted using a finite element model and validated experimentally. Conservation of mass, momentum, and energy are considered in order to model the melt pool and heat affected zone. The model solves the heat equation considering conduction. 3D finite element modeling of LPBF for conduction and keyhole modes has already been carried out as reported in the literature [45–47]. In this work, the FEM simulation results seem to be in good agreement with the experimental data for 316L stainless steel considering the experimental reproducibility and the numerical approximations (Table 3). Figure 13 indicates the dimensions of the melt pool obtained experimentally and the temperature distribution obtained from simulations. With P = 215 W and v = 600 mm/s, the melt pool cross-section has a semi-circular shape, similar to the melt pool cross-section in conduction mode. By reducing the scanning speed further to v = 225 mm/s, the melt pool depth increases due to high recoil pressure and enters into keyhole mode. As can be seen from Fig. 13, in a keyhole mode, the keyhole upper part is wide, whereas the bottom region has a V-shape and is narrow.
Table 3
Experimental and simulated melt pool width and depth.
| ID | Laser power (P) / W | Scanning speed (v) / mm·s-1 | Experimental width / µm | Simulated width / µm | Experimental depth / µm | Simulated depth / µm |
| 1 | 215 | 900 | 137 | 137 | 149 | 105 |
| 2 | 215 | 600 | 152 | 161 | 190 | 167 |
| 3 | 215 | 450 | 154 | 166 | 265 | 218 |
| 4 | 215 | 225 | 204 | 215 | 443 | 336 |
| 5 | 500 | 523 | 178 | 131 | 556 | 605 |
| 6 | 500 | 2093 | 149 | 114 | 204 | 240 |
| 7 | 54 | 900 | 0 | 0 | 0 | 0 |
3.5 Correlation between real-time monitoring and X-ray computed tomography
In order to validate the signatures of process-related defects, it is crucial to correlate the part quality with the real-time signatures from the monitoring. Both keyhole porosity and droplet spatter formation are stochastic in nature. However, correlation between porosity and spatter was possible using the signal recorded from real-time monitoring and X-ray computed tomography. By correlating the 2D monitoring information of the process zone and spatter with 3D information of the surface and the subsurface defect formation from X-CT, it could be possible to predict for future experiments the susceptibility for defect formation just from the monitoring data. The correlation analysis between in-situ process signatures and post-process part characterization has already been studied by several authors [2, 3, 6, 48–50]. Among all the physics-based features discussed in previous sections, a strong correlation was observed between the number of keyhole porosities below the line track and the number of spatters recorded from the off-axis monitoring system. Correlating monitoring signature features to defects seen in the X-CT is difficult for fully printed parts, therefore here feature extracted from the monitoring data is presented for single tracks.
The spatter features’ formation depends mainly on material properties and the processing parameters. As seen in section 3.2, both laser power and scanning speed have an impact on the amount of spatter formation. An increase in energy input results in keyhole formation and in more spatter event formation (Fig. 15). A large number of spatter formations indicate a high recoil pressure in the melt pool. Compared to the keyhole condition, less spatter formation is observed for conduction mode melting (Fig. 14) and therefore spatter formation can be related to the quality of LPBF part.