Human glioma transcriptome analysis
RNA-sequencing expression profiles and corresponding clinical information for GBM and low-grade gliomas (LGG) were downloaded from the Cancer Genome Atlas (TCGA) Data Matrix portal (Level3, https://tcga-data.nci.nih.gov/tcga/dataAccessMatrix.htm). Statistical analysis and ggplot2 (v3.3.2) were completed using R program v4.0.3, Log2 (TPM+1) was calculated using the scaled estimated expression values of genes. p-value <0.05 was considered statistically significant. Kaplan–Meier survival curves were analyzed using the UCSC Xena browser (https://xenabrowser.net/).
Human glioma cell line culture
The LN229 cell line was purchased from American Type Culture Collection (ATCC, USA), and the U251 MG cell line was purchased from Procell (China). 3 × 10⁵ cells were seeded in T25 flasks and incubated in an incubator (SANYO, Japan) with 5% CO2 and 95% air at 37 °C. The medium consisted of Dulbecco’s Modified Eagle’s Medium (DMEM), 10% fetal bovine serum (FBS), 100 U/mL penicillin and 100 μg/mL streptomycin (all from Gibco, USA). The cell subculture was trypsinized, mechanically blown to create single-cell suspension, and cryopreserved with a liquid nitrogen tank when necessary.
Patient-derive glioblastoma stem cells culture
Human glioblastoma stem cells (GSCs) were isolated from 3 post-surgical samples (GSC-02, GSC-05 and GSC-08). GSC-02 patient underwent surgery at the First Affiliated Hospital of Xi'an Jiaotong University; GSC-05 patient underwent surgery at the Second Affiliated Hospital of Xi'an Jiaotong University; GSC-08 patient underwent surgery at Shaanxi Provincial Peoples’ Hospital. None of the patients received any treatment prior to the intervention. This study was performed in accordance with the principles of the Declaration of Helsinki. Clinical information and tumor samples were collected with informed consent. The detailed information was shown in Supplementary Table S1. Single GSCs were isolated as previously described and with minor modifications [22]. Briefly, after washing 3 times with cold DMEM/F12 (1:1) medium (Gibco), the GBM tissue was cut into small pieces and incubated with dissociation medium (200 μL Collagenase type I (10 mg / mL, Sigma), 200 μL Dispase II (20 mg / mL, Sigma) and 1.6 mL DMEM/F12 (1:1) medium) at 37 °C for 12 min. Then, the tissue was mechanically dissociated using a pipette and filtered using a 40 μm cell strainer (BD Falcon), followed by centrifugation at 1,000 rpm for 3 min. Cells were seeded at 4 × 10⁵ cell/ml in non-adhesive T25 flasks with 5 mL complete medium, consisted of DMEM/F12 (1:1), 1% N2, 2% B27 (minus vitamin A), 20 ng/mL EGF, and 10 ng/mL bFGF. After culturing for 5-7 days, the formation of 80-200 μM sphere was observed. For single-cell adhesive culture, the sphere was dissociated into single cells using ACCUTASE™ (Stemcell Technologies, Canada) and plated in poly-D-lysine-coated 24-well plates.
UTX knockdown treatment
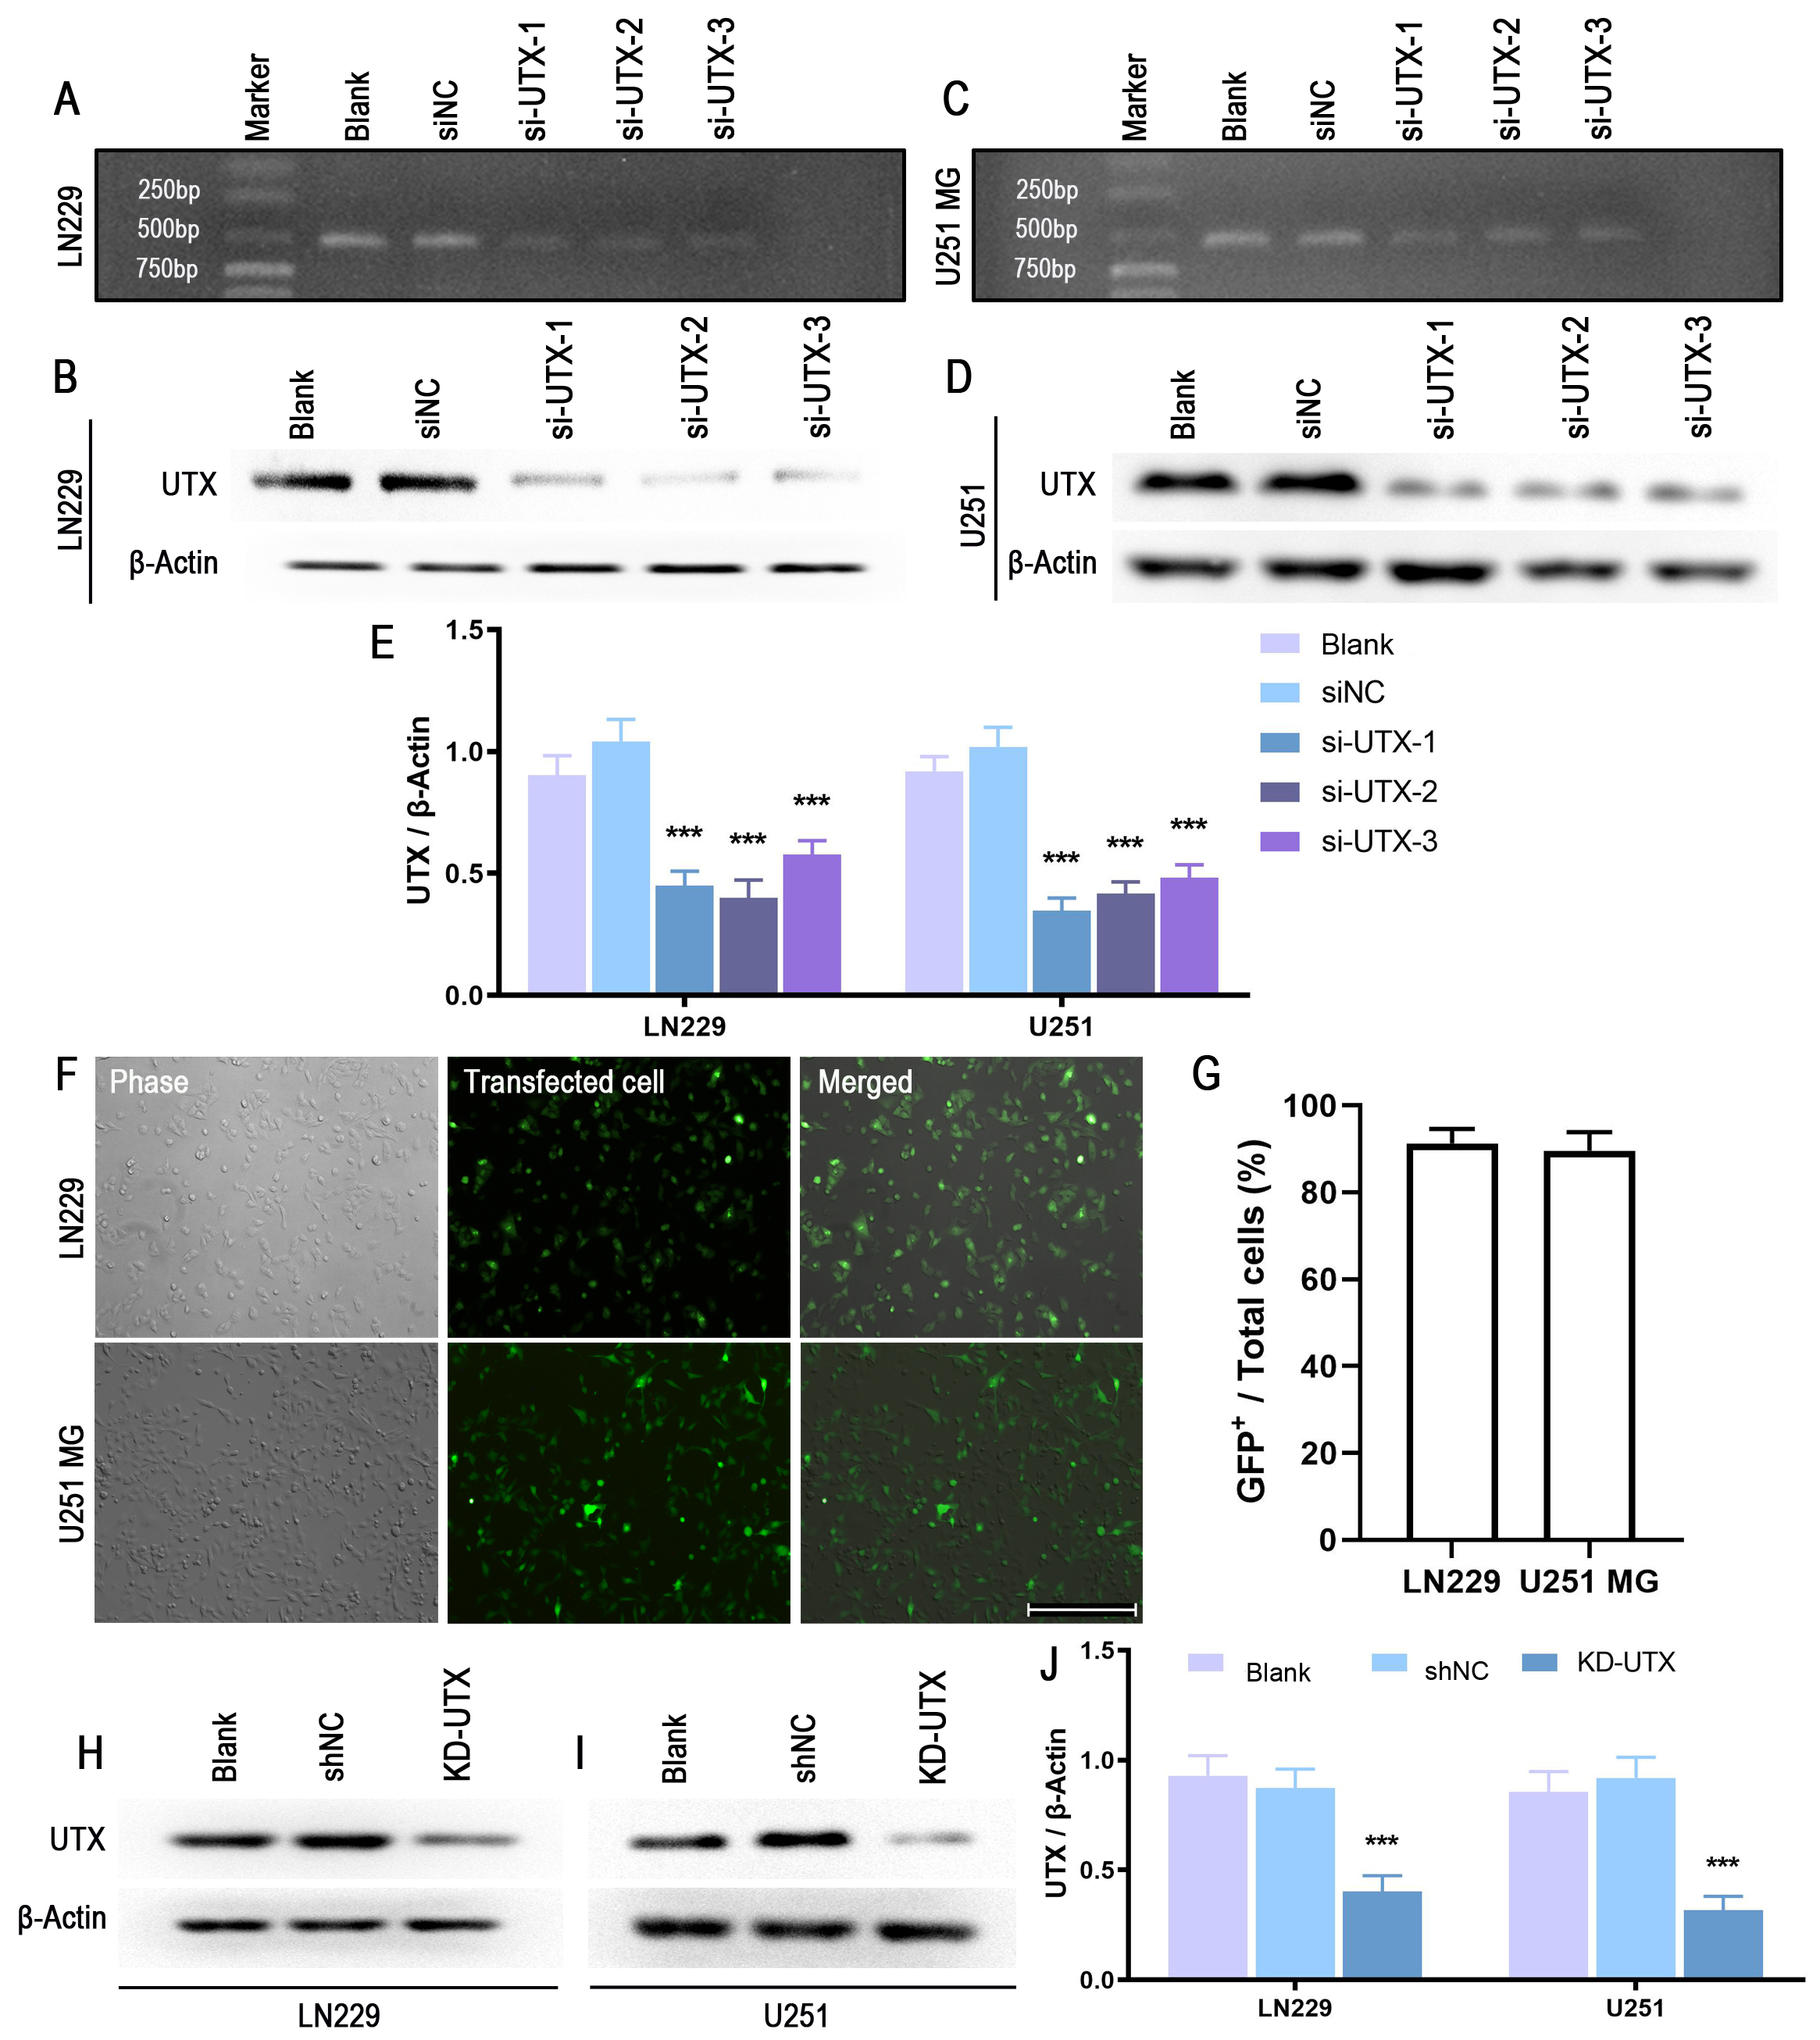
The small interfering RNA (siRNA) specific to human UTX and scrambled siRNA negative control (siNC) were synthesized by Genechem (Shanghai, China). The sequences were as follows:
si-UTX-1: 5′-AUUUCAGUGGGCUAUUAAATT-3′,
si-UTX-2: 5′-ACGAAAUAUCAAGGUUUCATT-3′,
si-UTX-3: 5′-CUAUGGAUGCUUUGCAAGCTT-3′,
siNC: 5′-UUCUCCGAACGUGUCACGUTT-3′.
LN229 and U251 MG cells were grown on 24‐well plates, and Lipofectamine 2000 reagent (Invitrogen) was used to deliver the siRNA (100 nM/well). The knockdown efficiency was evaluated by qRT-PCR and Western blot. The lentivirus vector containing shRNA targeting human UTX (shUTX) or negative control vectors (shNC) was purchased from Genechem (Shanghai, China). Three lentivirus vectors were used in this study; one containing eGFP was used to measure transfection efficiency and orthotopic tumor formation assay, another which did not express fluorescent protein was used for the majority of the subsequent experiment, and the luciferase-expressing lentivirus was used for orthotopic glioblastoma experiments. Cells (2 × 10⁴ cells/well) were seeded in a 24-well plate and infected with 2 μL KD-UTX (1 × 10⁸ viruses, MOI = 1:10) or 1μl shNC (1 × 10⁸ viruses, MOI = 1:5), respectively. One day later, the infected cells were selected with puromycin for 24 hours. For the GBM cells, the concentration of puromycin was 2.5 μg/ml, and 1.6 μg/ml of puromycin was used for GSCs.
Immunostaining
Cells were fixed with 4% paraformaldehyde (PFA) at room temperature for 20 min followed by washing three times with PBS. Then, cells were permeabilized in 0.1% Triton X-100 for 15 min and blocked with blocking buffer (containing 5% bovine serum albumin and 5% horse serum in PBS) for 1 h, followed by incubating with the primary antibodies overnight at 4°C. After washing three times with PBS, cells were then incubated with suitable secondary antibodies. The information of the first and secondary antibodies were shown in Supplementary Table S2. The negative control samples were just incubated in the blocking buffer instead of the primary antibody. Nuclei were visualized with DAPI-containing mounting medium (Vector, USA). Images were acquired using a fluorescence microscope equipped with a digital camera (BX51 + DP71, Olympus, Japan) and analyzed with ImageJ software (NIH, USA). The sphere-formation images were taken with a Leica SP8 confocal microscope equipped with a × 40 oil immersion lens.
BrdU incorporation
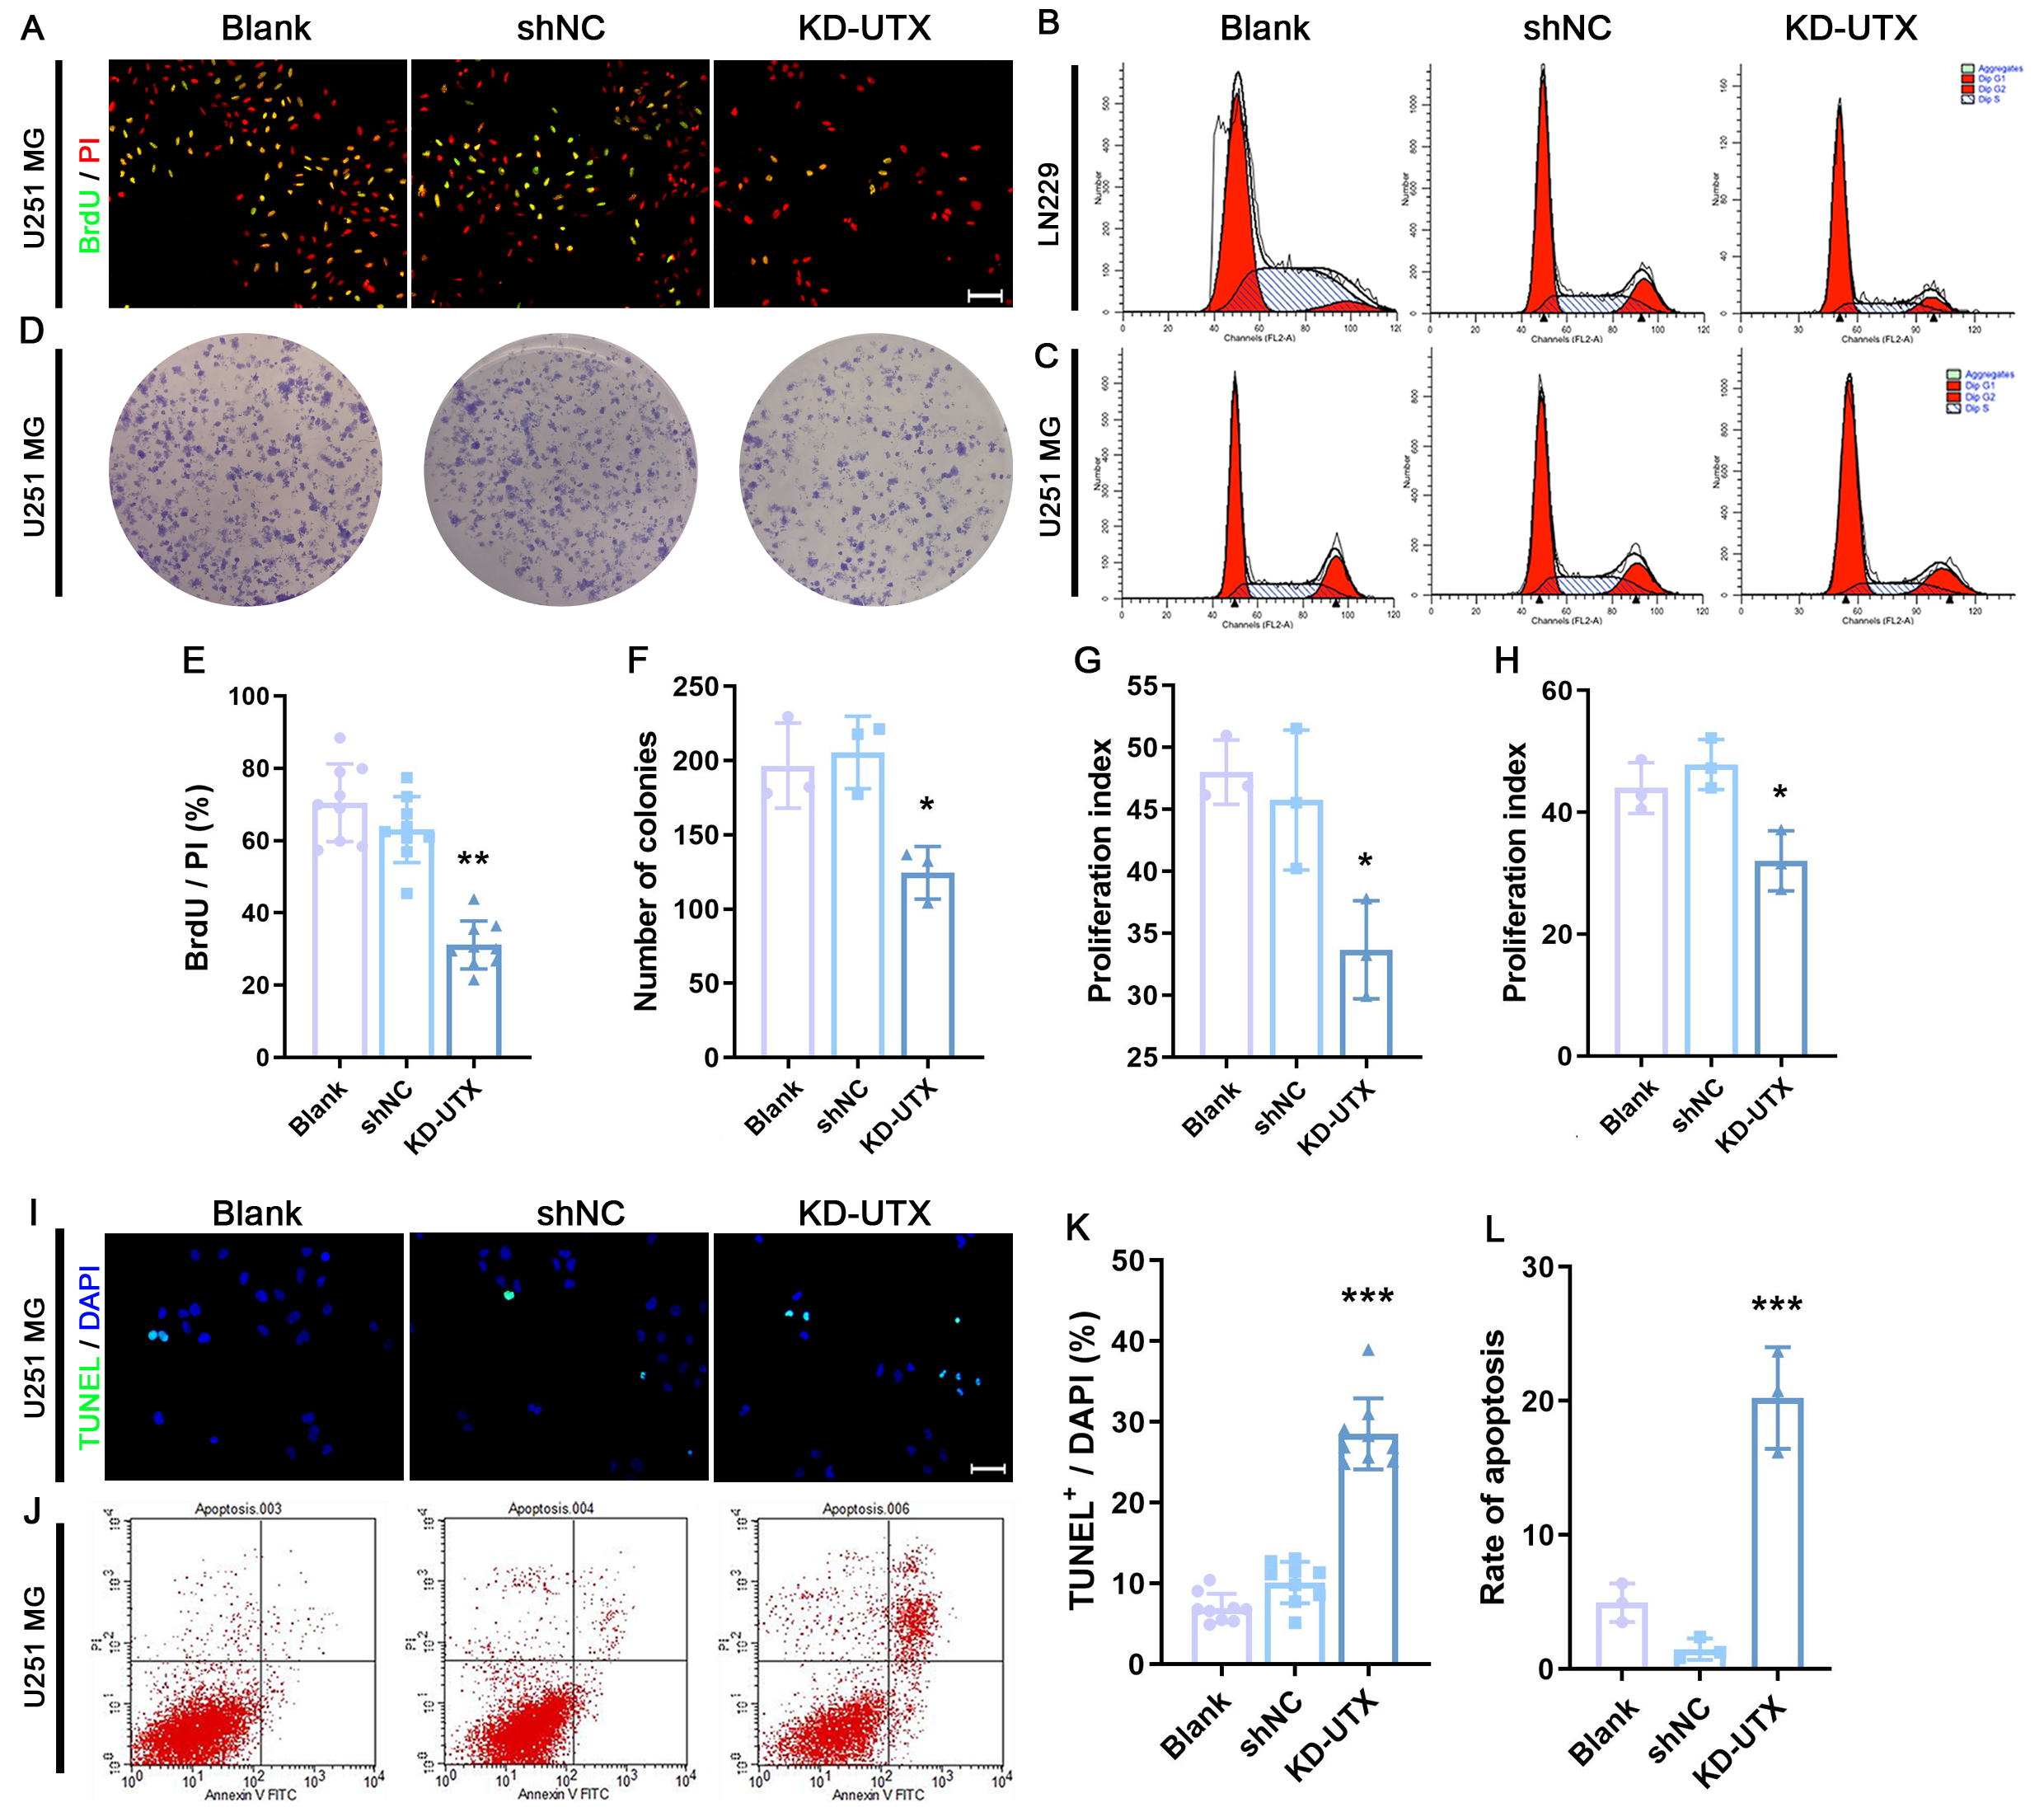
Following the treatment, GBM cells were incubated with 10 μg/mL of BrdU for 1 hour, and GSCs were treated with BrdU for 2 hours. The BrdU-labeled cells were further detected by immunostaining. To identify the BrdU-labeled cells, cells were pretreated with 2 N HCl for 30 min at 37°C, followed by neutralizing with 0.1 M borate buffer (pH8.5) for 15 min. The percentage of labeled cells was evaluated and normalized by the PI-stained nuclei or Sox2-positive cells.
TUNEL assay
The terminal deoxynucleotidyl transferase dUTP nick end labeling (TUNEL) assay was used for detecting cell apoptosis according to the manufacturer’s instructions (Roche Diagnostics, USA). In brief, cells were fixed with 4% PFA for 30 min, followed by permeabilization using 0.1% Triton X-100 in 0.1% sodium citrate buffer for 2 min on ice. Then, cells were incubated with 50 μL TUNEL reaction mixture for 1 h at 37°C. After washing with PBS, nuclei were stained with DAPI-containing mounting medium (Vector). Images were acquired using a fluorescence microscope equipped with a 40× objective (BX51 + DP71, Olympus) and analyzed with Image-Pro Plus 5.0 software (Media Cybernetics, USA).
Flow cytometry analysis
For cell cycle analysis, the treated cells were dissociated with trypsin into single cells and fixed with pre-cooling 75% ethanol overnight at 4°C. After washing twice with PBS, cells were stained with propidium iodide solution (100 μg/mL, Sigma-Aldrich, USA) containing 100 μg/mL RNase A (New England Biolabs, USA) for 15 min at 37°C and away from light. The cell cycle analysis was performed using a FACSCalibur system (BD Biosciences, USA) with an excitation at 488 nm and emission at 630 nm. 1 × 10⁵ cells were detected for each sample. The data were collected using the FACSortCellquect software (BD Biosciences), and the DNA content and cell cycle distribution were determined using the Modfit LT software (BD Biosciences). The proliferation index was used to evaluate the changes in the cell cycle distribution with the following formula: proliferation index = (S+G2/M) / (G0/G1+S+G2/M).
Apoptosis analysis was performed using the FITC Annexin V apoptosis detection kit (BD Biosciences, USA). After treatment, cells were dissociated into single cells, washed twice with pre-cooling PBS and resuspended in 1 × binding buffer. Then, 200 μL of the cell suspension (more than 1 × 10⁵ cells) was transferred to a 5 mL FACS tube (BD Biosciences) and stained in duplicate with 10 μL of FITC Annexin V conjugate and 10 μL of propidium iodide (10 mg/mL) for 15 min in dark at room temperature. Apoptosis was analyzed using a FACSCalibur (BD Biosciences) with 488 nm excitation for Annexin V (emission collected at 530 nm) and 488 nm excitation for PI (emission collected at 630 nm). The data were collected with FACSort Cellquect software (BD Biosciences) and the percent of apoptotic cells was referred to the apoptotic index with the following formula: (LR+UR) / (UL+LL+LR+UR).
Colony formation assay
Cells (500 cells/well) were seeded into a six‐well plate and cultured in normal conditions for 14 days. After fixation with 4% PFA, cells were stained with crystal violet solution. The number of colonies was counted for each sample and data were presented in samples from at least 3 independent experiments.
Western blot analysis
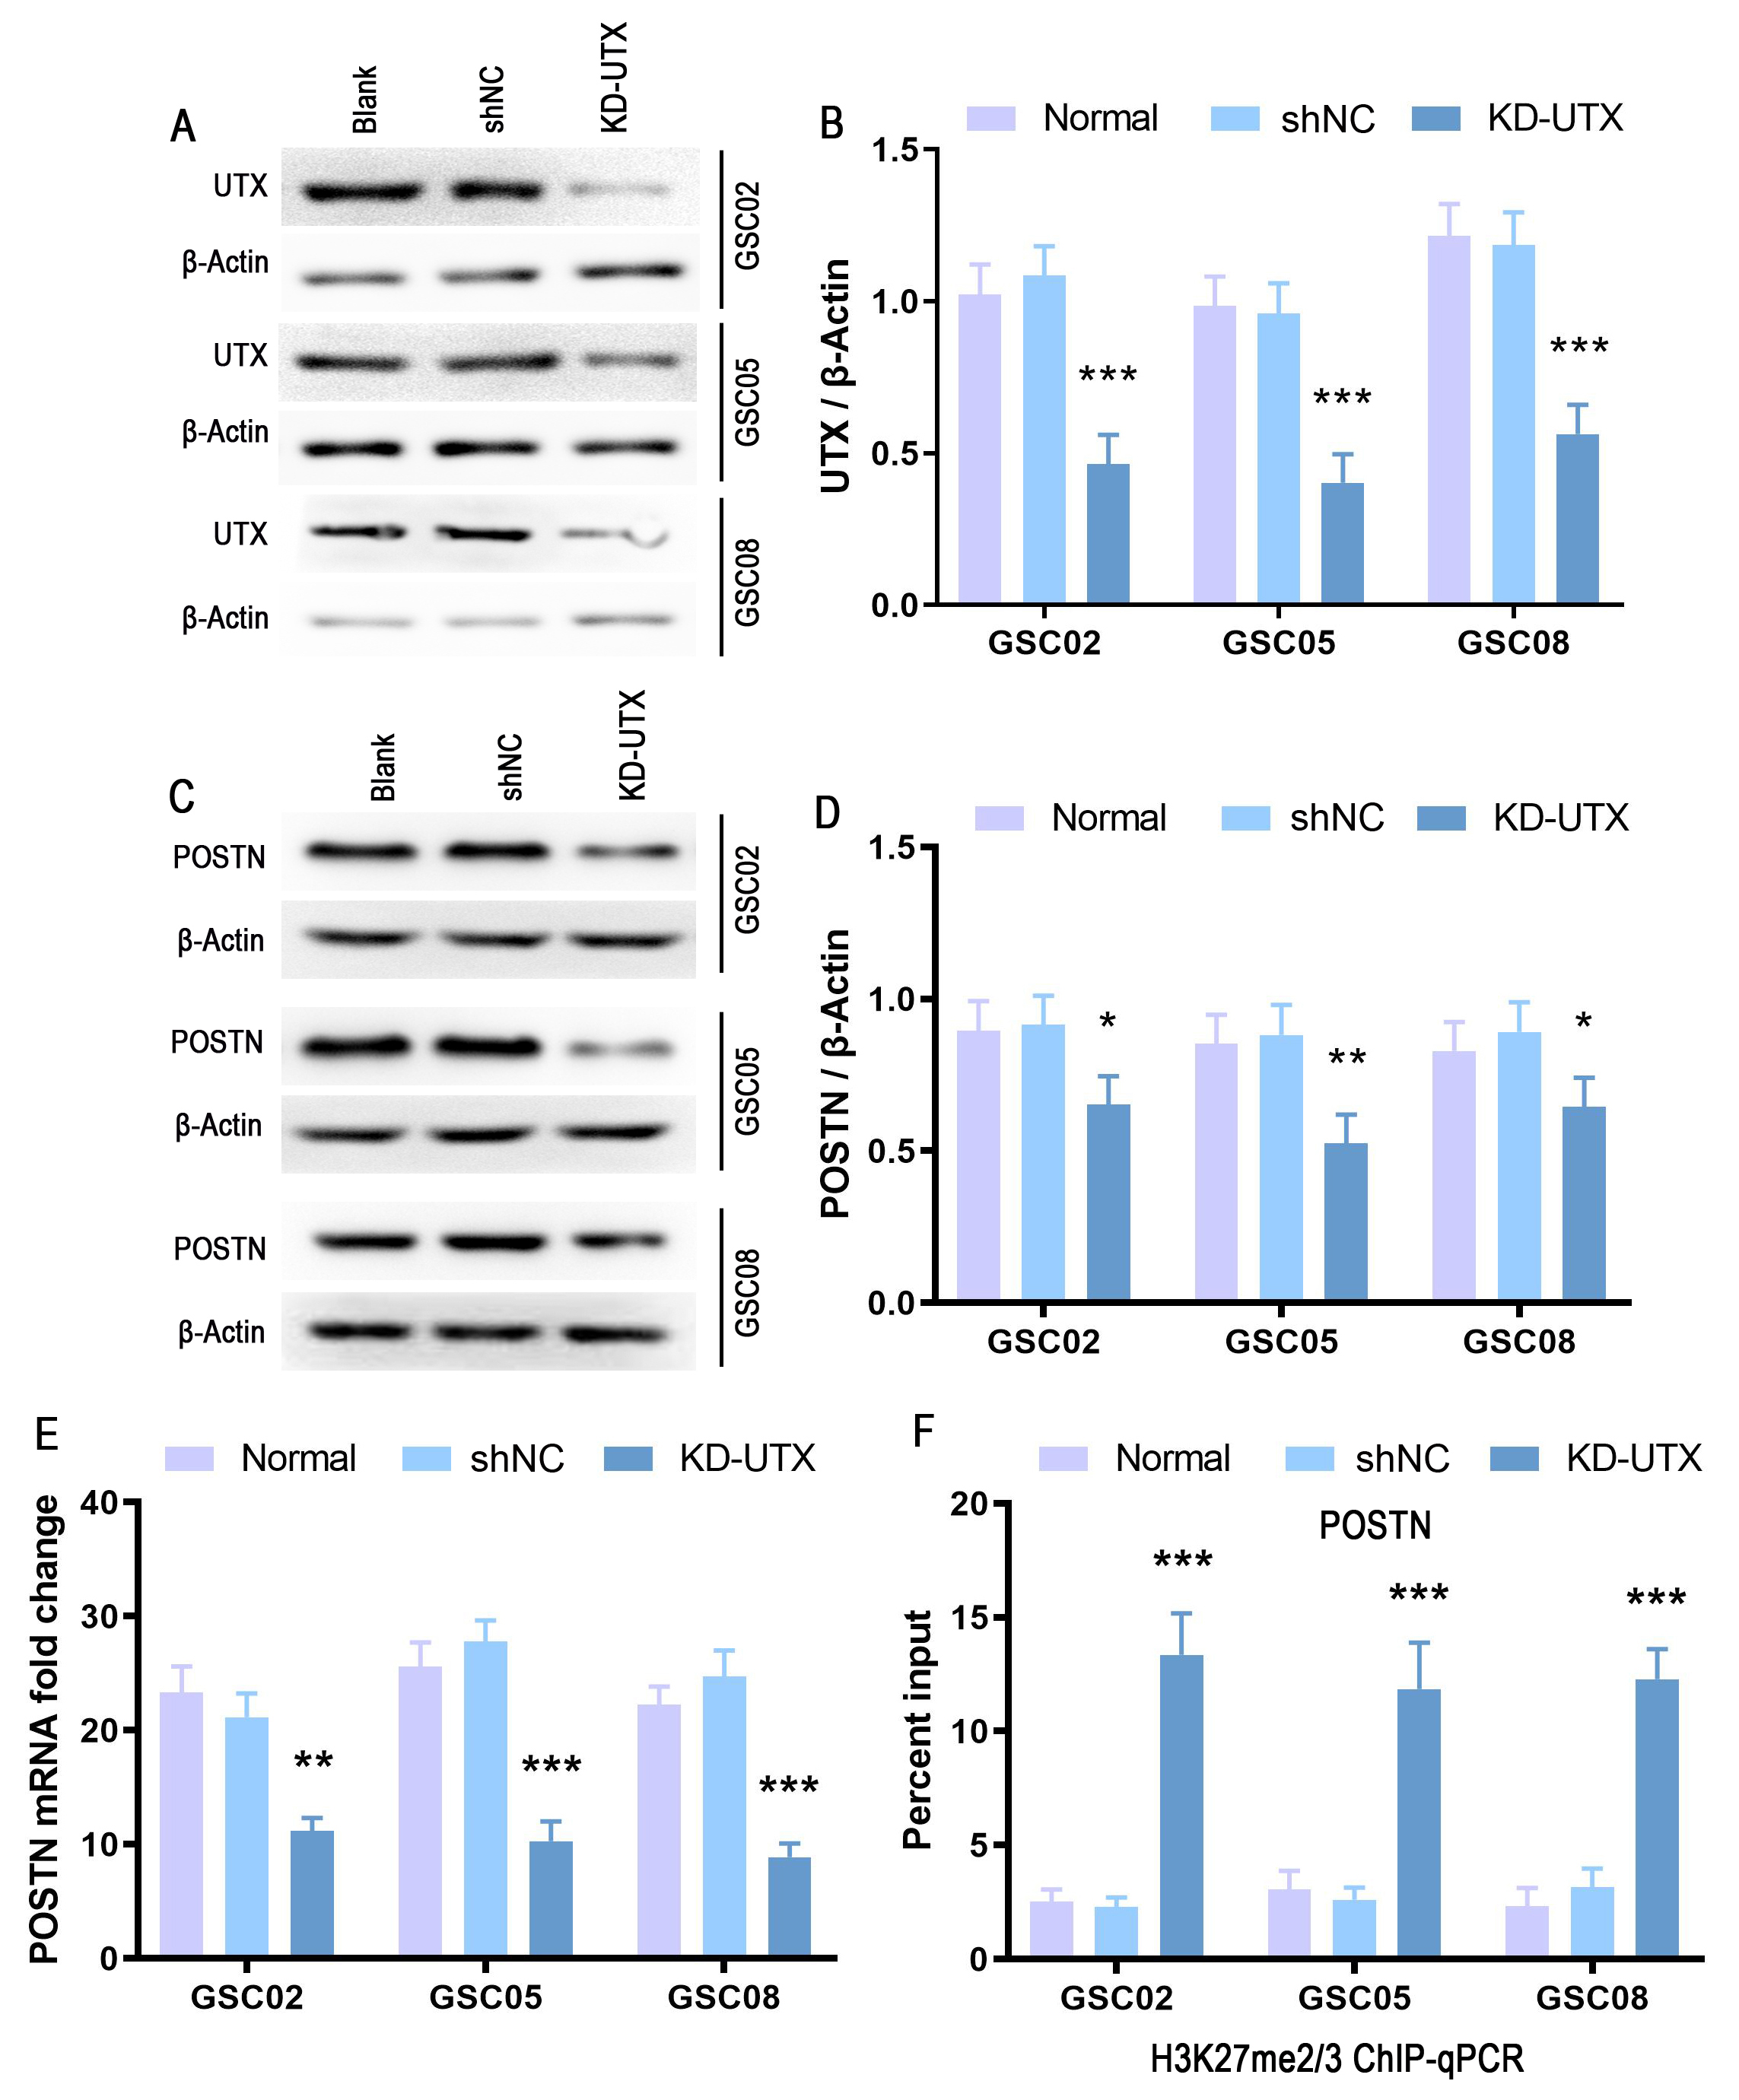
After the treatment, cells or tissues were collected and lysed in RIPA lysis buffer supplemented with Protease Inhibitor Cocktail (Roche, Germany) for 15 min on ice, followed by sonication (Sonics, USA) and centrifugation (Eppendorf, Germany). Then supernatants were collected, and the protein concentration of the samples was measured using the BCA assay (Pierce, USA). After boiling with loading buffer, Proteins (20 μg – 40 μg depending on the target protein) were resolved by 10%-12% SDS-PAGE and transferred to polyvinylidene fluoride (PVDF) membranes (BioRad, USA). The membranes were blocked with 5% non-fat milk for 2 h at RT and subsequently probed with specific primary antibodies overnight at 4℃ (Supplementary Table S2). After washing three times with TBST, the membranes were incubated with horseradish peroxidase-conjugated anti-rabbit or anti-mouse IgG for 2 h at room temperature. Then, immunoreactive bands were visualized with an enhanced chemiluminescent substrate according to the manufacturer’s protocol (Pierce). The bands were collected using GeneGnomeXRQ (Syngene, UK) and analyzed using the ImageJ 3.5 software. The expression levels of target proteins were determined and normalized to the housekeeping β-Actin. All Western blot data were presented in samples from at least 3 independent experiments.
Sphere-formation assay
Patient-derived GSCs were infected with lentivirus containing shUTX (KD-UTX) or negative control vectors (shNC). The blank control group (Ctrl) received an equal volume of culture medium. For sphere diameter measurement, single GSCs were seeded at a density of 3,000 cells/well incubated in the 24‐well plates. For sphere counting, cells were incubated at a seed density of 6,000 cells/well in the 24‐well plates. The sphere diameter and number were ) were recorded by using an inverted microscope (Olympus CKX41, Japan) on the 3rd, 5th, and 7th day (inoculation in the 24‐well plates was deemed as 0 day). The images were analyzed with ImageJ software, and all spheres per well ≥ 30 μm diameter were included in the count
Animal experiments
Pathogen-free male athymic BALB/c nude mice (5 weeks old) weighing 20-25 g were used for this study and all mouse experiments were approved by the Xi’an Jiaotong University Health Science Center Ethics Committee. The mice were purchased from the Xi’an Jiaotong University Laboratory Animal Center (Certificate No. 22-9601018). The staff at Xi’an Jiaotong University Laboratory Animal Center was responsible for housing and daily maintenance. Housing and environmental enrichment are according to standards. All efforts were undertaken to minimize the suffering of the mice.
For the heterotopic xenograft model, 100 μL of normal LN229 (Blank), sh-NC-LN229 (shNC) or KD-UTX-LN229 (KD-UTX) suspension (1 × 10⁷ / mL) were implanted into the subcutis of the mice. Tumors were monitored every weekday and size was measured by using an electronic digital caliper. If the tumor size exceeds 2000 mm3 or the diameter exceeds 15 mm, the mice will be weeded out and euthanatized. Five mice were sacrificed at 3 d, 7 d, 14 d, and 28 d respectively. At each time point, tumors were isolated and tumor weight was measured, and tumor size was calculated by the formula: length × width2 × 0.52 [23]. Subsequently, heterotopic tumor tissues were collected and used for Western blot analysis.
For the orthotopic glioma model, mice were anesthetized with inhalational anesthesia using 4% isoflurane for induction and 1.5% isoflurane for maintenance. Then, mice were placed in a stereotactic frame (RWD LifeScience, China) and a longitudinal incision in the cranium was made at the midline to expose the bregma. After drilling a small hole, stably transfected patient-derived GSCs which express luciferase (1 × 10⁵/μL) were implanted into the right brain using the following coordinates: anterior-posterior, -1.3 mm posterior to the bregma; medial-lateral, 1.7 mm; dorsal-ventral, 2.2 mm below the skull surface. The Hamilton syringe was performed slowly over a 1-min period at a speed of 5 µL/min. After the injection, the syringe was left in place for 5 min and the hole was sealed with bone wax. Mice were observed daily for signs of ill health. Mice were imaged using the IVIS® Spectrum In Vivo Imaging System (XENOGEN, USA) at day 3, 7 and 14, respectively.
Transwell co-culture analysis
Patient-derived GSCs (8,000 cells/well) with different treatments were seeded onto a 0.4 μm transwell chamber (Millipore). When the cells covered the bottom of the transwell chamber (this typically takes 3 days), normal GSCs (3000 cells/well) and LN229 cells (1500 cells/well) were seeded in the 24-well plate. At the next day, the transwells were discarded and the cells in the 24-well plate were fixed with 4% PFA for 20 min followed by BrdU incorporation and TUNEL assay.
RNA-sequencing (RNA-seq)
Total RNA was extracted using a Trizolreagent kit (Invitrogen) according to the manufacturer’s protocol. RNA quality was assessed on an Agilent 2100 Bioanalyzer (Agilent Technologies, Palo Alto, CA, USA) and checked using RNase-free agarose gel electrophoresis. Eukaryotic mRNA was enriched by Oligo(dT) beads, while prokaryotic mRNA was enriched by removing rRNA by Ribo-ZeroTM Magnetic Kit (Epicentre, Madison, USA). Then the enriched mRNA was fragmented into short fragments using a fragmentation buffer and reverse transcripted into cDNA with random primers. Second-strand cDNA was synthesized by DNA polymerase I, RNase H, dNTP and buffer. Then the cDNA fragments were purified with QiaQuick PCR extraction kit (Qiagen, The Netherlands), end-repaired, poly(A) added, and ligated to Illumina sequencing adapters. The ligation products were size selected by agarose gel electrophoresis, amplified by PCR and sequenced using Illumina HiSeq2500 by Gene Denovo Biotechnology Co. (Guangzhou, China). Bioinformatic analysis was performed using Omicsmart, a real-time interactive online platform for data analysis (http://www.omicsmart.com).
Quantitative reverse-transcription PCR (qRT-PCR)
Total RNA was isolated from cells using Trizol reagent following the manufacturer's instructions, and 2 μg RNA was reverse transcribed into cDNA using a RevertAid first-strand cDNA synthesis kit (ThermoFisher, USA) supplemented with Oligo(dT)18 and Random Hexamer Primer. qRT-PCR was performed with GoTaq® qPCR Master Mix (Promega, USA) using an iQ5 Real-Time PCR Detection System (BioRad, USA). The primer pairs were synthesized by TaKaRa and displayed in Supplementary Table S3.
Chromatin Immunoprecipitation (ChIP)-qPCR
ChIP was performed as previously described with minor modifications as detailed below [24]. 100 μL single-cell suspensions (2 × 10⁷ / mL) were fixed by 1% formaldehyde for 10 min. Then, glycine solution (final concentration 125 mM) was added and incubated for 5 min. After twice washing with 500 μL ice-cold PBS, 300 μL lysis buffer was added and sonicated for 3 × 30s using VCX 500 (SONICS, USA). The lysate was diluted and incubated in Dynabeads™ Protein A (Invitrogen, USA) which had pre-incubated with 2 μg of H3K27me2/me3 antibody (39435, Active Motif, USA) or IgG (Abcam, UK). The immune complexes were incubated at 4°C, 20 rpm on a Tube Revolver Rotator for 12 hours. Then, the chromatin–antibody–bead complexes were washed 4 times in 100 μL ice-cold RIPA buffer, rinsed with 400 μL ChIP elution buffer (containing 50 μg RNase A) and incubated at 37 °C at 1,200 rpm on a Thermomixer (Eppendorf, Germany) for 1 h followed by incubating with 2 μL Proteinase K (New England Biolabs, USA) at 65 °C, 4 hours. An input control was processed in parallel. ChIP DNA was purified by phenol-chloroform isoamyl alcohol extraction, ethanol-precipitated and dissolved in 20 μL EB buffer (Qiagen, Germany). Analysis of DNA was performed using qRT-PCR with gene-specific primers (Supplementary Table S4). Recovery of genomic DNA as the percentage input was calculated as the ratio of immunoprecipitate to input.
The enzyme-linked immunosorbent assay (ELISA)
At the end of each time point, the cell culture medium was collected and analyzed using the POSTN, VCAM1 and Pro-Collagen I alpha 1 ELISA kit (R&D Systems) according to the manufacturer’s instructions. The absorbance was measured at 450 nm using a multimicroplate spectrophotometer (BioTek). Triplicate parallel wells were examined in all the experiments and the data were presented as the average of at least three independent experiments.
Cell viability assay
Cell viability was evaluated using the Cell Counting Kit‐8 (CCK‐8; 7sea, Shanghai, China). Cells were grown in 96‐well plates at 5,000 cells/well and cultured for 1, 2, 3, 5 and 7 days. At the end of each treatment, 20 μl/well of CCK‐8 was added to the media and cells were incubated for 2 hr at 37°C. The absorbance was measured at 490 nm using a multimicroplate spectrophotometer (BioTek, Winooski, VT). Triplicate parallel wells were examined in all the experiments, and the data were collected as the average of at least three independent experiments. The results are presented as the absorbance value.
Statistical Analysis
Statistical analyses were performed using GraphPad Prism 5.0 software. Data were evaluated for normality and homogeneity of variance before comparison. Differences between groups were analyzed using one-way ANOVA, followed by Tukey's post hoc test. The Kolmogorov-Smirnov test was used for normality and homogeneity. The data were shown as mean ± standard deviation, and P < 0.05 was considered as a statistically significant difference.