PLVAP mRNA expression level correlates with poor prognosis in STAD patients from multiple datesets
An analysis using the UALCAN online bioinformatics tool with default settings showed that the mRNA levels of PLVAP were higher in STAD tissues, compared to normal tissues (Figure 1A). A similar result was found in the TIMER database (Figure 1B). However, the GEPIA database showed that no obvious difference could be observed for PLVAP mRNA expression levels between STAD and adjacent tissues to the carcinoma. (Figure 1C).
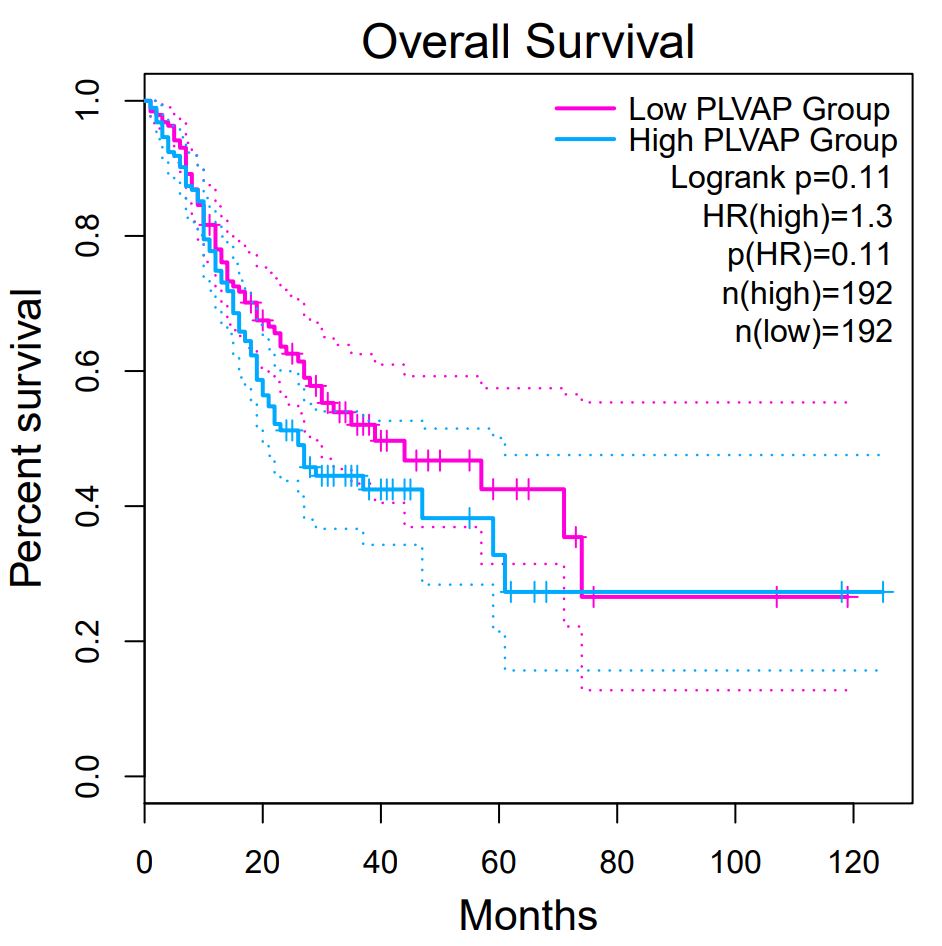
To further investigate the correlations between PLVAP mRNA signature expressions and clinical prognoses, we predicted the overall survival percentage using multiple datasets. GEPIA (Supplementary Figure S1) showed that PLVAP mRNA was not associated with overall survival (OS), disease-free survival (DFS). Furthermore, results from the KM plotter revealed that patients with the high PLVAP mRNA level exhibited a shorter overall survival (OS) compared with patients with low levels (Figure 2A). Next, we performed KM survival curves to evaluate the OS of these patient subgroups (Figure 2B-C). The results revealed that the high PLVAP mRNA level was associated with a shortened OS in STAD patients with HER-2 positive (HR=1.94; P<0.0001) and negative (HR=2.66; P<0.0001). High PLVAP mRNA level was significantly associated with poor OS time in STAD patients that had received surgery (HR=1.84; P<0.0001). However, this result was not observed in STAD patients received 5-FU-based adjuvant chemotherapy (HR=0.69; P=0.07).
PLVAP expression and clinicopathological features in STAD tissues using IHC.
To evaluate the clinical significance of PLVAP in STAD progression, we detected the expression level of PLVAP protein in STAD tissues via IHC. Positive PLVAP IHC was observed in 84.4% (81/96) of STAD tissues and only 43.3% (13/30) of the normal tissues (χ2=37.33; P< 0.001). The 96 STAD cases were classified into three groups according to the PLVAP expression level in cancer tissue. High PLVAP expression was observed in 50% (48/96) of samples, and low expression was observed in 16% (15/96) of cases. Figure 3 and Table 1 shows the correlation between PLVAP expression and various clinicopathological parameters. The expression of PLVAP was not related to the age, gender, morphology, differentiation, tumor size, diabetes, cyst, Lauren type, H. pylori, mucus, necrosis, P53 levels, or Her-2 levels of STAD patients, but were related to TNM stage(P=0.02), Vascular invasion(P=0.04), Nerve invasion(P=0.01), and Ki-67(P=0.01).
Correlation between PLVAP protein expression and MVD (Microvessel density)
To investigate whether PLVAP exerts a stimulative effect on tumor-associated blood vessel formation and growth, we estimated the intratumoral microvessel density (MVD) by CD34-positive staining, which was mainly detected in the vascular endothelial cell membrane. MVD expression in STAD tissues. MVD was significantly higher in the PLVAP-rich group (3+) than in the PLVAP-poor group (-/1+) (P=0.01; Table 1; Figure 4), indicating that PLVAP may pose a facilitator effect on tumor-associated blood vessel formation and growth, at least partially.
Correlation between PLVAP protein expression and LPS
Previous studies have confirmed the presence of bacteria in human tumors (Nejman, D. et al 2020). To evaluate the bacterial distribution in STAD initially, we examined LPS protein expression by IHC. The relationship between the LPS expression and the clinicopathological features was analyzed in 96 STAD patients (Figure 5, Supplementary Table S1). The up-regulation of LPS tended to be associated with the TNM stage (P=0.01), Ki-67 (P=0.01). Significant correlation between LPS expression and age, gender, morphology, differentiation, tumor size, diabetes, cyst, Lauren type, H. pylori, mucus, necrosis, P53 levels, and Her-2 levels were not observed.
To assess the correlation between the bacterial presence and PLVAP protein expression in STAD tissues. Pearson’s bivariate correlation test was applied to analyze the association between PLVAP and LPS related proteins (Table 2). There were moderately significant associations of PLVAP and LPS (r=0.36; P=0.01). This result suggested that bacteria may be able to promote the expression of PLVAP protein.
The microbiota in the PLVAP-rich group was significantly different from that in the PLVAP-poor group
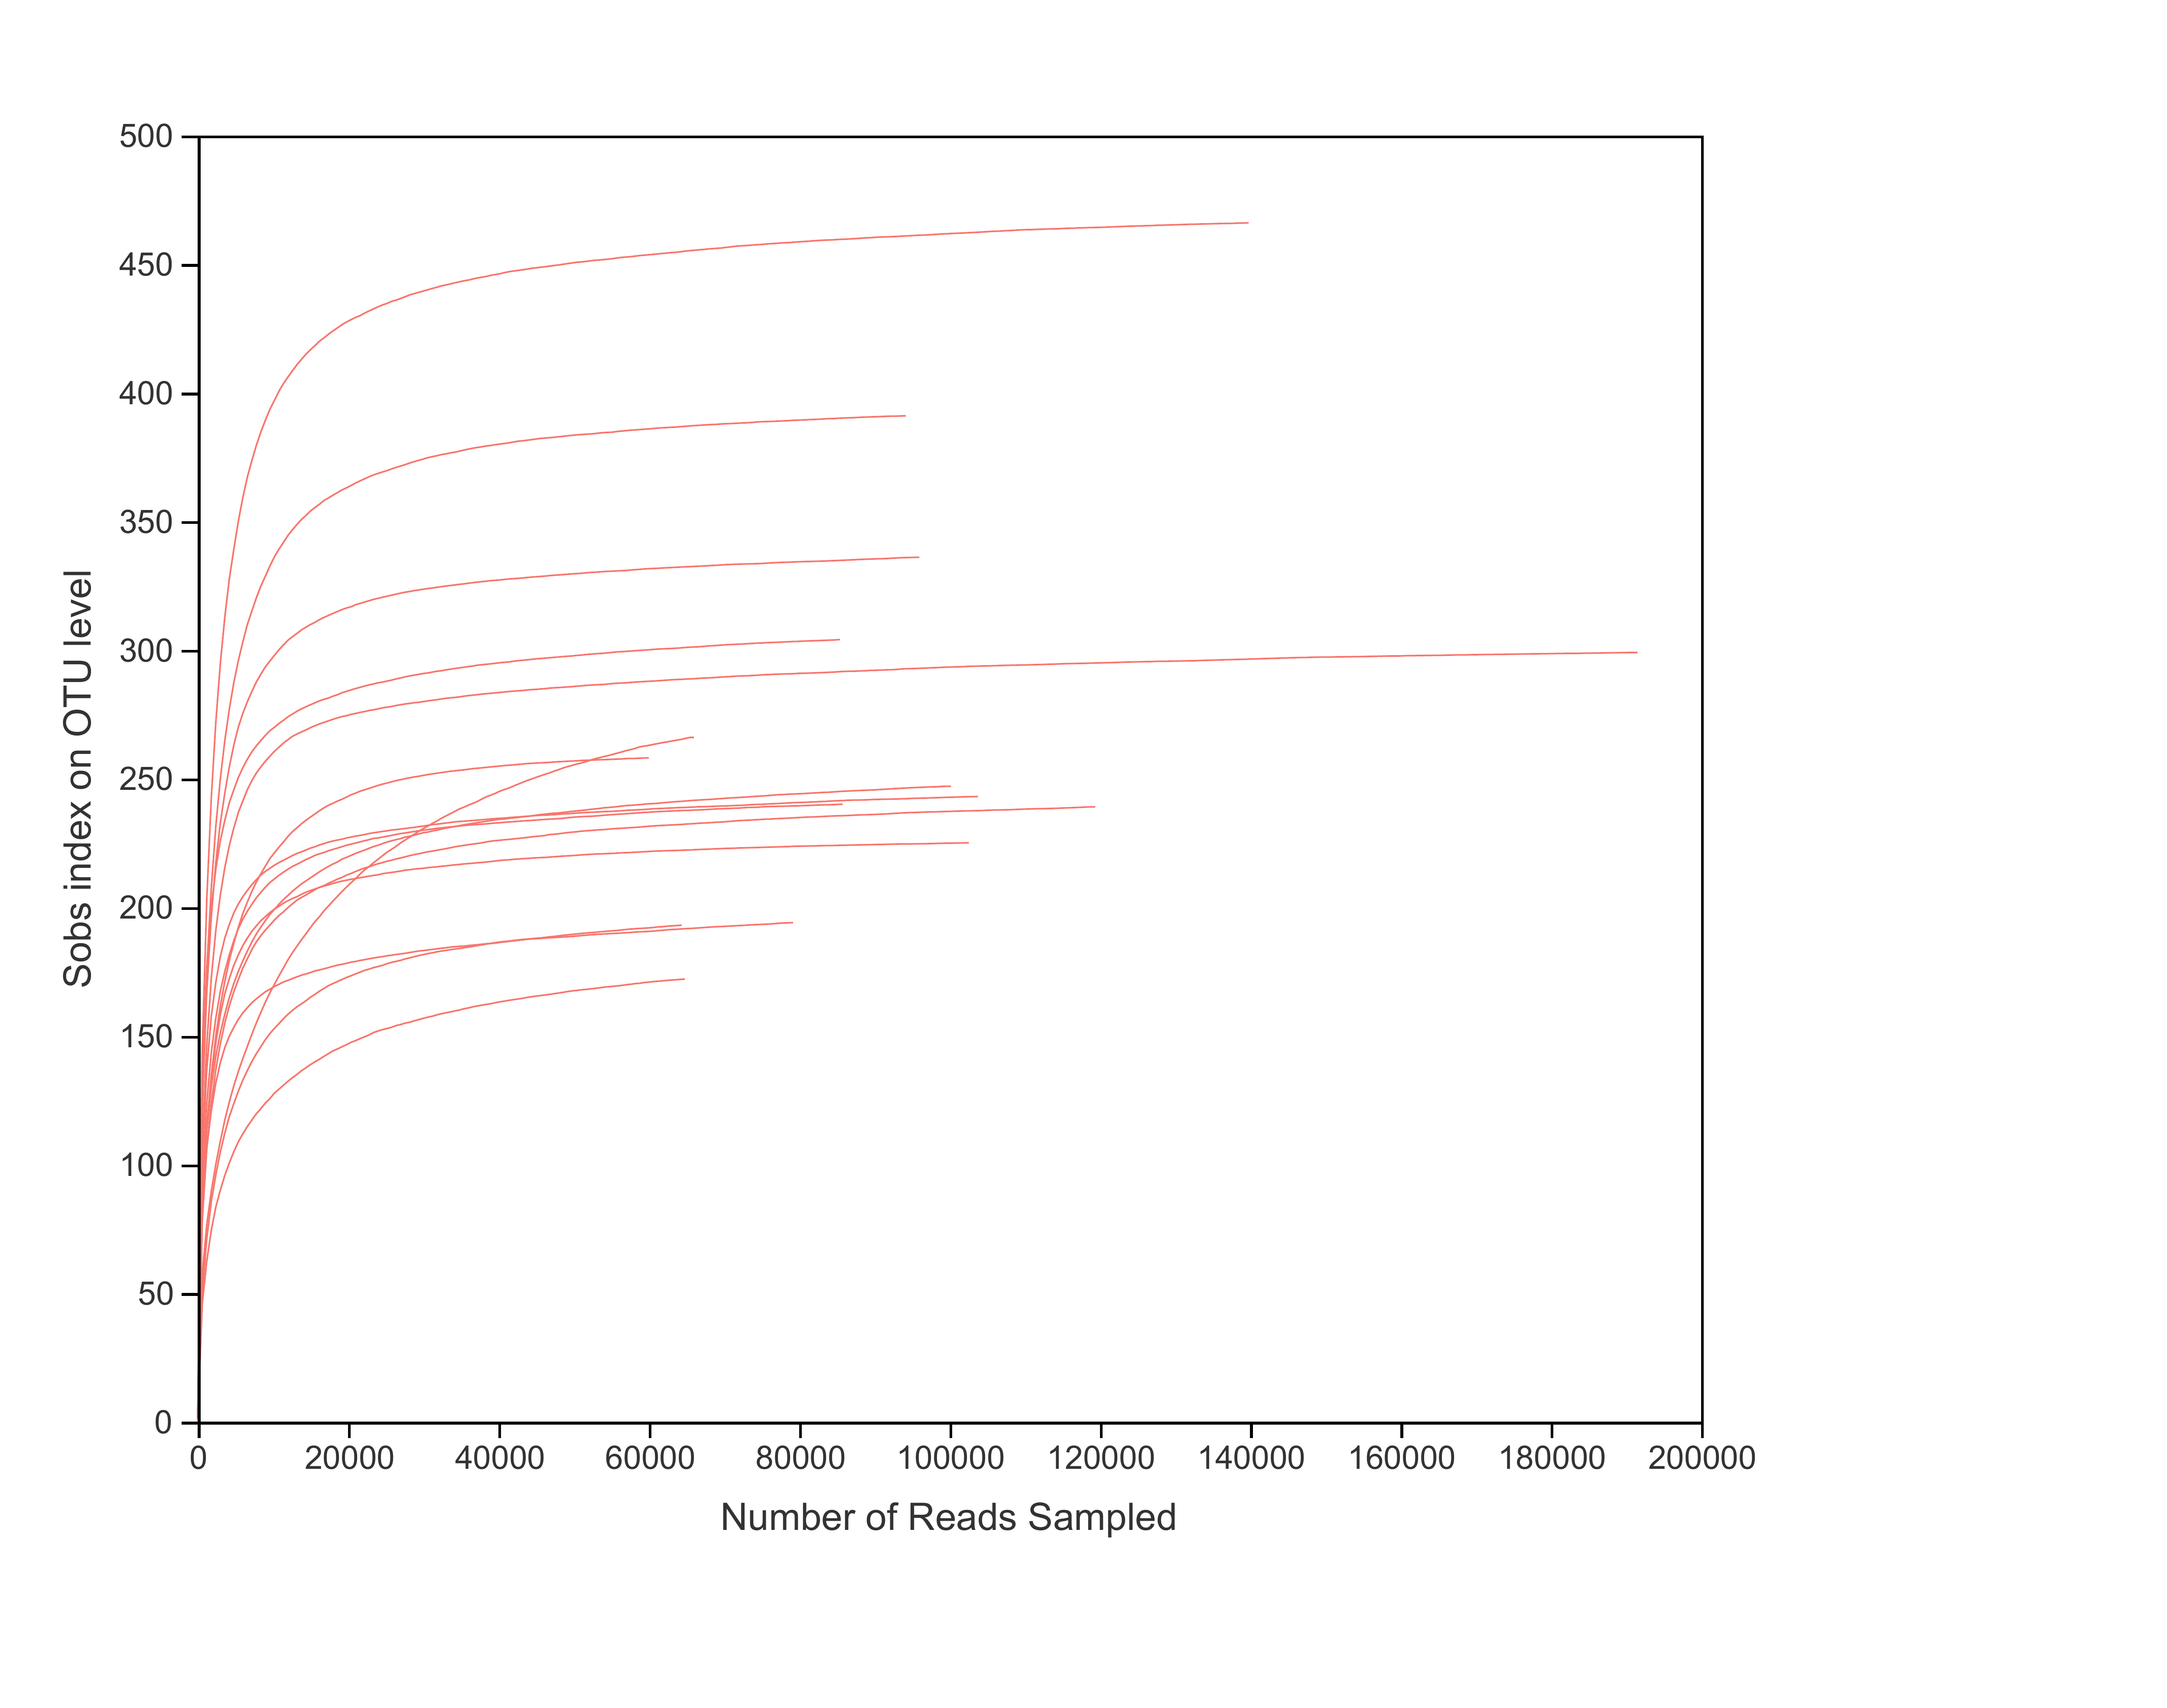
To further investigate whether there was a difference between the gut microbial communities of the PLVAP-rich group (3+) and PLVAP-poor group (-/1+), we employed 16S ribosomal RNA (16S rRNA) gene sequencing of 15 fixed, paraffin-embedded STAD samples (10 samples with the PLVAP-rich group, and the 5 samples as the PLVAP-poor group). Supplementary Figure S2 displays all samples with V3-V4 sequencing using 16S rRNA, with operational taxonomic units (OTUs) based on 97% sequence similarity. Alpha rarefaction plots of observed species were constructed to determine that adequate sequence coverage was obtained to reliably describe the full diversity present in these samples. The results showed that there were significant differences between PLVAP-rich and PLVAP-poor groups(P<0.05). The core salivary microbiome of both PLVAP-rich patients and poor controls comprised of 919 species (462 species shared by the two groups, while 457 differed). At the phylum level (Figure 6A), Fusobacteriota (PLVAP-rich group:11.48%; PLVAP-poor group:0.16%; P=0.02), Spirochaetota (PLVAP-rich group: 0.96%; PLVAP-poor group: 0.08%; P=0.01). At the class level (Figure 6B), Fusobacteriia(PLVAP-rich group:11.48%; PLVAP-poor group:0.16%; P=0.02), Clostridia (PLVAP-rich group: 4.72%; PLVAP-poor group: 0.38%; P=0.01), Negativicutes(PLVAP-rich group: 1.70%; PLVAP-poor group: 0.62%; P=0.04), Spirochaetia(PLVAP-rich group: 0.96%; PLVAP-poor group: 0.08%; P=0.01), Coriobacteriia(PLVAP-rich group: 0.73%; PLVAP-poor group: 0.04%; P=0.02). At the genus level (Figure 6C), Prevotella(PLVAP-rich group: 6.08%; PLVAP-poor group: 0.22%; P=0.01), Acinetobacter(PLVAP-rich group: 1.65%; PLVAP-poor group: 3.68%; P=0.04), Lactobacillus(PLVAP-rich group: 3.30%; PLVAP-poor group: 0.15%; P=0.02),Lachnoanaerobaculum(PLVAP-rich group: 1.73%; PLVAP-poor group: 0.02%; P=0.03), Treponema(PLVAP-rich group: 0.91%; PLVAP-poor group: 0.08%; P=0.01).
Predicted Functional Composition of Gut Microbiome with PICRUSt.
To determine whether changes in the composition of the microbiome in different groups (PLVAP-rich group; PLVAP-poor group) affect microbiome function, we inferred microbiome function using PICRUSt. COG analysis indicated the participation of identified proteins in a diverse number of biological processes, including amino acid transport and metabolism, energy production and conversion, carbohydrate transport and metabolism, transcription, translation, ribosomal structure, and biogenesis. Multiple microbial functions were disturbed in the PLVAP-rich group, including metabolism, cellular processes, and environmental information processing at KEGG level1(Figure 7A-F); Amino acid metabolism, lipid metabolism, carbohydrate metabolism at KEGG level2(Figure 7G-M); Glycolysis, apoptosis at KEGG level3 (Figure 7N-e).
Co‑expression and neighboring genes of PLVAP gene.
Based on the above results, we applied the GeneMANIA and STRING databases to predict PPIs for PLVAP (Figure 8A-B). As shown in Figure 8A, 20 proteins/genes might interact with PLVAP, and 3 genes including FUT8, SMPD2, and NRP1 have been studied to be involved in tumor progression (Tu, C. F. et al 2017; Tu, C. F. et al 2017; Wei, X. L. et al 2017). The PPI network contained 11 nodes and 25 edges and the average node degree was 5(P=0.01). Subsequently, the present study constructed a network analysis of the neighboring genes of PLVAP using the GEPIA2 database. The results are tabulated in Supplementary Tables S2.
High expression of PLVAP was associated with high infiltration levels of immune cells
On the basis of the above results, we investigated the relationship between PLVAP and immune cells. The results from TIMER showed that high PLVAP mRNA expression had significant positive correlations with CD4+ T cell (r =0.42, p < 0.001), CD8+ T cell (r =0.21, p < 0.001), Macrophage (r =0.29, p < 0.001), Neutrophil(r =0.21, p < 0.001), and Dendritic(r =0.24, p < 0.001)levels in STAD(Figure 9). Overall, the PLVAP was moderately correlated with CD4+ T cell.
Furthermore, the correlations between immune cell markers and PLVAP mRNA expression were identified using correlation modules in GEPIA2. In TIMER2, PLVAP mRNA expression was significantly associated with 19 of 32 immune cell markers in STAD (Table 3). Notably, the correlations between PLVAP and immune cells were similar to those found using TIMER2. PLVAP mRNA expression in STAD showed moderately correlated with Th9 cells, Th17 cells, Treg, and Dendritic. Treg and Th17 cells belonged to CD4+ T cells. Therefore, these results further confirm the findings that PLVAP is specifically correlated with immune infiltrating cells in STAD, demonstrating that PLVAP has a vital role in immune escape in STAD.