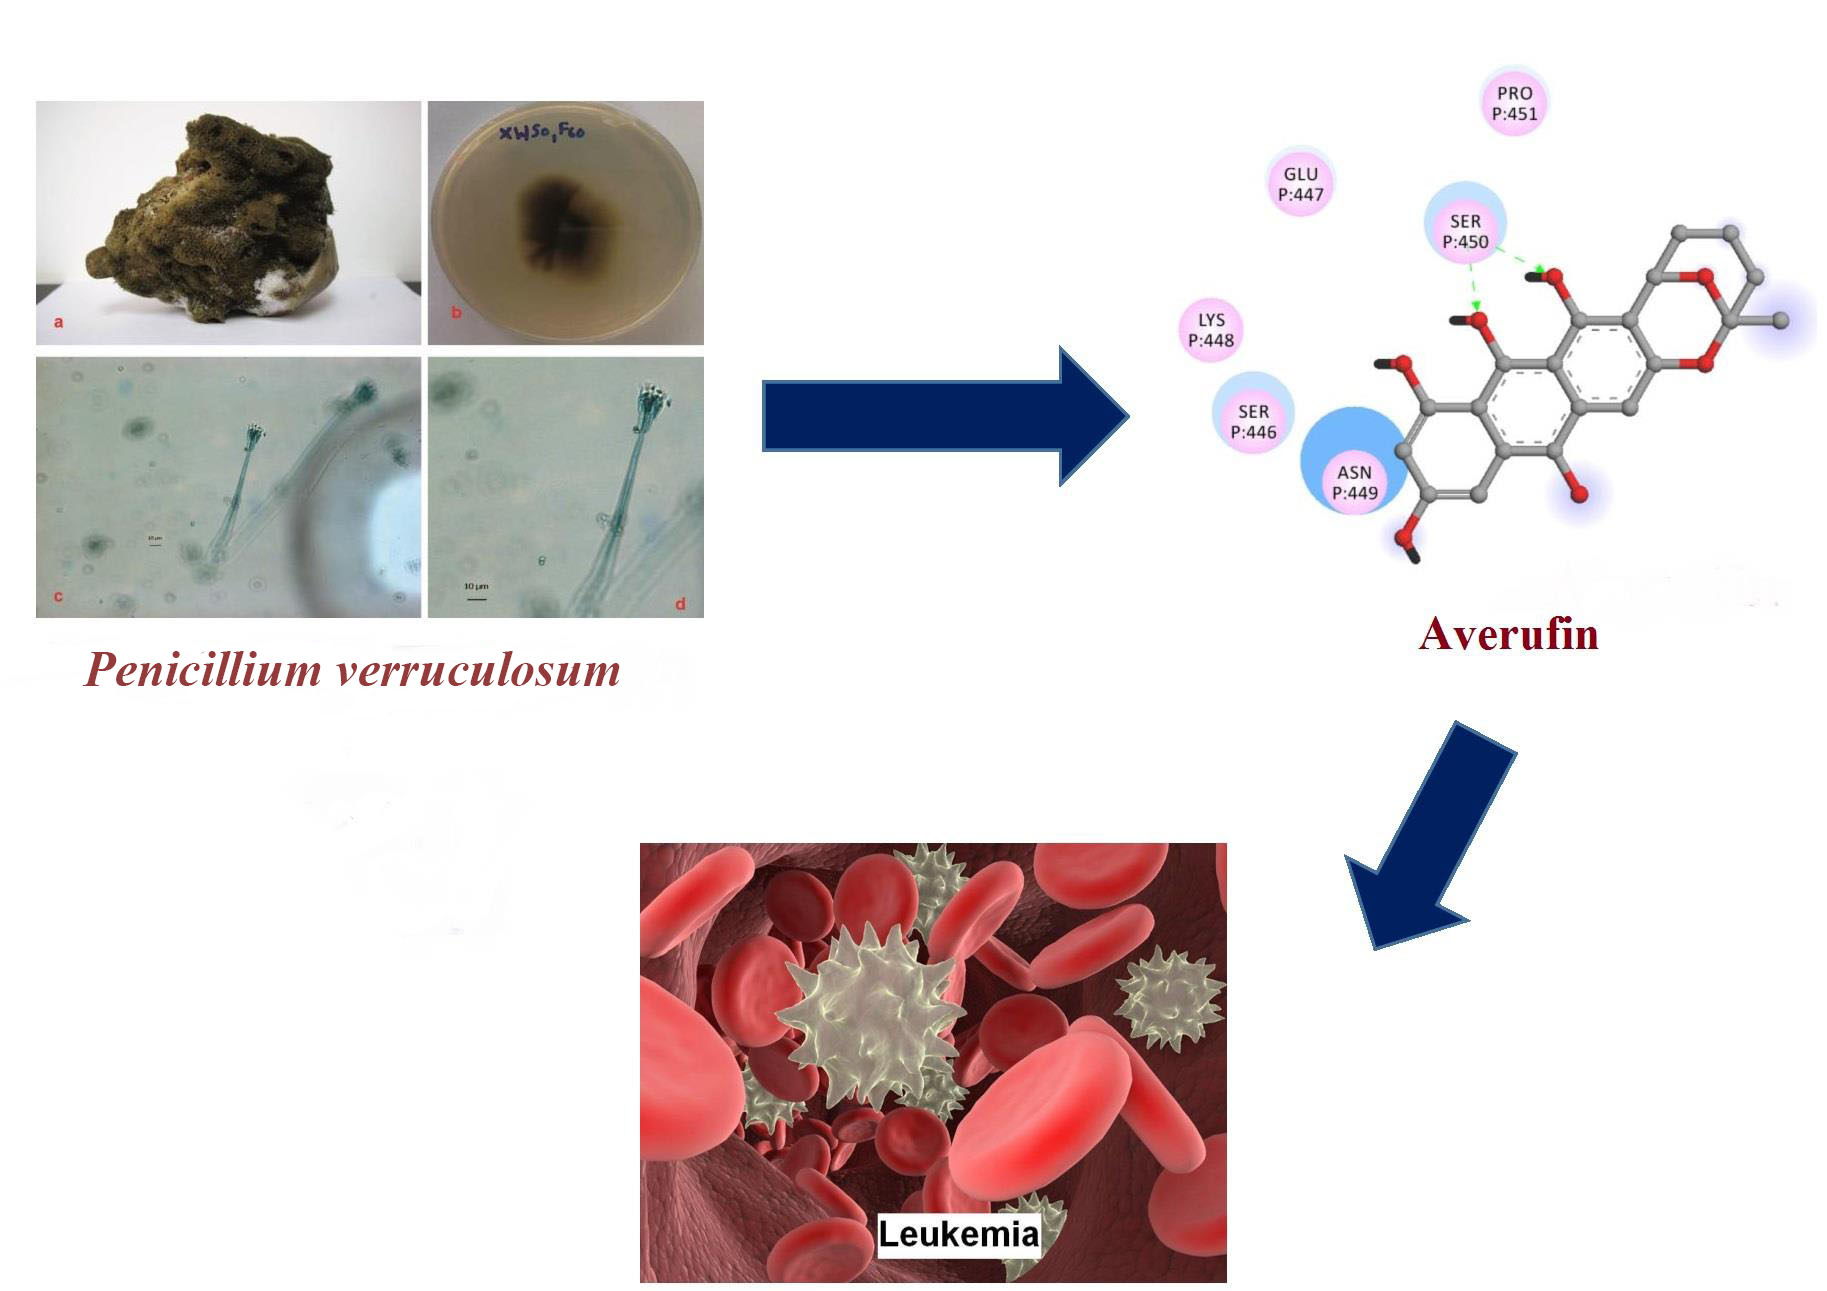
Identification of fungi
Two-week-old fungal colonies reached a diameter of 2-3 cm wide. The colonies seemed pale green by visual observations. Under Confocal microscopy (Leica Microsystems, Mannheim, Germany) the fungal hyphae stained with Lacto phenol blue seems to be slender with dispersed conidiophores (Fig.1). The fungal Strain XWSO1F60 was identified as P.verruculosum based upon the sequence obtained from the internal transcribed spacer (ITS) regions (GenBank accession number: KU891245) and it has 99% similarity with that of P.verruculosum strain C2-8 (JQ717338) (Fig.2).
Metabolite isolation
The organic extract of P.verruculosum strain XWSO1F60 yielded ten different metabolites, which comprise polyketides, xanthones, lactones, and nucleoside derivatives. Structural determination was carried out manually and referred to earlier NMR spectral data for their consistency (Fig.3).
Averufin (1):
Amorphous powder with orange red color: 1H-NMR (500MHz, DMSO): δH : 1.53 (3H, s, H3-6′ ), 1.63 (2H, m, H-4′), 1.72 - 2.01(2H, m, H-3′), 1.83 - 2.03 (2H, m, H-2′), 5.23 (1H, d, J = 2 .5 Hz, H-1ʹ), 6.53 (1H, d, J = 2.6 Hz, H-7), 6.95 (1H, s, H-4), 7.04 (1H, d, J = 2.6 Hz, H-5), 12.02 (1H, s, OH-8), 12.40 (1H, br s,OH-1); 13C-NMR (125 MHz, DMSO): δC : 15.29 (C-4′), 26.86 (C-3′), 27.37 (C-6′), 35.13 (C-2′), 66.07 (C-1′), 101.19 (C-5′), 107.10 (C-4), 108.0 (C-7), 108.4 (C-9a), 108.6 (C-8a), 108.9 (C-5), 115.98 (C-2), 133.18 (C-10a), 134.91 (C-4a), 158.16 (C-3), 159.83 (C-8), 164.23 (C-1),165.22 (C-6), 180.91 (C- 10), 188.88 (C-9). Both 1H-NMR and 13C-NMR data (Fig.S1a-b) turned out to be consistent with those reported earlier [18].
Aspergilol – A (2):
Amorphous Red powder: 1H-NMR (500MHz, DMSO): δH: 0.83 (3H, t, J = 6.0 Hz, H3-16), 1.24 (1H, m, H-13), 1.25 (2H, m, H2-15), 1.26 (2H, m, H2-14), 1.40 (1H, m, H-13), 1.76 (1H, m, H-12), 1.88 (3H, s, H3-7′′), 2.39 (3H, s, H-7′), 2.56 (1H, m, H-12), 4.41 (1H, t, J = 8.0 Hz, H-11), 5.66 (1H, d, J = 1.5Hz, H-4′′), 5.70 (1H, d, J = 1.5, H-2′′), 5.86 (1H, br s, H-6′′), 5.96 (1H, d, J = 1.5 Hz, H-4′ ), 6.37 (1H, d, J = 1.5 Hz, H-2′ ), 6.55 (1H, d, J = 1.5Hz, H-2), 6.99 (1H, s, H-5), 7.03 (1H, d, J = 1.5 Hz, H-4), 8.98 (s, -OH-5′′), 9.10 (br s, - OH-5′), 9.13 (s, OH-3), 10.95 (br s, OH-6), 12.21 (s, OH-1),12.88 (s, OH-8); 13C-NMR (125 MHz, DMSO): δC : 14.48 (C-16), 20.79 (C-7'), 21.29 (C-7''), 22.66 (C-15), 28.81 (C-13), 32.07 (C-14), 33.17 (C-12), 37.37 (C-11), 101.55 (C-4''), 105.88 (C-4'), 108.38 (C-2), 108.54 (C-5), 108.58 (C-8a), 108.77 (C-4), 108.88 (C-2''), 109.29 (C-1a), 109.62 (C-6''), 113.74 (C-2'), 122.97 (C-7), 126.47 (C-6'), 131.84 (C-5a), 135.28 (C-4a), 139.11 (C-1''), 139.7 (C-1'), 155.13 (C-5'), 155.93 (C-3'), 158.25 (C-3''), 158.82 (C- 5''), 164.08 (C-3), 164.24 (C-6), 164.49 (C-8), 165.1 (C-1), 181.65 (C-9), 189.28 (C-10). Both 1H-NMR and 13C-NMR data (Fig.S2a-b), turned out to be consistent with those reported earlier [19].
Rac-Butyrolactone (3):
Colorless powder : 1H NMR (500MHz, DMSO): δH: 3.50 (2H, s, CH2 H2- ), 3.79 (3H, s, OMe), 6.60, 6.69 (2H, d, J = 8.3 Hz, H2-17), 6.69 (2H, d, J = 8.3 Hz, H2-16), 6.98 (2H, d, J = 8.7 Hz, H2-8), 7.65 (2H, d, J = 8.7 Hz, H2-7), 8.16, 8.87 (1H, s, OH- ), 9.06 (1H, s, OH-); 13C NMR (125 MHz, DMSO): δC: 38.39 (C-6), 53.95 (OCH3), 85.13 (C-4), 115.03 (C-3’, C-5’), 116.28 (C-3”, C-5”), 121.42 (C-3), 123.59 (C-1’), 127.85 (C-1”), 129.22 (C-2”, C-6”), 131.58 (C-2’, C-6’), 138.53 (C-2), 156.70 (C-4”), 158.33 (C-4’), 168.37 (C-1), 170.22 (C-5). Both 1H-NMR and13C-NMR data (Fig.S3a-b), turned out to be consistent with those reported earlier [20].
Methyl emodin (4):
Orange powder: 1H NMR (500MHz, DMSO): δH: 2.37 (3H, s, H3-3), 3.89 (3H, s, H3-1), 6.81 (1H, d, J = 2.3 Hz, H-7), 7.08 (1H, d, J = 1.5 Hz, H-2), 7.18 (1H, d, J = 2.3 Hz, H-5), 7.39 (1H, d, J = 1.5 Hz, H-4), 13.19 (1H, s, 8-OH); 13C NMR (125 MHz, DMSO): δC : 21.31 (3-CH3), 56.28 (1-OCH3), 104.95 (C-7), 106.91 (C-5), 112.58 (C-8a), 114.33 (C-9a), 119.08 (C-4), 124.13 (C-2), 131.99 (C- 10a), 136.76 (C-4a), 146.60 (C-3), 161.64 (C-6), 163.39 (C-1), 164.43 (C-8), 182.28 (C-10), 186.31 (C-9). Both 1H-NMR and 13C-NMR data (Fig.S4a-b), turned out to be consistent with those reported earlier [21].
Tajixanthone hydrate (5):
Yellow needle crystals: 1H NMR (500MHz, CDCl3): δH: 1.34 (3H, s, H-17), 1.38 (3H, s, H-18), 1.87 (3H, s, H-23), 5.40 (H, brd, H-25), 2.36 (3H, s, H-24), 2.73 (1H, brd, J= 2.0 Hz, H-20), 5.17 (1H, d, J = 3.6 Hz, H-15), 4.34 (1H, dd, J = 2.5, 11.5 Hz, H-19b), 4.43 (1H, d, J = 3.2, 11.5 Hz, H-19a), 2.91 (1H, dd, J = 10.5, 14.5 Hz, H-14b), 3.35 (1H, dd, J = 2.5, 14.0 Hz, H-14a),4.57 (1H, s, H-22b), 4.79 (1H, s, H-22a), 6.72 (1H, d, J = 8.0 Hz, H-2), 6.90 (1H, s, H-25), 7.26 (1H, s, H-5), 7.41 (1H, d, J = 8.5 Hz, H-3), 12.65 (1H, s, 1-OH); 4.99 (1H, d, J =1.5 Hz, 25-OH); 13C NMR (125 MHz, CDCL3): 17.44 (C-24), 20.75 (OAcCH3), 22.57 (C-23), 25.26 (C-18), 26.90 (C-17), 29.66 (C-14), 44.90 (C-20), 63.18 (C-25), 64.55 (C-19), 72.40 (C-16), 78.62 (C-15), 109.20 (C-9), 109.69 (C-2), 112.24 (C-22), 115.11 (C-4),116.92 (C-12), 119.20 (C-5), 121.07 (C-8), 137.84 (C-3), 138.55(C-6), 142.62(C-21), 149.61 (C-7), 152.06 (C-11), 153.26 (C-10), 160.62(C-1), 184.41(C-13). Bothn1H-NMR and 13C-NMR data (Fig.S5a-b), turned out to be consistent with those reported earlier [22].
Pseudaboydin A (6):
White solid: 1H NMR (500MHz, CDCL3): δH: 0.95 (3H, s, H3-6′), 1.28 (3H, s, H3-5′), 1.50 (3H, s, H3-7′), 1.52 (2H, m, H2-3′), 1.65 (1H, m, H-1′), 1.71 (2H, m, H2-2′), 1.80 (1H, brs, 4′-OH), 2.45 (1H, brd, J = 13.6 Hz, H-1′), 7.13 (1H, d, J = 8.0 Hz, H-4), 7.55 (1H, s, H-7), 7.56 (1H, d, J = 8.0 Hz, H-5), 9.33 (1H, brs, 6-OH);13C NMR (125 MHz, CDCL3): δC: 16.58 (C-2′ ), 24.79 (C-6′ ), 31.32 (C-7′ ), 31.92 (C-5′ ), 33.83 (C-1′ ), 36.75 (C-3′ ), 75.35 (C-4′ ),77.66 (C-3), 118.90 (C-7),121.39 (C-5), 124.65 (C-4), 129.74 (C-7a), 137.02 (C-3a), 157.03 (C-6), 171.69 (C-1).Both 1H-NMR and 13C-NMR data (Fig.S6a-b), turned out to be consistent with those reported earlier [23].
Rugluxanthone - B (7):
Yellow solid: 1H NMR (500MHz, CDCL3): δH: 1.12 (3H, d, J = 6.9 Hz, H3-18), 1.14 (3H, d, J = 6.9 Hz, H3-17), 1.77 (1H, s, H-23), 2.26 (1H, s, H-24), 2.65 (1H, brm, H-20), 2.74 (1H, hept, J = 7.0 Hz, H-16), 3.81 (1H, d, J = 16.8 Hz, H-14b), 3.90 (1H, d, J = 16.8 Hz, H-14a), 4.27 (1H, dd, J =10.5 Hz, 2.7 Hz, H-19b), 4.35 (1H, dd, J = 10.5 Hz, 2.7 Hz, H-19a), 4.50 (1H, s, H-22b), 4.73 (1H, s, H-22a), 5.34 (1H, s, H-25), 6.71 (1H, d, J = 8.2 Hz, H-2), 7.35 (1H, d, J = 8.2 Hz, H-3), 7.10 (1H, s, H-5), 12.58 (1H, s, OH-1); 13C NMR (125 MHz, CDCL3): δC : 17.46 (C-24), 18.46 (C-17), 18.52 (C-18), 22.56 (C-23), 40.29 (C-16), 41.08 (C-14), 44.89 (C-20), 63.15 (C-25), 64.54 (C-19), 109.27 (C-9), 110.08 (C-2), 112.34 (C-4), 116.94 (C-12), 119.04 (C-5), 121.10 (C-8), 138.25 (C-3), 138.55 (C-6), 142.50 (C-21), 149.61(C-7), 151.98 (C-11), 153.07 (C-10), 160.91(C-1), 184.36 (C-13), 211.12 (C-15). Both 1H-NMR and 13C-NMR data (Fig.S7a-b) turned out to be consistent with those reported earlier [24].
Cordyol - C (8):
Yellow amorphous solid: 1H NMR (500MHz, DMSO): δH: 2.14 (3H, s, H3-7), 2.16 (3H, s, H3-7′), 3.60 (3H, s, H3-8), 6.06 (1H, s, H-3′), 6.17 (1H, s, H-4′), 6.24 (1H, s, H-4), 6.26 (1H, s, H-6′), 6.49 (1H, s, H-6), 9.35 (2H, brs, OH-3/3′); 13C NMR (125 MHz, DMSO): δC: 20.32 (C-7), 21.08 (C-7′), 100.62 (C-2′), 107.85 (C-6′),109.62 (C-4’), 112.48 (C-4), 112.56 (C-6), 127.54 (C-5), 135.12 (C-2), 139.32 (C-5′), 143.07 (C-1), 146.08 (C-3), 158.11 (C-3′), 159.01 (C-1′). Both 1H-NMR and 13C-NMR data (Fig.S8a-b) turned out to be consistent with those reported earlier [25].
Diorcinol (9):
Brown oil: 1H NMR (500MHz, CD3OD): δH: 2.24 (6H, s, H3-7, 7'), 6.22 (2H, br s, H2-2, 2'), 6.29 (2H, br s, H2-4, 4'), 6.38 (2H, br s, H2-6, 6'); 13C NMR (125 MHz, CD3OD): δC: 21.56 (5-CH3), 104.8 (C-2,), 111.7 (C-4, C-6), 112.05 (C-4’, C-6’), 141.66 (C-5), 159.53 (C-1, C-3), 159.59 (C-1’, C-3’). Both 1H-NMR and 13C-NMR data (Fig.S9a-b) turned out to be consistent with those reported earlier [26].
Deoxythymidine (10):
Brown amorphous powder: 1H NMR (500MHz, DMSO): δH: 1.85 (3H, s, H3-), 3.63 (1H, dd, J = 9.2, 2.3 Hz, H-), 3.68 (1H, dd, J = 10.4, 2.3 Hz, H-), 3.84 (1H, dd, J = 5.5, 3.0 Hz, H-), 4.31 (1H, br s, H-), 5.12 (1H, s, OH-), 5.33 (1H, s, OH-), 6.25 (1H, dd, J = 11.0, 5.2 Hz, H-), 7.77 (1H, s, H-), 11.35 (1H, s, NH); 13C NMR (125 MHz, DMSO): δC : 12.20 (5-CH3), 39.36 (C-2′ ), 61.28 (C-5′ ), 70.38 (C-3′ ), 83.70 (C-1′), 87.20 (C-4′), 109.32 (C-5), 136.08 (C-6), 150.42 (C-4), 163.70 (C-2). Both 1H-NMR and 13C-NMR data (Fig.S10a-b), turned out to be consistent with those reported earlier [27].
Biological Screening
Anticancer assay:
Anticancer screening for the ten compounds assessed by in-vitro methods reveals that compounds averufin (1), and cordyol-C (8), exhibit a significant anticancer effect against cancer cell lines compared to the other. Compound (1) shows strong anticancer activity towards HL60 cells with an IC50 value of 1.005 µM concentration and compound (8) with moderate activity (Table 1). The rest of the compounds did not show any positive anticancer effects.
Table 1
Anticancer activity of compounds from P. verruculosum.
|
Compounds
|
IC50 (µM)
|
|
K562
|
A549
|
DU145
|
H1975
|
MCF-7
|
Huh-7
|
HL7702
|
HL60
|
HeLa
|
MOLT-4
|
|
1
|
17.4
|
76.1
|
91.20
|
8.64
|
6.71
|
3.13
|
3.57
|
1.005
|
8.11
|
5.77
|
|
8
|
16.3
|
81.3
|
101.4
|
43.5
|
54.3
|
25.1
|
67.2
|
13.2
|
24.9
|
13.6
|
|
Taxol
|
0.003
|
0.0024
|
0.015
|
0.014
|
0.002
|
0.003
|
0.003
|
0.002
|
0.003
|
0.003
|
Antimicrobial assay:
None of the tested compounds was recorded with any positive antimicrobial, antituberculosis or antiviral activity in the screening.
Molecular Docking
Averufin showed a better docking score when compared to the standard drug against all the target proteins as evident by the protein-ligand interaction (Fig.4 and Table.2). The interacting amino acids present in the binding site and the hydrogen bonds are shown in Fig.4. The docking score ranged from -6.2627 to -10.2202 Kcal/mol. The best docking score of -10.2202 Kcal/mol was obtained against alpha-beta tubulin (1JFF) which was significantly higher than the standard taxol (-8.93775 Kcal/mol). Similarly, averufin showed quite a better docking hit against other target proteins. The docking study substantiates the in-vitro results.
Table 2
Molecular docking score against the target proteins
|
Compound
|
1A8E
(Kcal/mol)
|
2JOP
(Kcal/mol)
|
3BKY
(Chain P)
(Kcal/mol)
|
3BKY
(Chain H)
(Kcal/mol)
|
1JFF
(Kcal/mol)
|
|
Averufin
|
-9.0467
|
-8.28216
|
-6.2627
|
-7.69887
|
-10.2202
|
|
Taxol
|
-8.4532
|
-8.30715
|
2.51873
|
-7.30745
|
-8.93775
|
In-silico ADME predictions
Averufin has three hydrogen bond donors and seven hydrogen bond acceptors. The Molecular weight and log P value are within the acceptable limit of 368.34 g/mol and 2.98 respectively (Table.3). Above all the oral bioavailability of averufin is marked as well both by Veber and Egan’s rules. This analysis revealed that all the pharmacokinetic parameters of averufin are within the permissible range confined for human use, which coherently divulges that averufin could be a potential drug-like molecule.
Table 3
ADME- validation of the candidate compound
|
Compound
|
MW
|
logP
|
HB Donors
|
HB Acceptors
|
Lipinski Violations
|
Solubility (mg/l)
|
Oral Bioavailability
|
Oral Bioavailability (EGAN)
|
Phospholipidosis
|
Status
|
|
(VEBER)
|
|
Averufin
|
368.34
|
2.98
|
3
|
7
|
0
|
5481.6
|
Good
|
Good
|
Non Inducer
|
Accepted
|
|
Taxol
|
853.91
|
3.66
|
4
|
15
|
2
|
1122.91
|
Low
|
Good
|
Non Inducer
|
Accepted
|