Crosslinked BEV was prepared by reacting diglycidyl 1,2-cyclohexane- dicarboxylate (DC) with tetraethylenepentamine (TEPA) in a fixed epoxy/amino (3.5:1) stoichiometry, ensuring that all the amino groups were consumed completely. The reaction product between DC and TEPA is denoted as DC-TEPA, where the hydroxyl esters were generated via the reaction of glycidyl esters with amino groups (Figure 2a). After the reaction, all the amine groups were converted into tertiary amines embedded in the vitrimer networks, which could effectively catalyze hydroxyl ester exchanges28, 34, 35. Figure 2b shows the effect of temperatures on the stress relaxation of the DC-TEPA in the absence of an external catalyst. At lower temperatures 140°C–150°C, the transesterification rate was very slow due to the freezing of the crosslinked networks. The relaxation time τ at 160oC, 170oC, 180oC, 190oC and 200°C were 152min, 79.9min, 28.5min, 14.5 min and 5.5 min, respectively, suggesting that the tertiary amines embedded in the DC-TEPA acted as catalytic centers for transesterification that accelerated the stress relaxation. Figure 2c shows the τ values of the DC-TEPA fitted by the Arrhenius equation. An excellent curve fit was obtained and yielded a calculated Ea of 139.8 kJ mol−1, which was in the range of most epoxy-based vitrimers containing extra catalyzers (70–150 kJ mol−1)27, 40-42. Based on the stress relaxation results, the topology of the DC-TEPA could be easily and efficiently arranged via internal tertiary amine without additional catalysts.
To compare with the DC-TEPA, reference vitrimers (DC-DDM, DC-DDM-TBD, DC-GL-2E4MI and DC-GL-TBD, see supporting information) were also prepared (Scheme S1). Both DC-TEPA and the reference vitrimers exhibited good curing profiles (Figure S1) and completely curing (Figure S2), and their thermal properties are shown in Figure S3 and S4. The strength of the DC-TEPA (>65 MPa) was similar to that of the DC-DDM, which was much higher than those of the other vitrimers (Figures S5a and b). Due to the embedded tertiary amines, the DC-TEPA exhibited faster stress relaxation than the reference vitrimers containing transesterification catalysts, implying that the dynamic covalent bonds at elevated temperature were active enough to reconstruct the crosslinked networks. However, tertiary amines obtained from the DDM could not achieve this effect (Figure S6). The storage modulus of the DC-TEPA was similar to that of the DC-DDM-TBD, but lower than that of the DC-DDM and higher than that of the DC-GL systems (Figure S7). The crosslinked constructions were confirmed by dissolution experiments (Figure S8). The vitrimers showed slight swelling, but did not dissolve in good solvents, even after a long time.
As previously stated, the topological rearrangement of the DC-TEPA network could endow the vitrimers with recyclability. As a proof of concept, the recyclable nature of the DC-TEPA was demonstrated by cutting the samples into small pieces and then hot pressing them into new coherent samples (Figure S9). Fourier-transform infrared spectroscopy (FTIR) revealed no major variations between the recycled and original samples (Figure S10a). In addition, the tensile strengths were measured for the recycled networks P1–P3 (Figure 2d). P1 showed a lower stress and breaking strain than the original one. In the next recycling step, a steady state was achieved because P3 did not change much from P1 and P2. The lower strain-at-break values for P1 and P2 could be ascribed to the unrecovered results of the broken permanent covalent bonds. The Tg value of P1 increased from 69.5°C to 85.3°C due to post curing and then the value tended to stabilize with increasing reprocessing time (Figure S10b). The thermostability and stress relaxation after reprocessing were almost the same as those of the original materials (Figures S10c and d). Hence, we can rule out no occurrence of side reactions that would deteriorate and change the chemical nature of the vitrimers.
Another option is physical recycling. The ground DC-TEPA powders (GR) were combined with fresh uncured DC-TEPA resins and then cured at room temperature (Figure S11), which are denoted as DC-TEPA-yGR, where y represents the percentage of GR in the DC-TEPA. The properties of the DC-TEPA-yGR before and after heat treatment are shown in Figure S12.The tensile strength of DC-TEPA-yGR exhibited a slight decrease. After thermal treatment at 180°C, the strength of the DC-TEPA-yGR significantly increased compared with that before heating (Figure 2e). Before thermal treatment, a small amount of granulated powder was embedded in the resin matrix, and most powder particles had fallen off from the cured resins (the red circles in Figure 2f). After thermal treatment, the powders disappeared completely in the cured resin (Figure 2g), indicating the powder had fully fused with the fresh vitrimer via transesterification.
The PL properties of the vitrimers were investigated. The DC-TEPA produced a stronger blue light than the reference vitrimers, as shown in Figure S13. The emissions of the DC-TEPA were measured at various excitation wavelengths from 315 to 455 nm (Figures 3a and S14). The results showed a clear excitation-dependent emission (EDE) effect with the transformation from a dominant short-wavelength emission (∼450 nm) to a weak long-wavelength emission (∼500 nm). At an excitation of λex = 365 nm, the highest emission intensity (λem = ~450 nm) was obtained. The significant EDE indicated that DC-TEPA had multiple emission centers and good light stability. The emission spectra of the DC-TEPA heat-treated at different temperatures are shown in Figure S15a, whereas the normalized peak value with temperature is shown in Figure 3b. When the temperature rose, the strength of the emission peak decreased. This decline was more pronounced above Tg (~70°C). The emission spectra of the cured DC-TEPA at 180°C for different times are shown in Figure S15b and the normalized peak value with time is shown in Figure 3c. The intensity of the emission peak decreased with time. The decrease in the PL intensity with temperature or time can be attributed to two factors: first, the cluster structures of the vitrimers could not return completely to their initial state after high-temperature treatment above Tg, which inhibited the through-space communications arising from n-r*, n-p*, and p-p* orbital overlap, as well as hydrogen bonding and other weak interactions; second, the sample surfaces could gradually form ultraviolet (UV)-absorbing thermal-oxidation products43.
The effects of immersion in solvents with different polarities, including ethanol, acetone, tetrahydrofuran, ethyl acetate, and ether, on the PL properties of the materials are shown in Figures 3d and S15c. The PL intensities of the DC-TEPA samples soaked in the solvents dropped the most, which was due to an increase in the gap between the luminous clusters in the crosslinked network caused by the immersion of solvent molecules, suppressing through-space communications between clusters. Figure 3e shows the PL spectra of the DC-TEPA before and after four months. The peak intensity of the placed sample decreased somewhat, while the peak position and breadth were the same as before, demonstrating that the vitrimer had higher durability.
We know that each TEPA molecule contained seven active hydrogen atoms that could react with seven epoxy groups. As long as the average numbers of involved active hydrogens on the TEPA were greater than or equal to three, a crosslinked structure was formed. To design different crosslink densities, the proportion of hydrogen on the TEPA-involved crosslinking reaction (r) varied from 3/7 to 1 when the molar ratio of DC to TEPA was varied. The emission peak position of the DC-rTEPA was at 450 nm without depending on the crosslink densities, while the difference in the PL intensity of the DC-rTEPA was significant, the highest of which was for the DC-TEPA (Figure 3f). The higher emission was attributed to the facilitated through-space communications via the enhanced crosslinking,12 which was further confirmed by differential scanning calorimetry(DSC) results as shown in Figure S15d. A higher Tg value related to the crosslink density corresponded to a stronger PL intensity.
The prepared vitrimer has potential applications in the field of anti-counterfeiting because it shows different colors in natural and ultraviolet light. As a proof of concept, the uncured DC-TEPA resin was cast into a cartoon mold with different animals (Figure 3g). A bright blue pattern appeared when it was irradiated at 365 nm. The DC-TEPA could be screen-printed on filter paper or glass with the pattern of “AHUT,” and it exhibited good adhesion with substances. The patterns showed strong blue light under 365-nm UV radiation (Figure 3h). After the filter paper or glass was soaked in water for 3 days, the emission was still strong (Figure 3i), indicating that the waterproof effect was very good. These results demonstrated that the room- temperature-cured blue vitrimer with stable adhesion is very suitable for anti-counterfeiting applications of paper, glass, and other materials.
To explore the luminescence formation mechanism of the vitrimer, the PL spectra of the uncured DC-TEPA were measured in situ at 50°C at intervals, as shown in Figure S16a. In the initial stage, the peak at ~415 nm belonged to TEPA emission. As the reaction proceeded, the peak shifted to 450–455 nm (Figure S16b), indicating a large amount of TEPA had reacted with DC to form oligomers. After 30 min of reaction, the peak position of ~450 nm did not change, but the normalized emission intensity increased significantly (Figure 4a). The emission intensity grew the fastest at t = 26 min from the differential curve. The largest value was achieved at t = 31.5 min from the intersection of the tangent lines corresponding to the critical cluster concentration, after which the emission entered a stable state. This result implied that the time t = 31.5 min may be a turning point for the structural change in the DC-TEPA, which was speculated to be the gel time. To prove this hypothesis, the gel time was measured from the isothermal curves and the rheological results. The isothermal curing of the DC-TEPA mixture was conducted at 50°C, and the percent conversion over time was also calculated, as shown in Figure 4b. The gel point calculated from Flory–Stockmayer (F–S) gelation theory44, 45 was pc = 40.8% and the corresponding gel time was 33.6 min, which was in agreement with the turning time of the PL intensity. Figure 4c shows the storage (G') and loss (G") moduli measured during the curing process of the DC-TEPA resin at 50°C. The cross-over point of the two moduli attributed to the gel time occurred at 30.8 min, which was also consistent with the turning time of the PL intensity. The actual gel experiment was also conducted to evaluate the theoretical values (Figure 4d). As the reaction proceeded at 50°C, the liquid DC-TEPA gradually converted into a high-viscosity state. At 30 min, the gel of the DC-TEPA was achieved. These results proved that the gel time of the DC-TEPA at 50°C occurred in the range of 30–33.6 min. The fact that the emission intensity entered a stable state after 31.5 min implied that sol–gel transitions of the vitrimers had occurred. The reasons for this were as follows. In the initial stage, except for possible intramolecular O···H or N···H contacts in the DC and TEPA moieties, an unstable small molecular structure resulted in the isolation of ester groups and amidogens without sufficient through-space communications (Figure 4e). As the reaction proceeded, the sub-clusters of through-space communications were gradually generated (Figure 4f), driven by structural entanglements, inter- and intra-molecular electrostatic interactions produced by dipole or transient dipoles, or even aggregation. The non-conjugated groups got closer, which led to the formation of cluster luminogens, facilitating the contact of neighboring oxygens and carboxylates. When the reaction between the DC and TEPA reached the gel state (Figure 4g), the immobilization suppressed many non-radiative transitions, including vibrations and rotations, pushing excited electrons back to the ground state through radiative transitions (Figure 4i). This gel state also corresponded to the evolution of the emission intensity, indicating that the clusters of non-conventional groups played a critical role in the emission. Immobilization after the gel state had an indirect enhancement effect on the luminescence with little impact on the energy levels, resulting in a higher PL intensity with a minimal change in the emission wavelength.
According to the white-light design principle, if the yellow element was integrated into the DC-TEPA, white light would be obtained (Figure 5a). Organic dyes with rings that produce light in the range of wavelengths from ultraviolet to near infrared are common ideal luminescent materials. We tried to react a variety of organic dyes (perylene-tetracarboxylic dianhydride (PD), naphthalene-tetracarboxylic anhydride(NT), pyromellitic dianhydride (PM)) with DC to create yellow light and found that only DC-PD could emit yellow light (Figure 5b). However, PD alone in the powder state could not emit any light via 365-nm excitation, which produced a yellow emission in the alkali solution under UV excitation (Figure S17), indicating that PD obeyed aggregation-caused quenching (ACQ) mechanism. Figure 5c shows the images of the DC-PD reflux in the range of 150°C–200°C after 100 min. After refluxing at 150°C–170°C, the color of the solution was still dark red and the visible transparency was very low, while the PL peak at 600–650 nm did not correspond to yellow wavelengths and the PL intensity was very weak (Figure S18). This result indicated that the amount of PD reacting with DC was very low in this condition and could not produce a satisfactory yellow element, because the active period of the reaction between the DC and PD was from~170°C to ~200°C, as observed from the DSC curves (Figure S19). When the reflux temperature was 180°C, the solution was yellow with a high transparency, and the PL intensity was the largest at 530 nm (Figure S18). As the reaction temperature continued to increase to 190°C–200°C, the PL intensity decreased slightly, so the optimal reflux temperature was 180°C. Figure 5c shows the images of the DC-PD refluxed at 180°C for different times. The DC-PD was still dark red after the reflux time of 60 min. By continuing to increase the reflux time, the DC-PD gradually turned a bright yellow and the wavelength of the DC-PD also shifted from ~610 nm to ~530 nm (Figure S20), the intensity of which reached the highest at 100 min, indicating that the PD had been grafted to the DC, forming MPL.
To achieve WEVs, the synthesis strategy of white-light DC-xPD-TEPA(x indicates that in 1 mole of epoxy group, x × 10−4 moles of epoxy groups were reacted with PD) is shown in Scheme S2. The curing, thermal and mechanical properties of the DC-xPD-TEPA were also measured, as shown in Figures S21–S23. Due to the lower PD levels in the DC-xPD-TEPA, the properties such as the curing action, Tg, and tensile strength were nearly identical to those of the DC-TEPA. The product structure of the DC-PD was still hydroxyl esters, which could be catalyzed by a tertiary amine embedded in the vitrimer network. As a result, good reprocessing performances were achieved without extra catalyst (Figures S24 and S25).
To explore the effect of the ratio of PD and TEPA to DC on the PL properties, the PL spectra of DC-xPD-TEPA with different PD contents were measured at a 365-nm excitation wavelength. Interestingly, the DC-xPD-TEPA fluoresced with a white-light emission due to the overlapping of short- and long-wavelength peaks (Figure S26). After the reaction of PD with DC, the perylene group on the PD was grafted onto the DC and yellow light was generated at this time. The remaining epoxy groups were crosslinked by TEPA at room temperature, so blue light was generated at that moment. Thus, both yellow light and blue light were simultaneously integrated into the DC-xPD-TEPA network. By adjusting the content of PD in the DC-xPD-TEPA, the ratio of yellow light to blue light could be tailored, which generated white light at the target ratio.
The uncured DC-xPD-TEPA was used as an encapsulating material for 365-nm LED chips without phosphors. As can be seen from Figure 5d, the LED could emit dazzling white light, under which the patterns were clearly visible. The PL spectra of the LED were obtained by the integrating sphere (Figures 5e and S27). The LED encapsulated by the DC-2PD-TEPA exhibited a broad white-light spectrum with dual emission peaks at around 430 and 550 nm. Furthermore, a white-light emission with color coordination CIE (0.30, 0.32) (Figure 5f) and color temperature (CCT) 7196 K was obtained under a 365-nm excitation. In order to observe the change in the proportion of blue light (400–475 nm) and yellow light (475–700 nm) in the spectra more clearly and accurately, the integral areas of the spectra were calculated, and the results are shown in Figure 5g. With the increase in the proportion of PD, the area proportion of the blue light decreased from 49% for the DC-1PD-TEPA to about 37% for the DC-2PD-TEPA, and then the value tended to be stable. The area proportion of yellow light increased from 51% for the DC-1PD-TEPA to about 63% for the DC-2PD-TEPA, and then the value tended to be stable. Thus, a WLED can be achieved via the balance of blue and yellow light, which originated from DC-TEPA and DC-PD.
The CIE, CCT, and color rendering index (CRI) values of the LEDs encapsulated by the DC-xPD-TEPA were obtained under the current of 100 mA, as shown in Table 1. The CIE and CCT of the DC-1PD-TEPA were (0.25, 0.26) and 20517 K, respectively, and those of the DC-1.5PD-TEPA were (0.28, 0.31) and 8655 K, which corresponded to blue light. By continuing to increase the PD content, the corresponding parameters of the DC-2.5PD-TEPA were (0.30, 0.31) and 7610 K, respectively, and those of DC-3PD-TEPA were (0.30, 0.32) and 7232 K, respectively, which were very close to the coordinates of standard white light (0.33, 0.33). These results indicated again that the white-light emission could be achieved by regulating the ratio of yellow light to blue light. The reliability of the LED devices encapsulated by the DC-2PD-TEPA was also explored. The normalized curves of the CIE, CCT, and CRI values over time are shown in Figure S28. When the currents were 60–100 mA, the normalized CIE, CCT, and CRI changed very little, and they were nearly on a horizontal line, indicating that currents had a negligible influence on the WLEDs' luminous performances.
Table 1. Test results of DC- xPD-TEPA for LED encapsulations without phosphor.
|
Encapsulating materials
|
IF(mA)
|
VF(V)
|
CIE(x,y)
|
CCT(K)
|
CRI
|
Blue/Green
|
|
DC-1PD-TEPA
|
100
|
3.35
|
(0.25,0.26)
|
20517
|
93.1
|
49/51
|
|
DC-1.5PD -TEPA
|
100
|
3.35
|
(0.28,0.31)
|
8655
|
91.6
|
40/60
|
|
DC-2PD -TEPA
|
100
|
3.35
|
(0.30,0.32)
|
7196
|
93.2
|
37/63
|
|
DC-2.5PD -TEPA
|
100
|
3.35
|
(0.30,0.31)
|
7610
|
95.3
|
39/61
|
|
DC-3PD -TEPA
|
100
|
3.35
|
(0.30,0.32)
|
7232
|
95.8
|
37/63
|
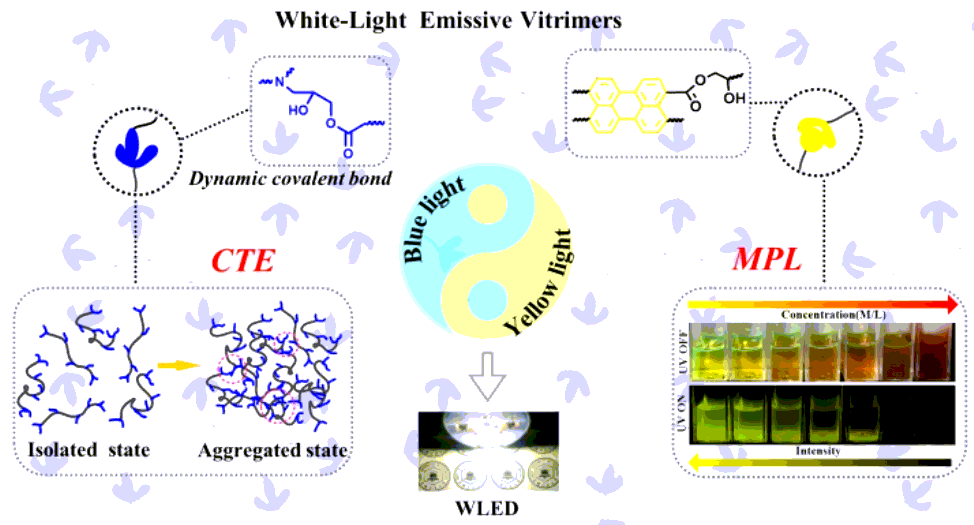
In summary, the white light was designed via the balance between blue and yellow light. The strongly conjugated PD was introduced into the chain segments of the vitrimers, which generated MPL. The conjugated part of the MPL emitted yellow light at a 365-nm excitation. The stoichiometric TEPA was added to the DC-PD and cured at room temperature to form a crosslinked network. After the remaining DC in the DC-PD reacted with the TEPA, the chain segment generated a large number of clusters that produced blue-light emission obeying the CTE mechanism. The two complementary colors, i.e., blue light and yellow light, were sufficient for the components to produce white light. By adjusting the proportion of PD like a seesaw, the vitrimers emitted white light by 365-nm LED excitation.