Prognosis-related CRs risk score model. In this study, we systematically analyzed the function and prognostic value of CRs in KIRC by several effective statistical methods. The KIRC data were exported from the TCGA, including 541 tumor samples and 72 normal samples. The limma R package was utilized to pick out the differentially expressed CRs. A total of 853 CRs were identified, and with the standard thresholds |logFC| > 1 and FDR < 0.05, we identified 127 differentially expressed CRs in the renal clear cell carcinoma tissues compared with the normal colon tissues. The layout of the top 50 CRs sorted by FDR value is shown in Figure 1. By performing univariate Cox regression analysis, 20 prognosis‐associated CRs remained(Figure 2). Then, the final 11 candidate CRs associated with prognosis were analyzed by LASSO Cox regression. (Table 1). Use these eleven CRs to build the final prognostic risk model. Calculate the risk score of each patient according to the formula we introduced as follows: Risk score= (0.0384 * Exp HJURP) + (0.0217 * Exp TTK) + (0.0068 * Exp TOP2A) + (0.0114 * Exp PBK) + (0.0254 * Exp KMT5C) + (0.0059 * Exp ORC1) + (-0.0040 * Exp GLYATL1) + (-0.0039 * Exp NEK6) + (0.1874 * Exp TAF10) + (-0.0022 * Exp RIT1) + (-0.0585 * Exp RAD51). Subsequently, we classified all patients into high or low risk group based on the median risk score. The results showed that the overall survival (OS) of the low-risk group was significantly better(P<0.05)(Figure 3A). In order to further assess the prognostic utility, we performed ROC curve analysis to evaluate the diagnostic value of the risk model. The results showed that the accuracy of the model in predicting the prognosis at 1, 3, and 5 years was 0.718, 0.71, and 0.761, respectively(Figure 3B). The expression heat map of the high and low risk group, the survival status of the patient, and the risk score of the signature consisting of seven RBPs are shown in Figure 3C. To investigate the generalizability of this model, we randomly selected 70% of the patients from this dataset as a validation dataset. OS in the low-risk group increased significantly in the validation dataset(Figure 4A-C). Our results indicate that the risk model has better specificity and sensitivity.
CRs risk model for predicting survival. We conducted a univariate and multivariate Cox proportional hazards analysis to clarify the impact of the risk score on prognosis. In these analyses, high risk score, as well as patient age, tumor grade and stage, indicated poor prognosis(P<0.05)(Figure 5A,5B). These results demonstrated that CR-based signature was an independent prognostic indicator for KIRC patients.
Association between CRs-based prognostic models and clinical features. Chi-square test or Fisher's test was used to test whether the model was involved in the progression of KIRC. The results showed that there were significant differences in patient gender, tumor grade, and tumor stage between different risk groups, but no significant differences in age(Figure 6A,6B). Subgroup analysis was further performed on all patients. The results(Figure 7) showed that patients in the low-risk group had longer survival in all subgroups, such as whether they were older than 60 years old, male or female, tumor differentiation, and tumor stage.
Construction of a nomogram for KIRC patients. In order to develop a simple way for clinical prediction of patient OS, we integrated all clinical characteristics to build a nomogram for predictive model(Figure 8A). The nomogram is an effective way to show the Cox regression results. We draw a vertical line to determine the expression of the gender, and determine the score of the factor from the normalized 0 to 100. Use the same method to get the score of the remaining characteristics, and add all the scores. The sum of these scores is on the total score axis, and a downward line is drawn to the survival axis to determine the probability of survival for 1, 3, and 5 years. The C-index of the nomogram is 0.765, which shows that the nomogram can help relevant practitioners make clinical decisions for patients with KIRC. The results of the calibration curve show that the predicted value of the patient is consistent with the actual survival time(Figure 8B).
Biological function analysis of different expressed CRs and GSEA. All differentially expressed CRs were analyzed to further explore their functions and mechanisms. The most highly enriched BP associated GO term were histone modification and chromatin remodeling(Figure 9A). In the CC analysis, the CRs significantly enriched in cytoplasmic ribonucleoprotein granule and chromosomal region(Figure 9A). For MF terms, histone binding and hydrolase activity, acting on carbon−nitrogen (but not peptide) bonds were enriched by most CRs (Figure 9A). Besides, the results of KEGG pathway analysis showed that Lysine degradation and Homologous recombination were significantly enriched(Figure 9B). GSEA analysis helps us to further understand the molecular mechanisms by which CRs are involved. The results showed that Aldosterone synthesis and secretion, IL-17 signaling pathway, Pathogenic Escherichia coli infection and PI3K-Akt signaling pathway were mainly enriched in the high-risk group, while those in the low-risk group were mainly enriched in Non-homologous end-joining(Figure 10).
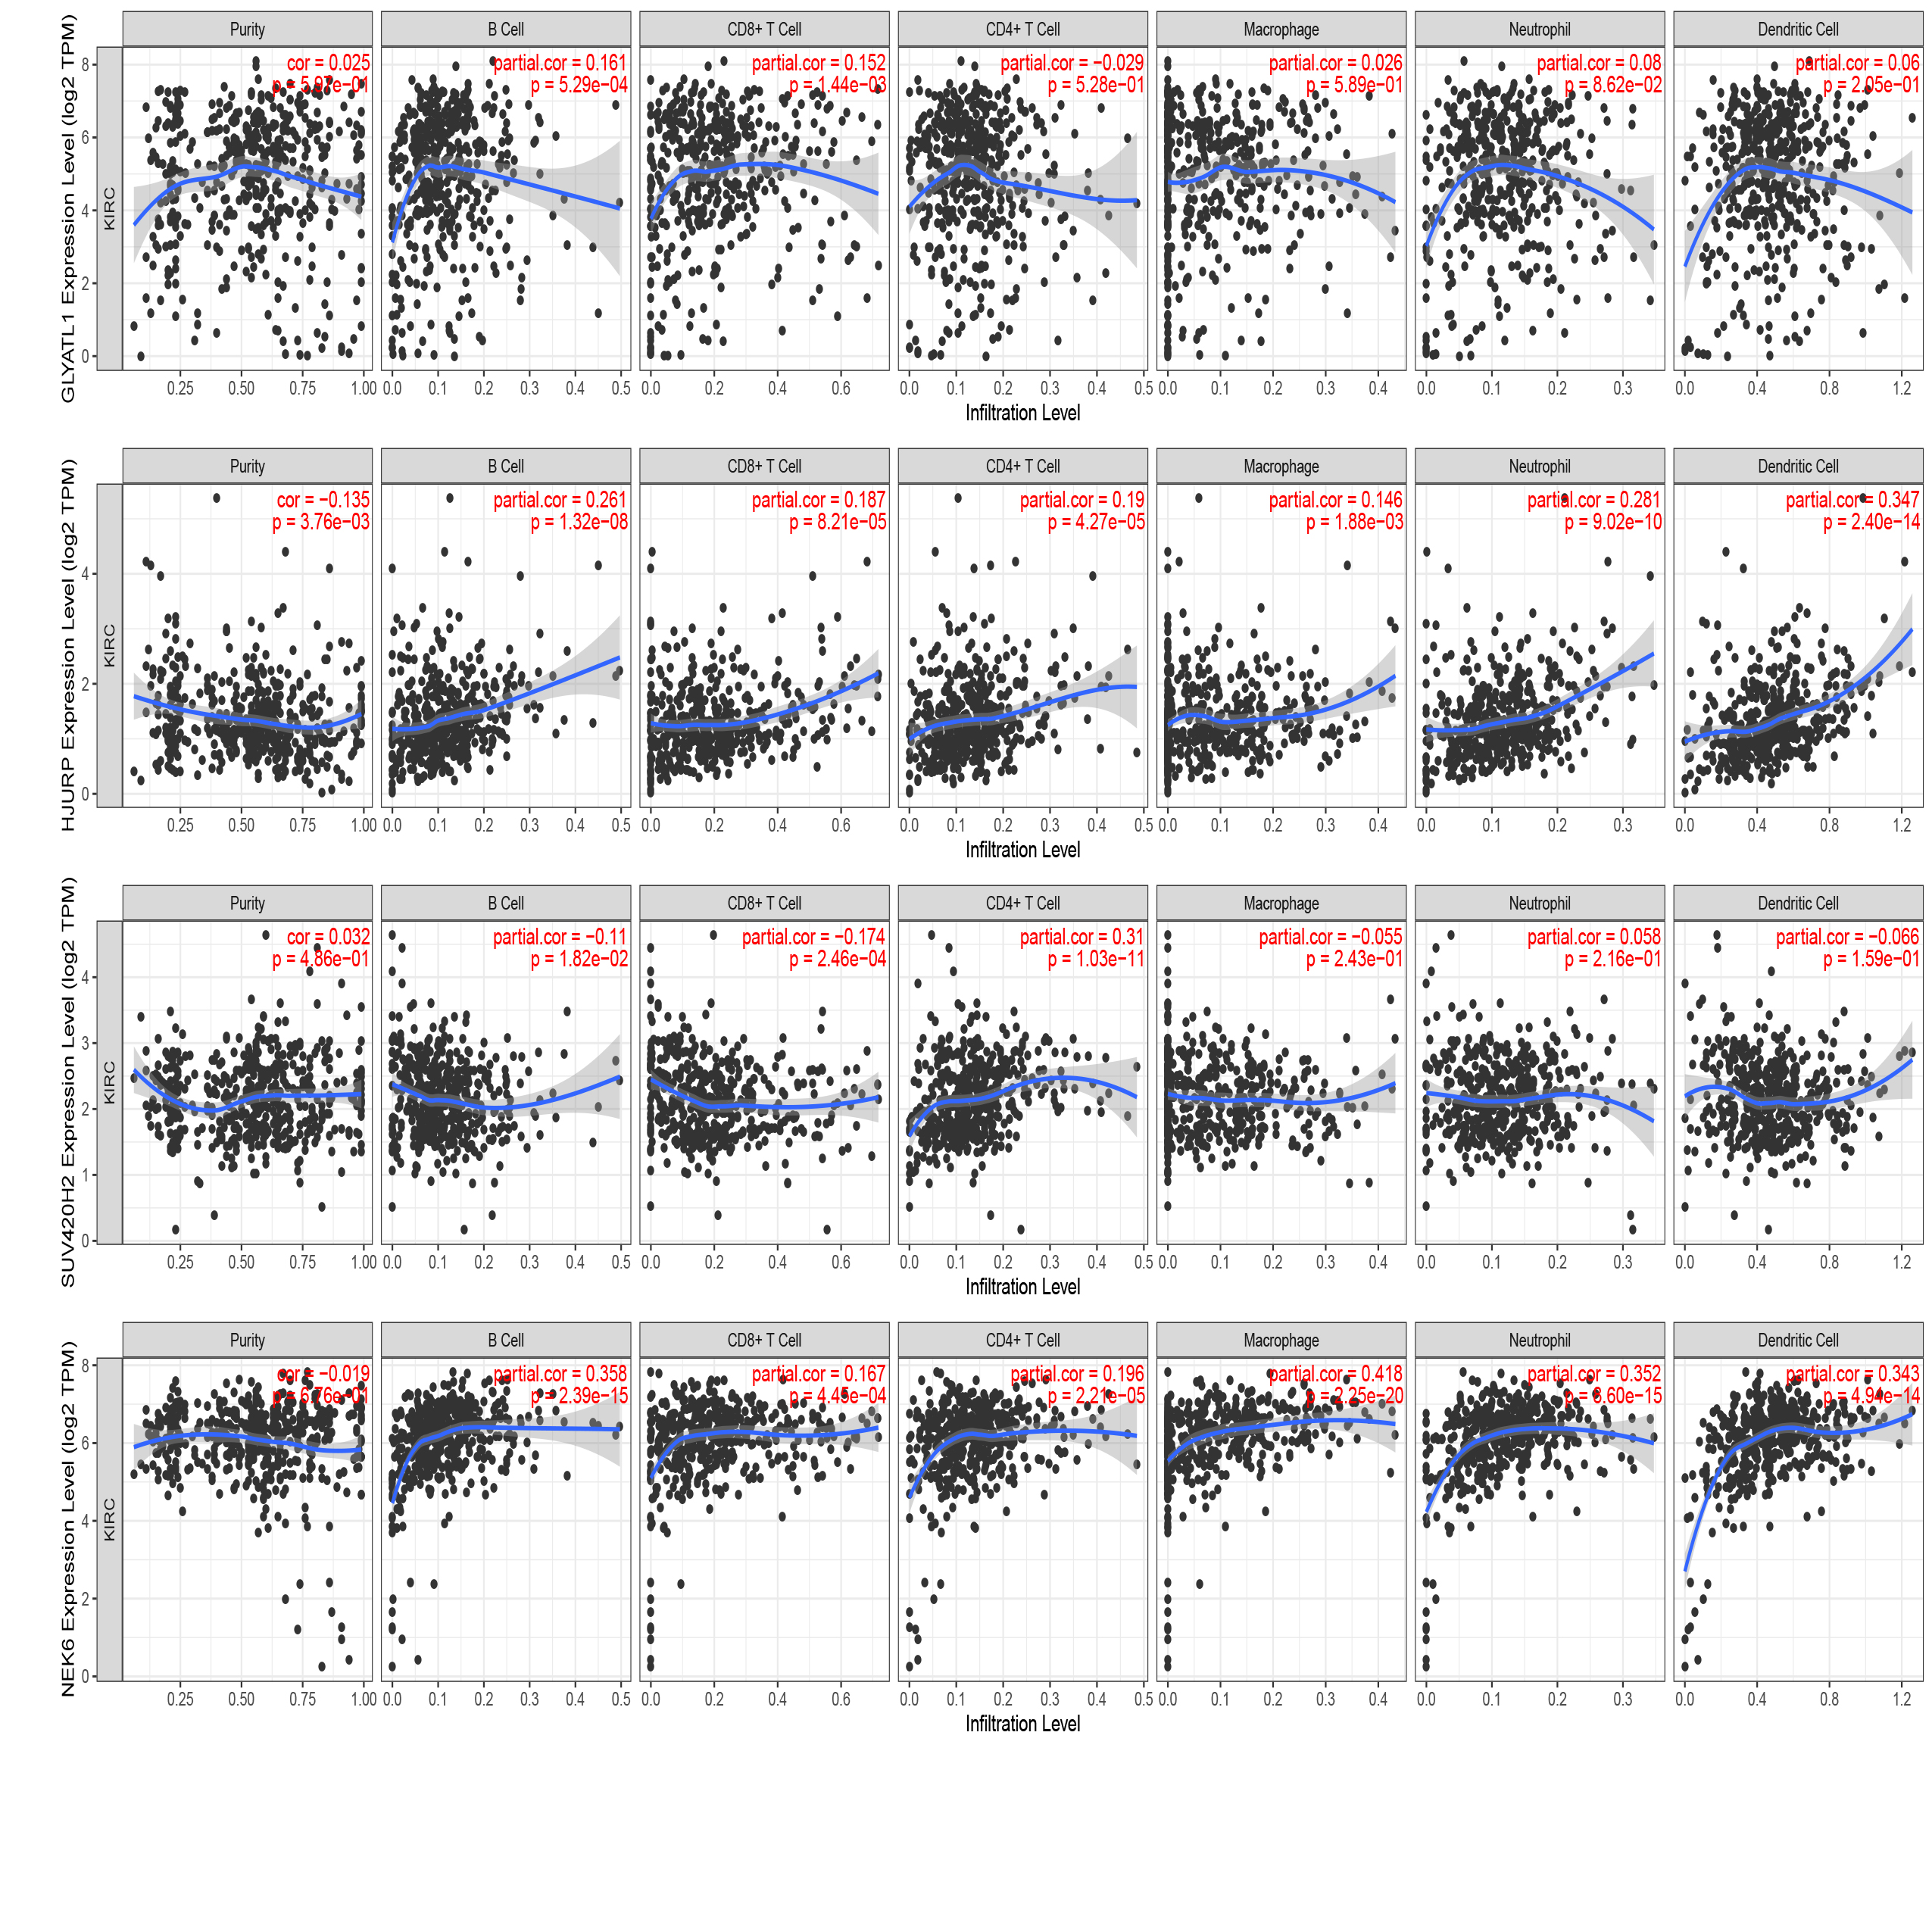
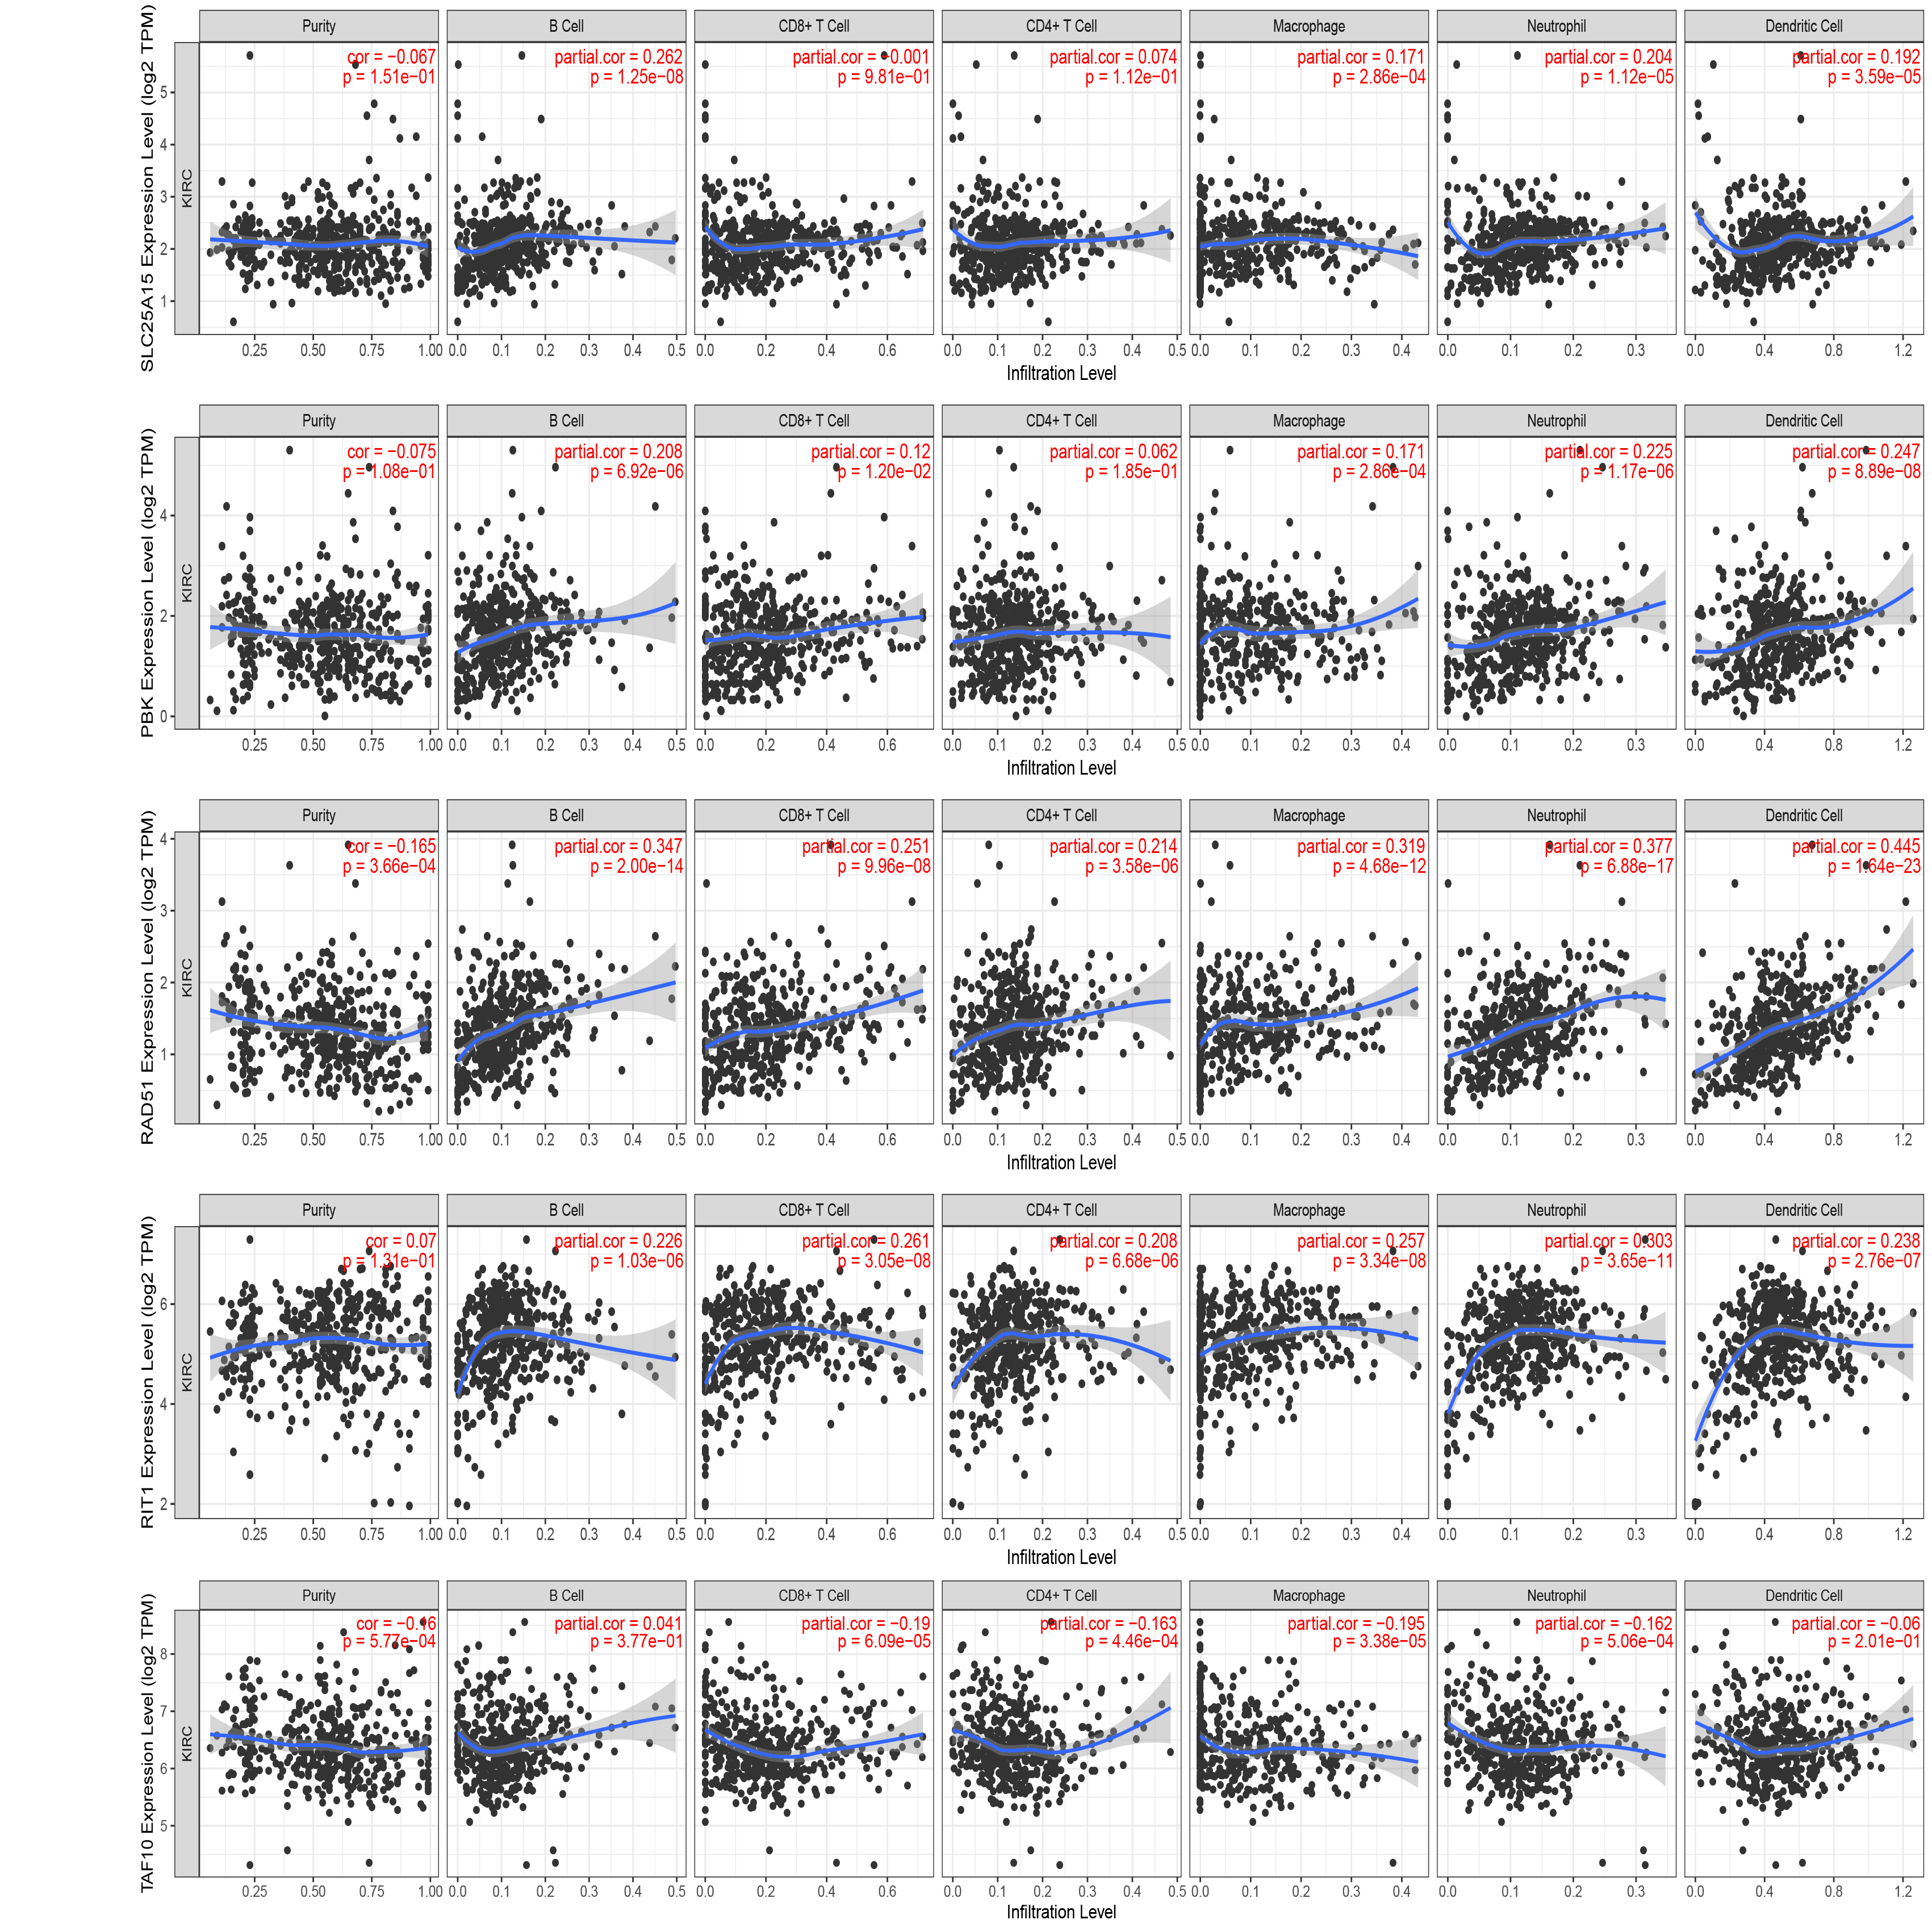
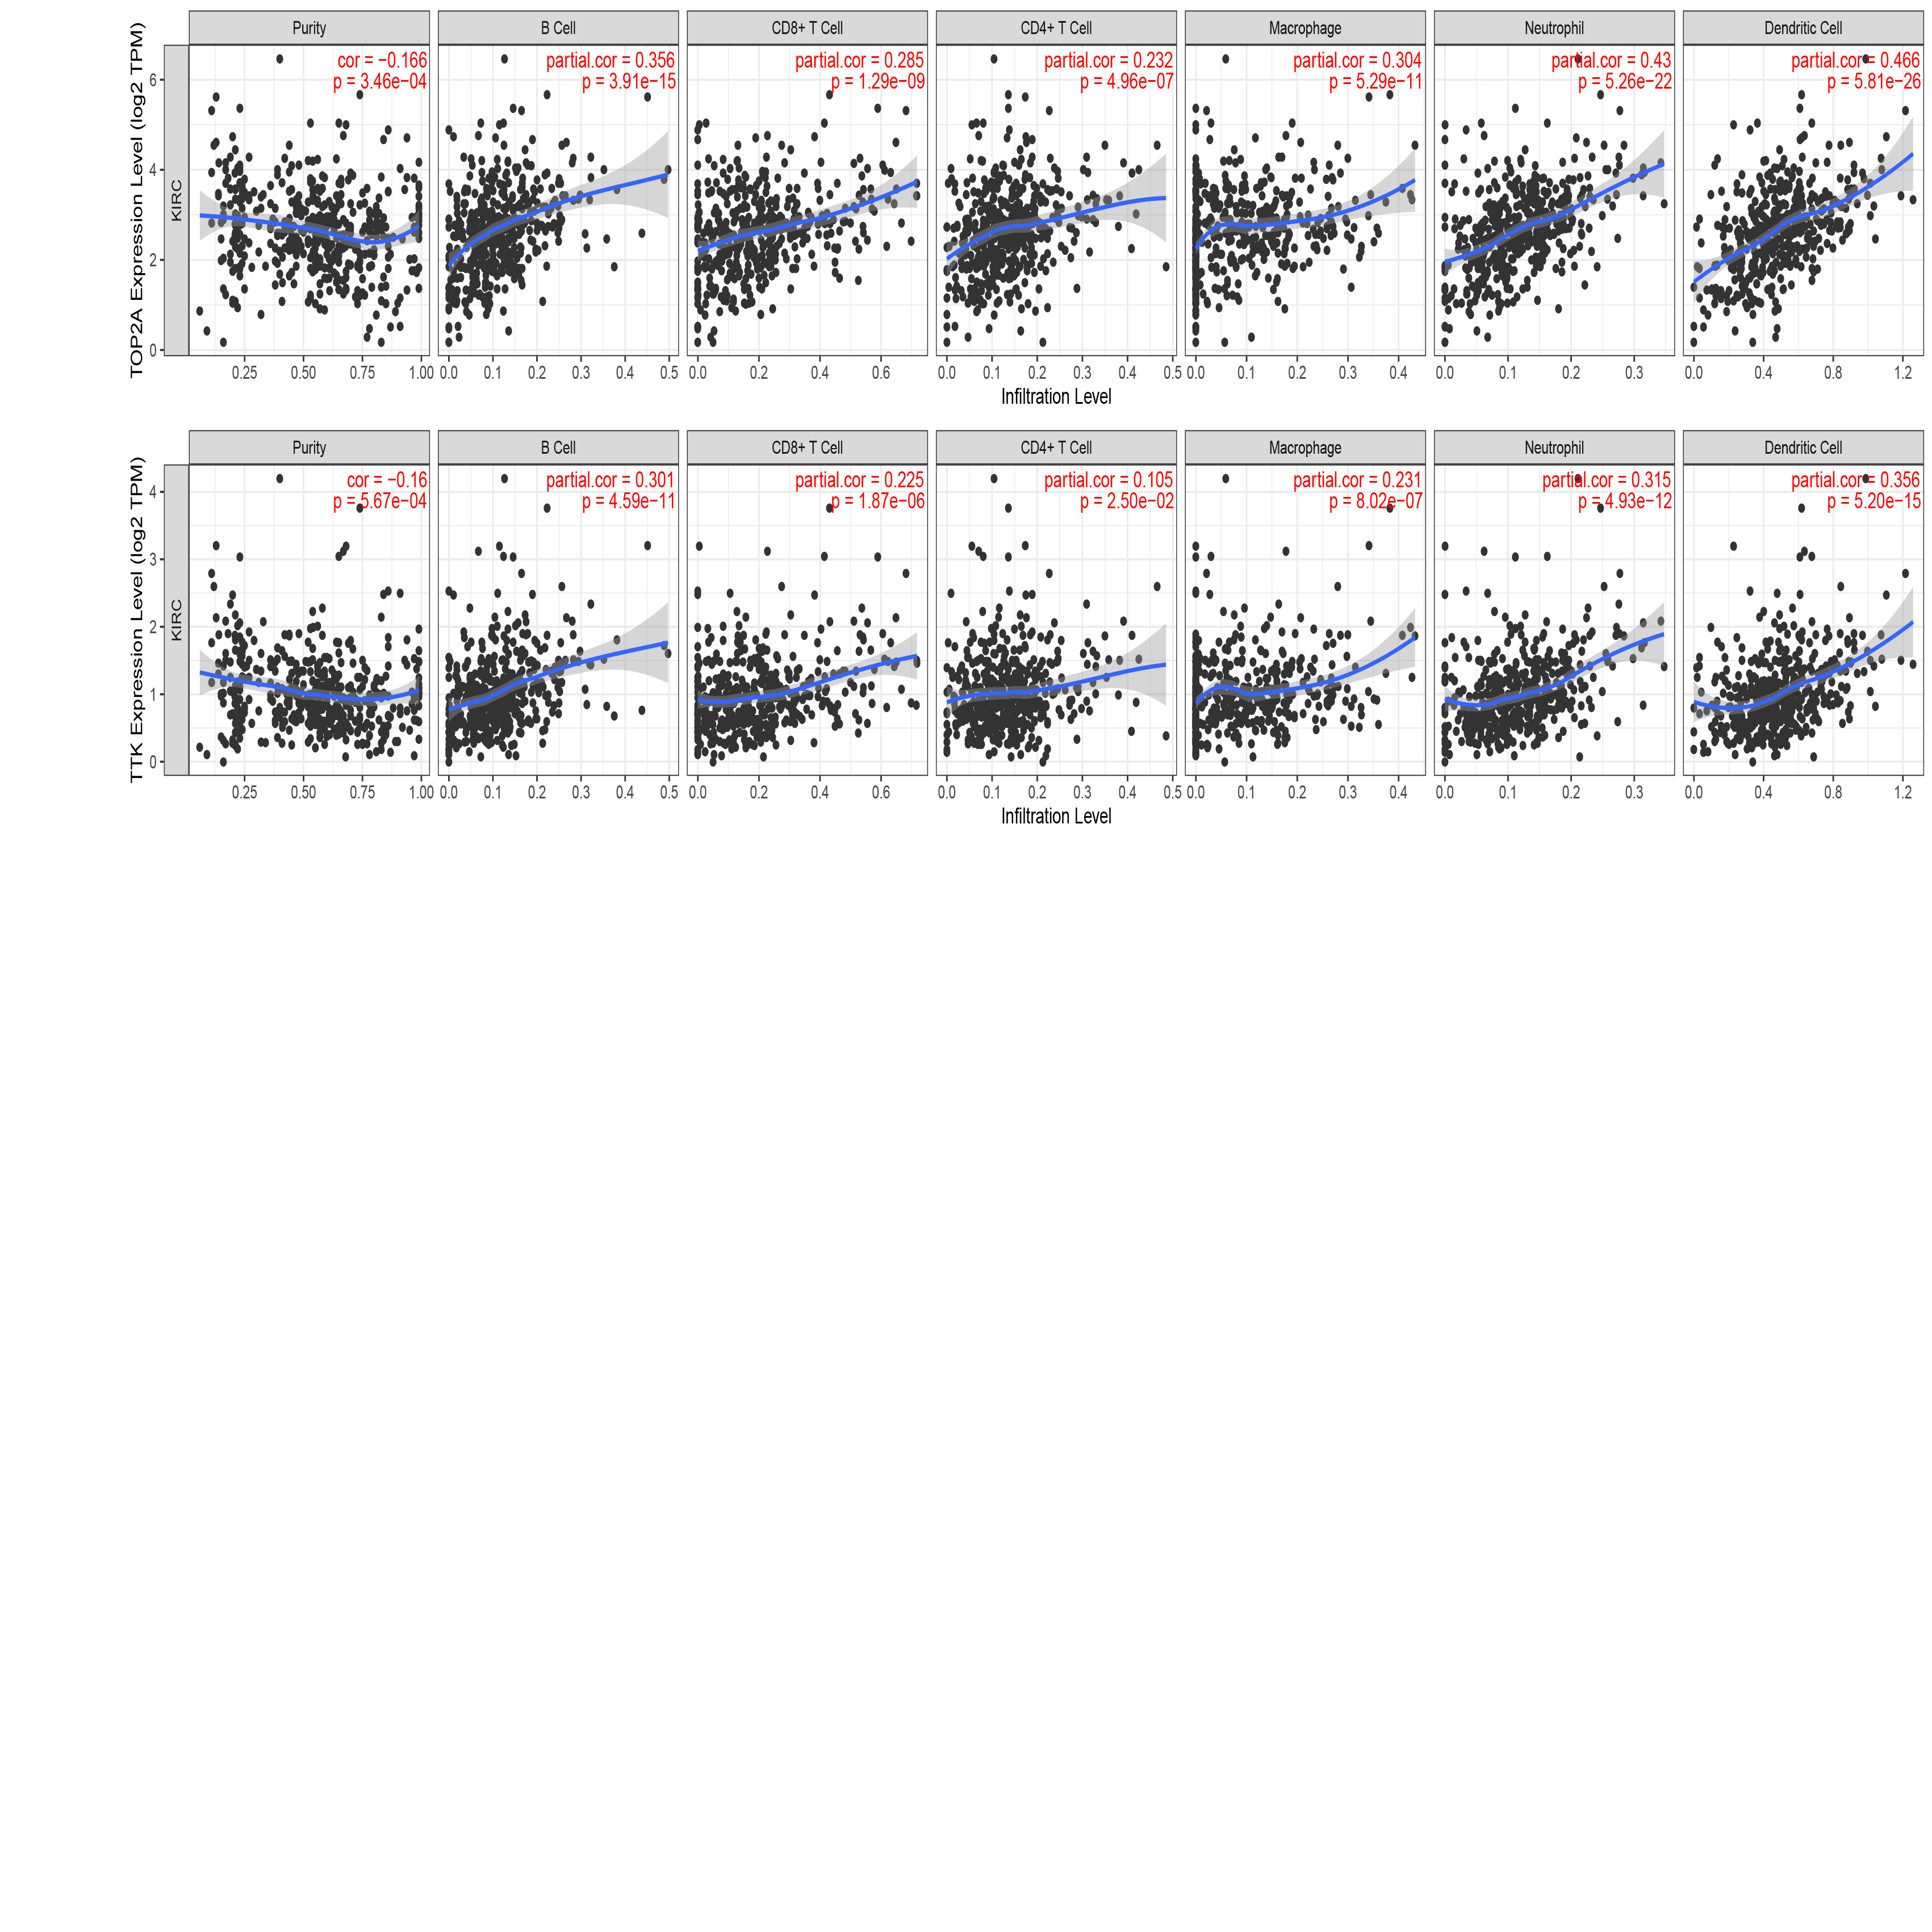
Analysis of immune infiltration level based on CRs model. The heat map(Figure 11) shows the analysis results of the high and low risk groups by the TIMER, CIBERSORT, CIBERSORT-ABS, XCELL, QUANTISEQ, EPIC and MCP-counter algorithms. Immune checkpoints are a class of immunosuppressive molecules. During the occurrence and development of tumors, immune checkpoints have become one of the main reasons for immune tolerance. To this end, we also investigated expression between different risk groups and immune checkpoints. The results showed that there were significant differences in the expressions of CD40, HAVCR2, LAG3, PDCD1LG2, TNFRSF18 and TNFRSF25 between the two groups of patients. In the high-risk group, the expression of tumor necrosis factor superfamily receptor/superfamily (TNFSF/TNFRSF) was high(Figure 12). Finally, we used the TIMER database to clarify the relationship between the 11 CRs that make up the prognostic model and immune cells. HJURP, NEK6, RAD51, RIT1, TOP2A, and TTK were positively correlated with immune cells such as B cells, CD8+ T cells, CD4+ T cells, macrophages, neutrophils, and dendritic cells. PBK was positively correlated with B cells, CD8+ T cells, macrophages, neutrophils, dendritic cells. ORC1(SLC25A15) is positively associated with immune cells such as B cells, macrophages, neutrophils, and dendritic cells. GLYATL1 positively correlated with B cells and CD8+ T cells. TAF10 negatively correlated with CD8+ T cells, CD4+ T cells, macrophages and neutrophils. KMT5C(SUV420H2) was positively correlated with CD4+ T cells, and negatively correlated with B cells and CD8+ T cells(Figure S1,S2,S3).
Drug Sensitivity Analysis of KIRC Patients. By analyzing the commonly used drugs in KIRC patients through the GDSC database, we found that drugs such as Axitinib, Pazopanib, Sorafenib and Gemcitabine have higher IC50 values in patients in the high-risk group than those in the low-risk group, indicating that the patients in the low-risk group are more sensitive to these drugs. However, the IC50 value of Sunitinib was lower than that of patients in the low-risk group, suggesting that patients in the high-risk group may be more sensitive to Sunitinib(Figure 13).