2.1 Research Area
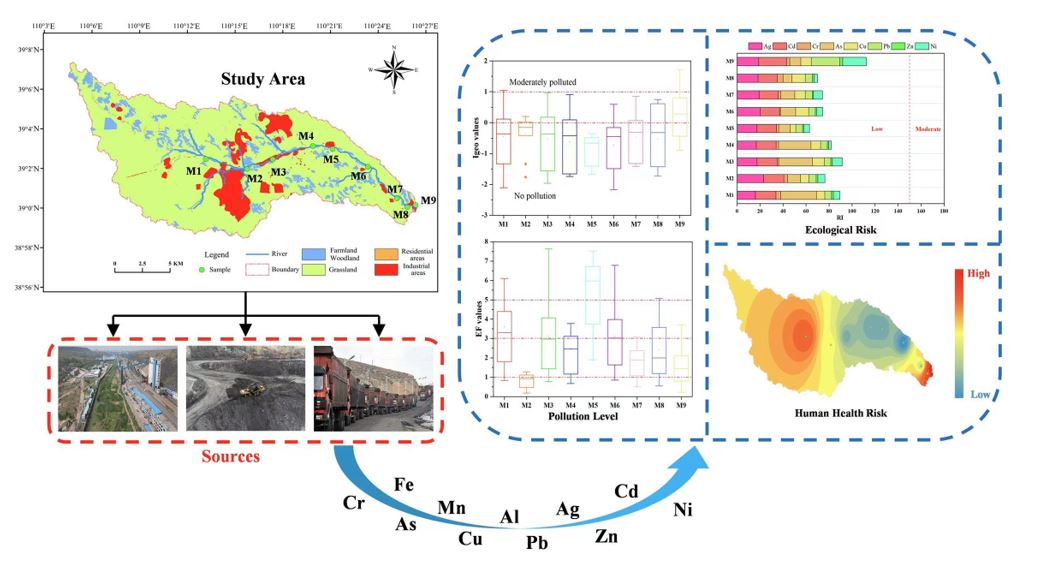
The research river is sited in the Kuye River Basin in the middle reaches of the Yellow River, the Kaokaowusu River, which is the secondary tributary of the Yellow River. its length is about 25.7 km in total, and the area is about 252.2 km2 (as shown in Fig. 1). The average annual temperature in this area is 8.9℃, the annual precipitation is 440.8 mm, and the soil is mainly aeolian and loess. Industrial land, residential land, grassland, agriculture, and forestry are the main land use types in this area. Ningtiaota Industrial Zone is located upstream of the river, which is based on coal mining to develop coal gas and coal tar. There are different industrial and mining enterprises, woodland, and a small part of farmland on both sides of the river. Downstream for the residential area of Dianta town, and distribution of power plants and a variety of mechanical repair enterprises.
2.2 Sampling and pretreatment
Due to the relatively representative biological activity and chemical properties of river surface sediments, the river surface sediments in this region are studied. In August 2021, 0–20 cm of sediment on the surface of the river was sampled. Five pieces of sediment were collected with clean shovels at four vertices and centers in a square area of 1 square meter, and they were fully mixed to pick up debris, leaves, and other debris. Subsequent measurements were averages of the five mixed sediments, which reduced the impact of environmental changes and ensured that the samples truly and accurately represented the channel. GPS was used to locate the sampling points, and a total of 9 sediment samples were collected for the river. The specific locations are shown in Table S1. The sediment was packed into polyethylene plastic bottles and transported to the laboratory for cryopreservation. All sediment samples were freeze-dried, ground using a crucible, and then sieved with a 50-mesh sieve, followed by the determination of metal ions.
Particles of a certain weight were put into a PTFE tube, and 5 mL of mixed acid (HNO3: HClO4 = 4:1) was added and then digested by an electric heating plate. The solution was filtered and transferred to a 50 mL volumetric flask with constant volume. The metal ions were determined by ICP-MS. Standard quality control and quality assurance were strictly maintained during pretreatment and measurement. The recovery of metal ions remained at 86.8%-102.6%. In addition, the method detection limits for Fe, Al, Mn, Ag, As, Cd, Cr, Cu, Ni, Pb, Zn were 0.82, 1.15, 0.12, 0.04, 0.12, 0.05,0.11, 0.08, 0.06, 0.09 and 0.67 µg /L, respectively.
2.3 Analysis method
2.3.1 Statistical analysis and spatial distribution of metal ions
In this study, SPSS (26.0) was selected for mathematical analysis of metal concentrations in river sediments; Geographic mapping of the study area was conducted using ArcGIS 10.5, and the spatial pattern of metal ions was predicted and plotted.
2.3.2 Source analysis
PCA is a statistical method that can reduce the dimensionality of the data space. Transform a set of potentially correlated variables into a set of linearly independent variables through orthogonal transformation (Bha et al., 2021), and obtain relatively little useful data to find out the relationship between various metal ions (Tian et al., 2020). It is generally believed that it is reliable to extract factors with eigenvalues greater than 1 through principal component analysis, and the cumulative variance of selected factors is more than 60 percent (Liu et al., 2020). It can provide quantitative information on relevant metal ions and analyze the possible sources of various metal ions. PCA has been widely used to study the sources of pollutants in rivers and sediments around the world (Loska and Wiechula, 2003; Peng et al., 2022). In this study, SPSS (26.0) was used for principal component analysis and the possible sources of metals were analyzed. The method is widely used to determine how land use and the surrounding environment affect metal content in riverbed sediments.
2.3.3 Pollution degree assessment method
1. Enrichment Factor (Ef)
EF is a resultful means to evaluate the degree of metal ion contamination caused by human factors in sediments. Based on previous studies, Fe was selected as a reference element (Kilunga et al., 2017). The specific calculation formula is as follows:
$$\begin{array}{c}EF=\frac{{\left({C}_{i}/{C}_{Fe}\right)}_{sample}}{{\left({C}_{i}/{C}_{Fe}\right)}_{background}}\#\left(1\right)\end{array}$$
Where, \({C}_{i}\)is the content of metal ions in the sample; \({C}_{Fe}\) is the background concentration of metallic iron ions in sediments. Enrichment factors are divided into seven levels, and the evaluation criteria are shown in Table S2.
2. Geo-accumulation Index (Igeo)
Igeo is a method to assess metal pollution and accumulation in sediments by eliminating the influence of geological factors, which has been widely used in the assessment of metal pollution in river sediments (Arisekar et al., 2022). The calculation method is as follows:
$$\begin{array}{c}Igeo={{log}}_{2}\left(\frac{{C}_{n}}{1.5{B}_{n}}\right)\#\left(2\right)\end{array}$$
Where, \({C}_{n}\) is the concentration of metal ions in the sample; \({B}_{n}\) is the background concentration of soil metal ions. 1.5 is the correction coefficient, which is used to eliminate the discrepancy in background concentration caused by different rock types. The geological accumulation index is divided into seven grades, and the evaluation criteria are shown in Table S2.
3. Pollution Load Index (Pli)
PLI was presented by Irish scientist Tomlinson based on a single-factor pollution coefficient and is commonly used to evaluate the comprehensive metal pollution level of sediments (Tomlinson et al., 1980). Use the following formula to calculate PLI.
$$\begin{array}{c}{C}_{f}^{i}=\frac{{C}_{i}}{{C}_{background}}\#\left(3\right)\end{array}$$
$$\begin{array}{c}PLI=\sqrt[n]{{C}_{f}^{1}\times {C}_{f}^{2}\times {C}_{f}^{3}\dots \times {C}_{f}^{n}}\#\left(4\right)\end{array}$$
Where, \({C}_{f}^{i}\) is the single factor pollution coefficient; The pollution load index is divided into five grades, and the evaluation criteria are demonstrated in Table S2.
2.3.4 Ecological risk and human health assessment
1. Potential Ecological Risk Index (Ri)
The potential ecological risk index was put forward by Swedish scientist Hakanson in 1980 (Hakanson, 1980). From the viewpoint of sediment, the comprehensive evaluation method of metal ion pollution in sediment and soil was carried out considering the toxicity of metal ions and environmental factors. This analysis result can be used not only to evaluate the comprehensive pollution degree of various metals but also to determine the ecological risk and biotoxicity, which is an effective means to evaluate the ecological environment harm caused by metal ions (Faisal et al., 2022; Wang et al., 2022). The calculation formula is as follows:
$$\begin{array}{c}{E}_{r}^{i}={T}_{r}^{i}\times {C}_{f}^{i}\#\left(5\right)\end{array}$$
$$\begin{array}{c}RI=\sum _{i=1}^{n}{E}_{r}^{i}\#\left(6\right)\end{array}$$
Where, \({C}_{f}^{i}\) is the single-factor pollution coefficient, the calculation method is shown in Formula (3). \({T}_{r}^{i}\) is the toxic response coefficient of metal ions, and the specific data are shown in Table S3. \({E}_{r}^{i}\) is the individual potential ecological risk index; RI is the sum of the potential ecological risk indices of all metal ions in sediment. The values of \({\text{C}}_{\text{f}}^{\text{i}}\), \({\text{E}}_{\text{r}}^{\text{i}}\), RI is shown in Table S4.
2. Sediment Quality Guidelines (Sqg)
Sediment quality Guideline (SQG) is an important method for assessing river water and sediment pollution (D. et al., 2000). It has been diffusely applied to soil and estuary sediment ecological risk assessment, water benthic protection, pollution prevention and control, and related water environmental function research (Min et al., 2015). In this study, SQG was used to decide the ecotoxicology of metal ions in benthic organisms and ecological environments. SQG is composed of the ERL and the ERM. When the metal content is lower than ERL, no or very few adverse biological effects will occur at the site. When the content is between ERL and ERM, it indicated occasional adverse biological effects. However, if the concentration is greater than ERM, adverse biological reactions often occur. The ERL and ERM for each metal are listed in Table 3 below.
3. Human Health Risk Assessment
The human health risk assessment model by the hazard quotient (HQ) and carcinogenic risk (CR), is used to assess the type of environmental pollutants that harm to human body and possibility, because of human behavior and physiological differences, this study will be divided into two types: adults and children crowd, use this method to understand the sediment of the possible relationship between metal ions and its harm to the human body (Fural et al., 2022; Koker, 2022). HQ and CR are calculated by the following formula:
$$\begin{array}{c}{ADD}_{ing}=\frac{C\times IngR\times EF\times ED}{BW\times AT}\times {10}^{-6}\#(7)\end{array}$$
$$\begin{array}{c}{ADD}_{inh}=\frac{C\times InhR\times EF\times ED}{PEF\times BW\times AT}\#(8)\end{array}$$
$$\begin{array}{c}{ADD}_{der}=\frac{C\times AF\times SA\times ABS\times EF\times ED}{BW\times AT}\times {10}^{-6}\#(9)\end{array}$$
$$\begin{array}{c}{HQ}_{ing/inh/der}=\frac{{ADD}_{ing/inh/der}}{{RfD}_{ing/inh/der}} \#(10)\end{array}$$
$$\begin{array}{c}HQ={HQ}_{ing}+{HQ}_{inh}+{HQ}_{der}\#(11)\end{array}$$
$$\begin{array}{c}{CR}_{inh/ing/der}={ADD}_{inh/ing/der}\times {SF}_{ing/inh/der}\#(12)\end{array}$$
$$\begin{array}{c}TCR={CR}_{ing}+{CR}_{inh}+{CR}_{der}\#(13)\end{array}$$
The meanings and values of each parameter in the formula are listed in Table S5. RfD and SF refer to the Manual of Exposure Factors published by THE USEPA, and the selected data are adjusted according to the habits of Chinese residents and the actual local situation. The specific data are shown in Table S6. When the HQ is less than 1, it indicates that the impact of metal ions on human beings is at a low level. When the HQ is greater than 1, it indicates that metal ions have a certain degree of non-carcinogenic risk to humans. For CR, when CR is less than 10− 6, there is no significant risk; When CR is between 10− 6 and 10− 4, cancer risk is acceptable, while when CR is greater than 10− 4, cancer risk is unacceptable.