A detailed protocol of the Image-seq procedure is available in the Supplementary information file.
Microscope
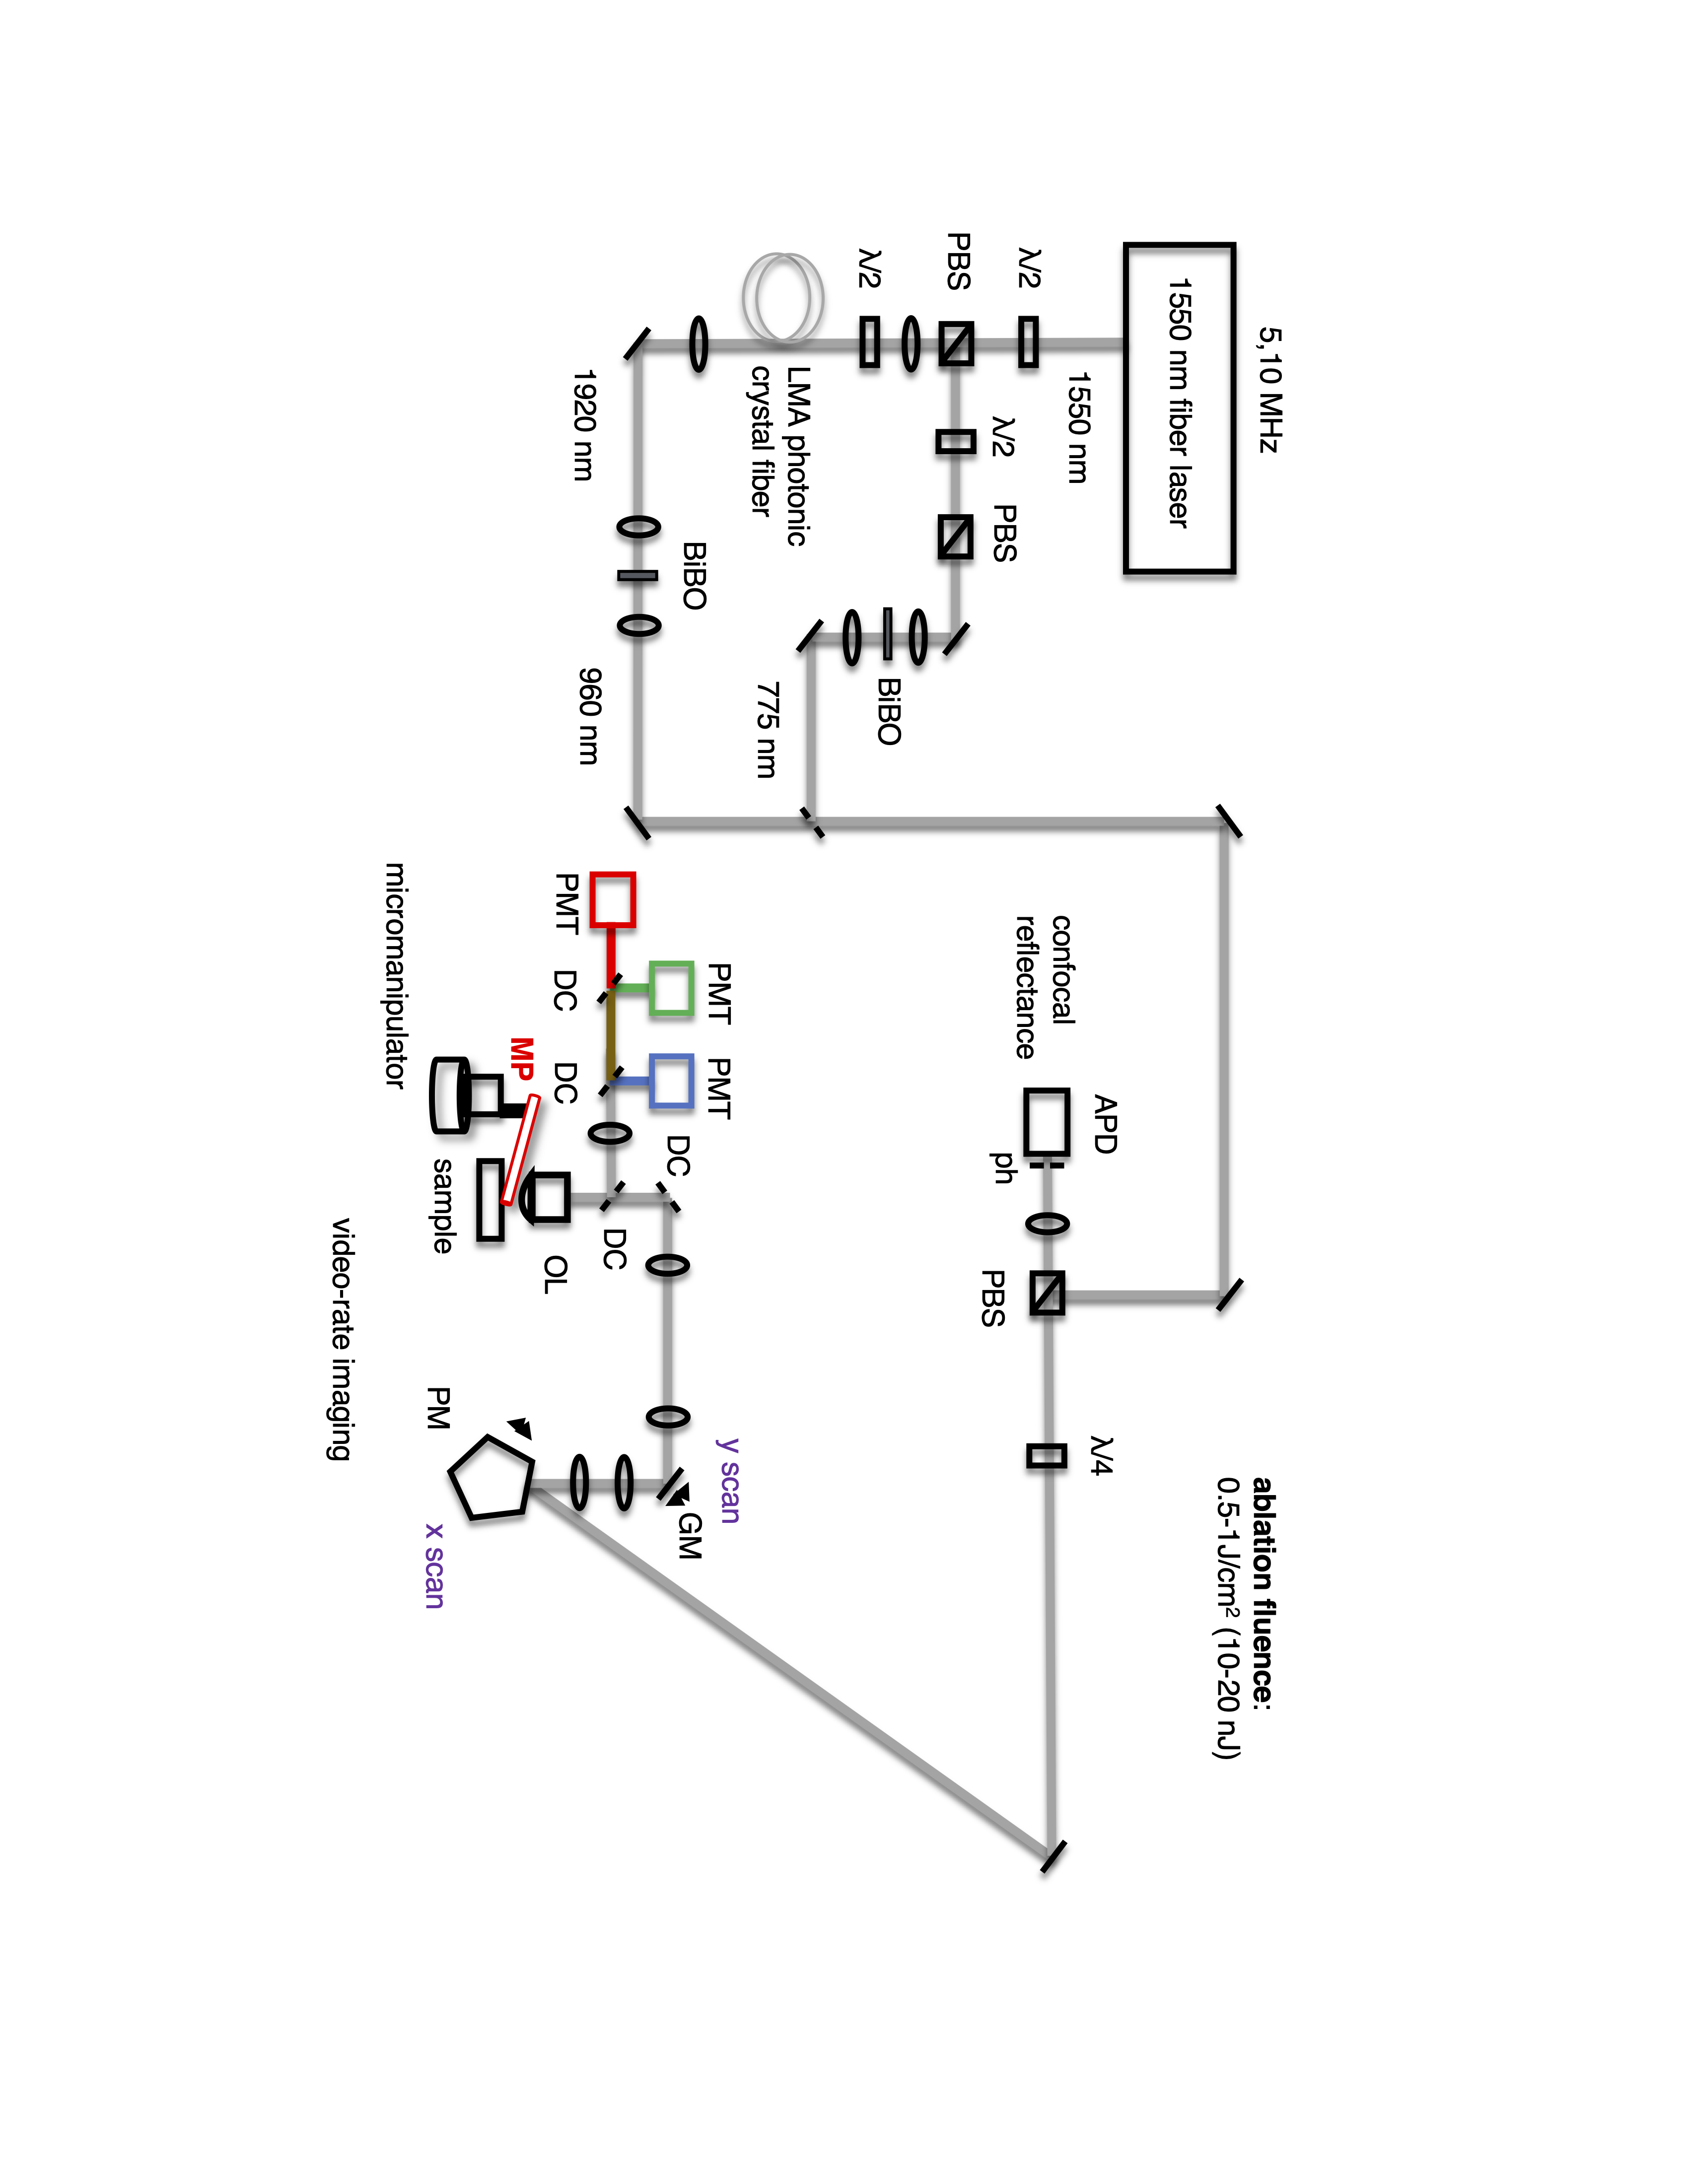
Intravital microscopy and plasma mediated laser ablation were performed using a custom-built multiphoton microscope. The output of a femtosecond, 1550nm fiber laser (Calmar Cazadero) operating at a repetition rate of 5 MHz was split into two optical paths: one was frequency doubled with a BiBO crystal (Newlight Photonics) to obtain a wavelength of 775nm that was used for either imaging or ablation (see Extended Data Figure 1). The other was coupled into a large mode-area photonic crystal fiber (LMA-35, NKT Photonics) where, by soliton self-frequency shift, radiation with a frequency tunable between 1880nm and 1960nm was generated. This was frequency doubled (BiBO, Newlight Photonics) to obtain imaging wavelengths between 940-980nm. The imaging and ablation beams were spatially overlapped using a dichroic mirror (Zt 785 RDC, Chroma), and directed to the scanning optics, which consisted of a revolving polygon (36-facets, 14,400 rpm, x scan) conjugated to a scanning galvo mirror (15 Hz, y scan), and which were conjugated to the back aperture of the objective lens (Olympus, 60x, NA=1.0, water immersion). This served to steer the imaging/ablation beams across the microscope field of view. Typical pulse energies used for imaging were between 1-2 nJ and typical pulse energies for ablation were between 10-15 nJ. For stable plasma generation, a continuous stream of phosphate-buffered saline (PBS, ThermoFisher Scientific) was flushed across the sample at a rate of 10ml/min, removing any gas and debris generated during the ablation procedure. The sample (mouse) was positioned in the image plane using a micromanipulator (Sutter instruments) and translated along the z-dimension to image/ablate a 3D volume of tissue. Fluorescence signals were collected after excitation with 775nm or 980nm laser light, using 3 photomultiplier tubes (PMTs). The typical configuration of dichroic mirrors was FF705 LP, FF495 LP and FF552 LP, with filters 439/154 (blue PMT R7600-U300, Hamamatsu) for the detection of collagen second-harmonic generation signal from bone, 525/50 (green PMT R7600-U300, Hamamatsu) for the detection of AML cells/Tetracycline and 607/70 (red PMT R7600-U20, Hamamatsu) for the detection of Cell tracker Red/Di8-Anepps signals. An avalanche photodiode was also installed for collection of confocal reflectance signal (used to visualize the in vivo cell isolation procedure in Online Video 1).
Procedure for Intravital imaging
The procedure for intravital imaging of the calvarium bone marrow is described in detail elsewhere61. Prior to intravital microscopy and ablation, analgesics were administered (buprenorphine at 0.05-0.1 mg/kg IP), mice were anesthetized using vaporized isoflurane (3-4% induction, 1-2% maintenance) and depth of anesthesia ensured by toe pinch. Hair around the incision site on the scalp was trimmed, and skin made aseptic using a betadine scrub. The incision (~ 5 mm x 7 mm) was made using sterile surgical scissors, and the skin folded back to expose the skull bone, which was hydrated using sterile PBS. Mice were transferred to a mouse holder with integrated heating pad (37°C), and a continuous stream of isoflurane supplied via a nose cone during in vivo imaging/ablation. Intravital microscopy experiments were carried out using the microscope and dichroic/filter configuration detailed above, and image stacks were acquired with a 2-μm step size from the calvaria surface and by averaging 15 frames to obtain a single image. At the end of each imaging session, mice were either sacrificed, or survival surgery performed. For survival, the exposed skull was extensively irrigated with sterile saline and the scalp closed with surgical sutures (Ethicon 6-0 nylon monofilament, Ethicon). 0.25% Bupivacaine (2mg/kg) mouse was infiltrated into the surgical site after closure to aid with pain management and triple antibiotic ointment (Curad) applied on the sutured area. The animal was returned to its cage and monitored until awake. Buprenorphine (0.05-0.1mg/kg animal weight) was administered IP or SQ along with topical antibiotic ointment every 8-12 hours for up to two days after surgery.
In vivo cell aspiration
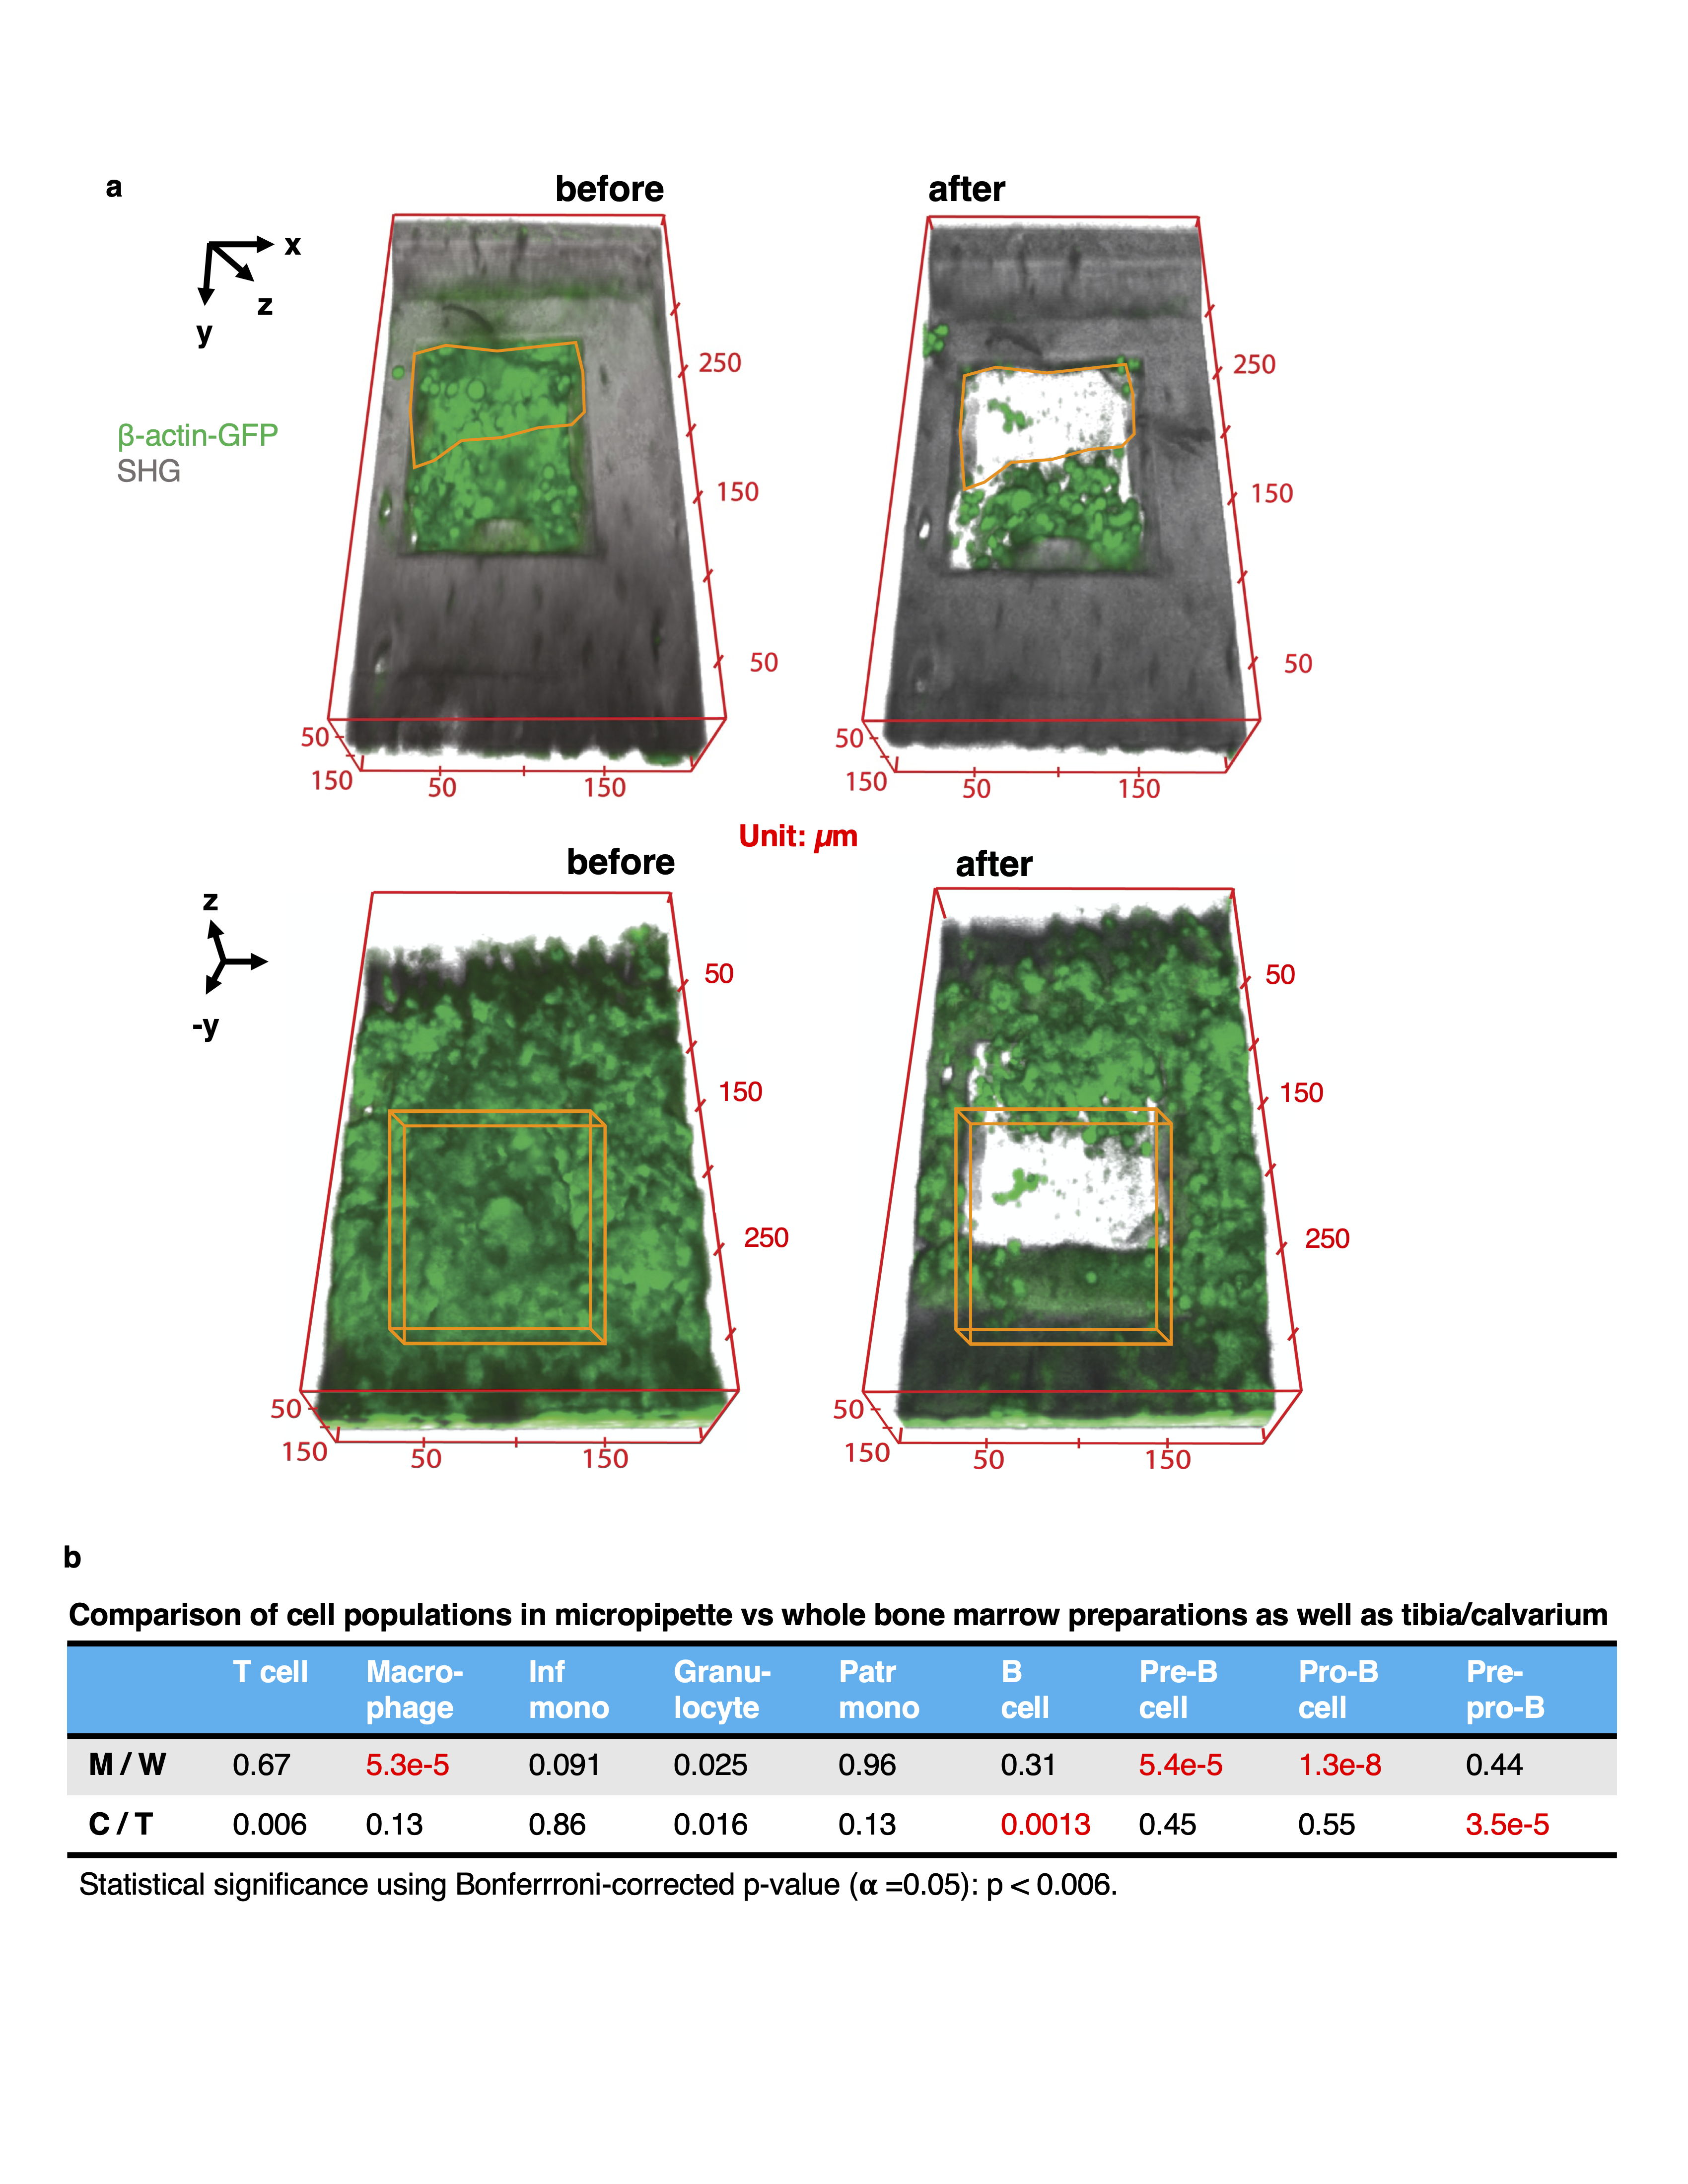
The site for cell extraction was identified by intravital imaging of the calvarium bone marrow (procedure detailed above). A ~40 µm x 200 µm x 300 µm volume of bone was removed using laser ablation (pulse energy 14 nJ). A circular channel was etched (diameter ~ 100 µm, depth 20-30 µm, pulse energy 10 nJ) by placing an iris in the intermediate image plane, and a micropipette (MPB-FP-20, Origio) inserted through the channel and into the bone marrow using a micromanipulator (Sutter Instruments). The target cell was aspirated by suction with an Air Syringe (Cooper Surgical) and the procedure visualized using a combination of multiphoton and confocal reflectance signals. The ablation procedure itself was performed at a rate of 0.25 µm/670 ms along the z dimension, which corresponded to 10 passes per plane using the 15 frame per second imaging rate of the optical system.
Image-guided cell isolation for flow cytometry and sequencing
In vivo imaging of calvarium
Prior to cell isolation, mice were subjected to intravital imaging, sites for cell extraction were identified, and their spatial position recorded with respect to Bregma and Lambda. Mice were retro-orbitally injected with either Di8-ANEPPS (1.9 mg/kg) or Brilliant Violet 421 anti-mouse CD31 antibody (1 mg/kg, BioLegend) to aid in the visualization of the cell isolation procedure. Anesthesia was increased to 4%, mice were transferred to a dissection tray and were transcardially perfused:
- For the isolation of hematopoietic cells: First with an ice-cold solution of 5µM EDTA in PBS (ThermoFisher Scientific, flow rate 5 ml/min, total volume 10 ml) and then with ice-cold PBS (ThermoFisher Scientific, no Ca/Mg, flow rate 5 ml/min, total volume 10 ml).
- For the isolation of stromal cells: First with a 37°C solution of 5µM EDTA in PBS (both ThermoFisher Scientific) at a flow rate of 5 ml/min and with a total volume of 10 ml, and then with an enzymatic digestion buffer at 37°C (flow rate 5ml/min, total volume 10 ml). The mice were then incubated at 37°C for 20 min. The enzymatic digestion buffer consisted of 450 U/mL Collagenase I (Sigma), 125 U/ml Collagenase XI (Sigma), 60 U/ml Hyaluronidase (Sigma), 60 U/ml DNase I (Sigma) in 20 ml of Medium-199 (Gibco).
Mice were transferred back to the microscope and samples were sequentially isolated from positions marked for cell extraction.
In situ imaging of tibia
Mice were perfused first with an ice-cold solution of 5µM EDTA in PBS (ThermoFisher Scientific, flow rate 5 ml/min, total volume 10 ml) and then with ice-cold PBS (ThermoFisher Scientific, no Ca/Mg, flow rate 5 ml/min, total volume 10 ml). Tibia were then dissected and cleaned, and the tibial bone was thinned to a thickness of ~50µm using a razor blade. Bones were mounted onto a microscope slide by fastening a piece of modeling clay to the glass slide and gently pressing the bone onto the modelling clay. The mounted bone was then transferred to the microscope for in situ imaging.
Image-guided cell aspiration (calvarium and tibia)
In each location, the procedure was as follows: (i) A ~40 µm x 200 µm x 300 µm volume of bone was removed using a pulse energy of 14 nJ, (ii) a channel with dimensions ~ 30 µm x 50 µm x 100 µm was created using a pulse energy of 10 nJ, (iii) the micropipette was inserted through this channel and positioned next to the target cells, (iv) cells were aspirated using a micropipette (MBB-FP-M-20, Origio) and transferred to an Eppendorf tube filled with 5 µL of Medium-199 with 2% v/v FBS. Samples were kept on ice until they were either analyzed by flow cytometry (validation experiments), transferred to the 10x Chromium platform, or sorted into individual wells of a 96-well plate by flow cytometry (for library preparation by SMARTseq-v4). The ablation procedure itself was performed at a rate of 0.25 µm/670 ms along the z dimension, which corresponded to 10 passes per plane using the 15 frame per second imaging rate of the optical system.
Prior to the experiment, micropipettes were coated with Sigmacote (flowed through the micropipette for 2 min at a rate of 200 µL/min) to prevent cells from adhering to the glass surface, as well as with Qtracker 655 vascular labels (5 µl were pipetted up and down several times) to fluorescently coat the pipette, which aided with its visualization.
Harvest of whole bone marrow (WBM) preparations
Calvaria were dissected and cut into smaller pieces. Tibia were dissected and cleaned. To aid in the release of the bone marrow, calvaria bone fragments or whole tibia bones were gently crushed in Medium 199 (Gibco) supplemented with 2% fetal bovine serum (FBS) (Gibco). The resulting cell suspension was subsequently passed over a 70mm cell strainer (BD Falcon).
Cell Lines
Syngeneic Leukemia Model
The HoxA9/Meis1 and MLL-AF9 models have been described in detail elsewhere62,63. Briefly, the HoxA9/Meis1 AML cell line was generated by retroviral transduction with an MSCV-HoxA9-IRES-Meis1 construct (originally designed by Dr. Guy Sauvageau) into bone marrow mononuclear cells from a mouse expressing GFP under the control of the ubiquitin, and luciferase under the control of the b-actin promoter. The MLL-AF9 cell line used for the cell-cycle experiments was generated by harvesting bone marrow from a 5-Fluorouracil-treated Cas9-GFP mouse, followed by 2 consecutive transfections with retroviral MLL-AF9. For both models, cells were transplanted into irradiated recipients, harvested from terminally ill animals, and re-transplanted into a second set of irradiated recipients, from which GFP-expressing cells were harvested close to disease endpoint. These cells were cultured in RPMI 1640 (Gibco) supplemented with 10% fetal bovine serum (FBS, Thermofisher Scientific), 100 I.U./ml penicillin (Corning), 100 mg/ml streptomycin (Corning), 5 ng/ml interleukin 3 (Peprotech), as well as 100 ng/ml stem cell factor (SCF, Peprotech) for the HoxA9/Meis1, and 20 ng/ml SCF and 10 ng/ml interleukin 6 (IL-6, both from Peprotech) for the MLL-AF9. Recipient female mice (10-12 weeks old) were injected with 3,000,000 cells in 200µl of PBS (HoxA9/Meis1) and 1,000,000 cells in 200µl PBS (MLL-AF9).
The MLL-AF9 model used for the experiments in Figure 3 was generated by crossing MLL-AF9 knock-in mice64 with mice expressing GFP under the control of the ubiquitin, and luciferase under the control of the b-actin promoter. The bone marrow from a terminally ill male mouse was harvested and cultured in vitro using RPMI1640 (Gibco) supplemented with 10% FBS (Gibco), 100 I.U./ml penicillin, 100 mg/ml streptomycin (both from Corning), 20 ng/ml recombinant mouse SCF (rmSCF), 10 ng/ml recombinant mouse interleukin 3 (rmIL-3) and 10 ng/ml rmIL-6 (all from R&D Systems). Recipient male mice (8-10 weeks old) were injected with 1,000,000 cells in 100 µl saline.
For transplantation of DPP4- and DPP4+ HoxA9/Meis1 leukemia, cells were isolated from long bones and vertebral column 3 weeks post-transplantation. The marrow was subjected to density gradient centrifugation (Ficoll-Paque Plus, Cytiva Life Sciences) at 400g for 25 minutes at room temperature with no brakes. The mononuclear layer was isolated and subsequently blocked in PBS with 2% FBS and murine Fc-block (BD Biosciences, dilution 1 to 50). Following this, the samples were stained with CD45-APC/Cy7 (BD Biosciences, dilution 1 to 100) and DPP4-PE (Biolegend, dilution 1 to 20). To exclude dead cells, samples were incubated with 7-Aminoactinmycin D (7AAD, 0.25µg, BD Biosciences) and 7AAD- GFP+ CD45+ DPP4- and 7AAD- GFP+ CD45+ DPP4+ cells were sorted into separate tubes. 1000 cells of each phenotype were injected into 10-12 weeks old recipient mice. Leukemia burden and DPP4 expression were assessed 10 days post-transplantation.
SV40 immortalized bone marrow stroma
Total bone marrow cells were isolated from the femurs and tibias of B6J.129(B6N)-Gt(ROSA)26Sortm1(CAG-cas9*,-EGFP)Fezh/J mice (Jackson Laboratories). The bones were crushed in PBS (ThermoFisher) with 2% FBS (Gibco) and the released marrow was filtered over a 40mm strainer. Mononuclear cells were collected by density gradient centrifugation (Ficoll-Paque Plus, Cytiva Life Sciences). 20 million mononuclear cells were put into culture with Alpha-MEM (Gibco) supplemented with 20% FBS (Gibco) and 1% P/S (Gibco) in 150 mm dishes. Non-adherent cells were discarded around day 5 and the media changed every 5-7 days for approximately 3 weeks. At this point, colonies of large adherent fibroblasts were apparent. The cells were detached from the dishes with Trypsin-EDTA (Gibco), counted, and 50,000 cells seeded into two wells of a 6-well plate. The following day, one well of cells was transduced with lentivirus in the presence of 8 mg/ml polybrene (MilliporeSigma) to deliver the SV40 small and large T-antigen. The plasmid pLenti CMV/TO SV40 small + Large T (w612-1) was a gift from Eric Campeau (Addgene plasmid # 22298 ; http://n2t.net/addgene:22298 ; RRID:Addgene_22298). Despite the lack of a selectable marker, the transduced cells divided much more rapidly than the non-transduced primary stroma, and over the course of 2-3 passages, established an SV40-immortalized stromal cell line.
Isolation and in vitro stimulation of T cells
Spleens were collected from C57Bl/6J mice and a single cell suspension was obtained by mechanical dissociation of the tissue over a 70mm cell strainer (BD Falcon) in RPMI-1640 (ThermoFisher) supplemented with 10% FBS (Gibco) and 1% Penicillin/Streptomycin (Gibco). Red cells were lysed using ACK Lysing Buffer (Quality Biological) followed by removal of non-T cell splenocytes through magnetic depletion. Briefly the cell suspension was adjusted to 108 cells/ml and incubated with biotinylated antibodies directed against B220, CD19, Ter119, NK1.1, Cd11b and Gr1 (all from Biolegend, dilution of 1 to 100, see Table S6) at a concentration of 5mg/ml for 10 minutes at room temperature on an orbital shaker. This was followed by addition of 25ml/ml of streptavidin-conjugated Rapidspheres (Stem Cell Technologies) and an additional 5 minutes of incubation at room temperature on an orbital shaker. The samples were placed in an EasySep magnet (Stem Cell Technologies) for 5 minutes and the purified T cells were subsequently decanted into a fresh tube. Purity of the isolated T cells was confirmed to be >95% by FACS analysis. In order to induce T cell proliferation, the isolated splenic T cells were plated with T cell activator Dynabeads CD3/CD28 (ThermoFisher) in a 1:1 ratio in leukemia cell line medium: RPMI 1640 (Gibco) supplemented with 10% fetal bovine serum (FBS, Gibco), 100 I.U./ml penicillin (Gibco), 100 mg/ml streptomycin (Gibco), 5 ng/ml interleukin 3 (Peprotech), as well as 100 ng/ml stem cell factor (SCF, Peprotech).
Flow cytometry
Flow cytometry analysis of WBM and micropipette
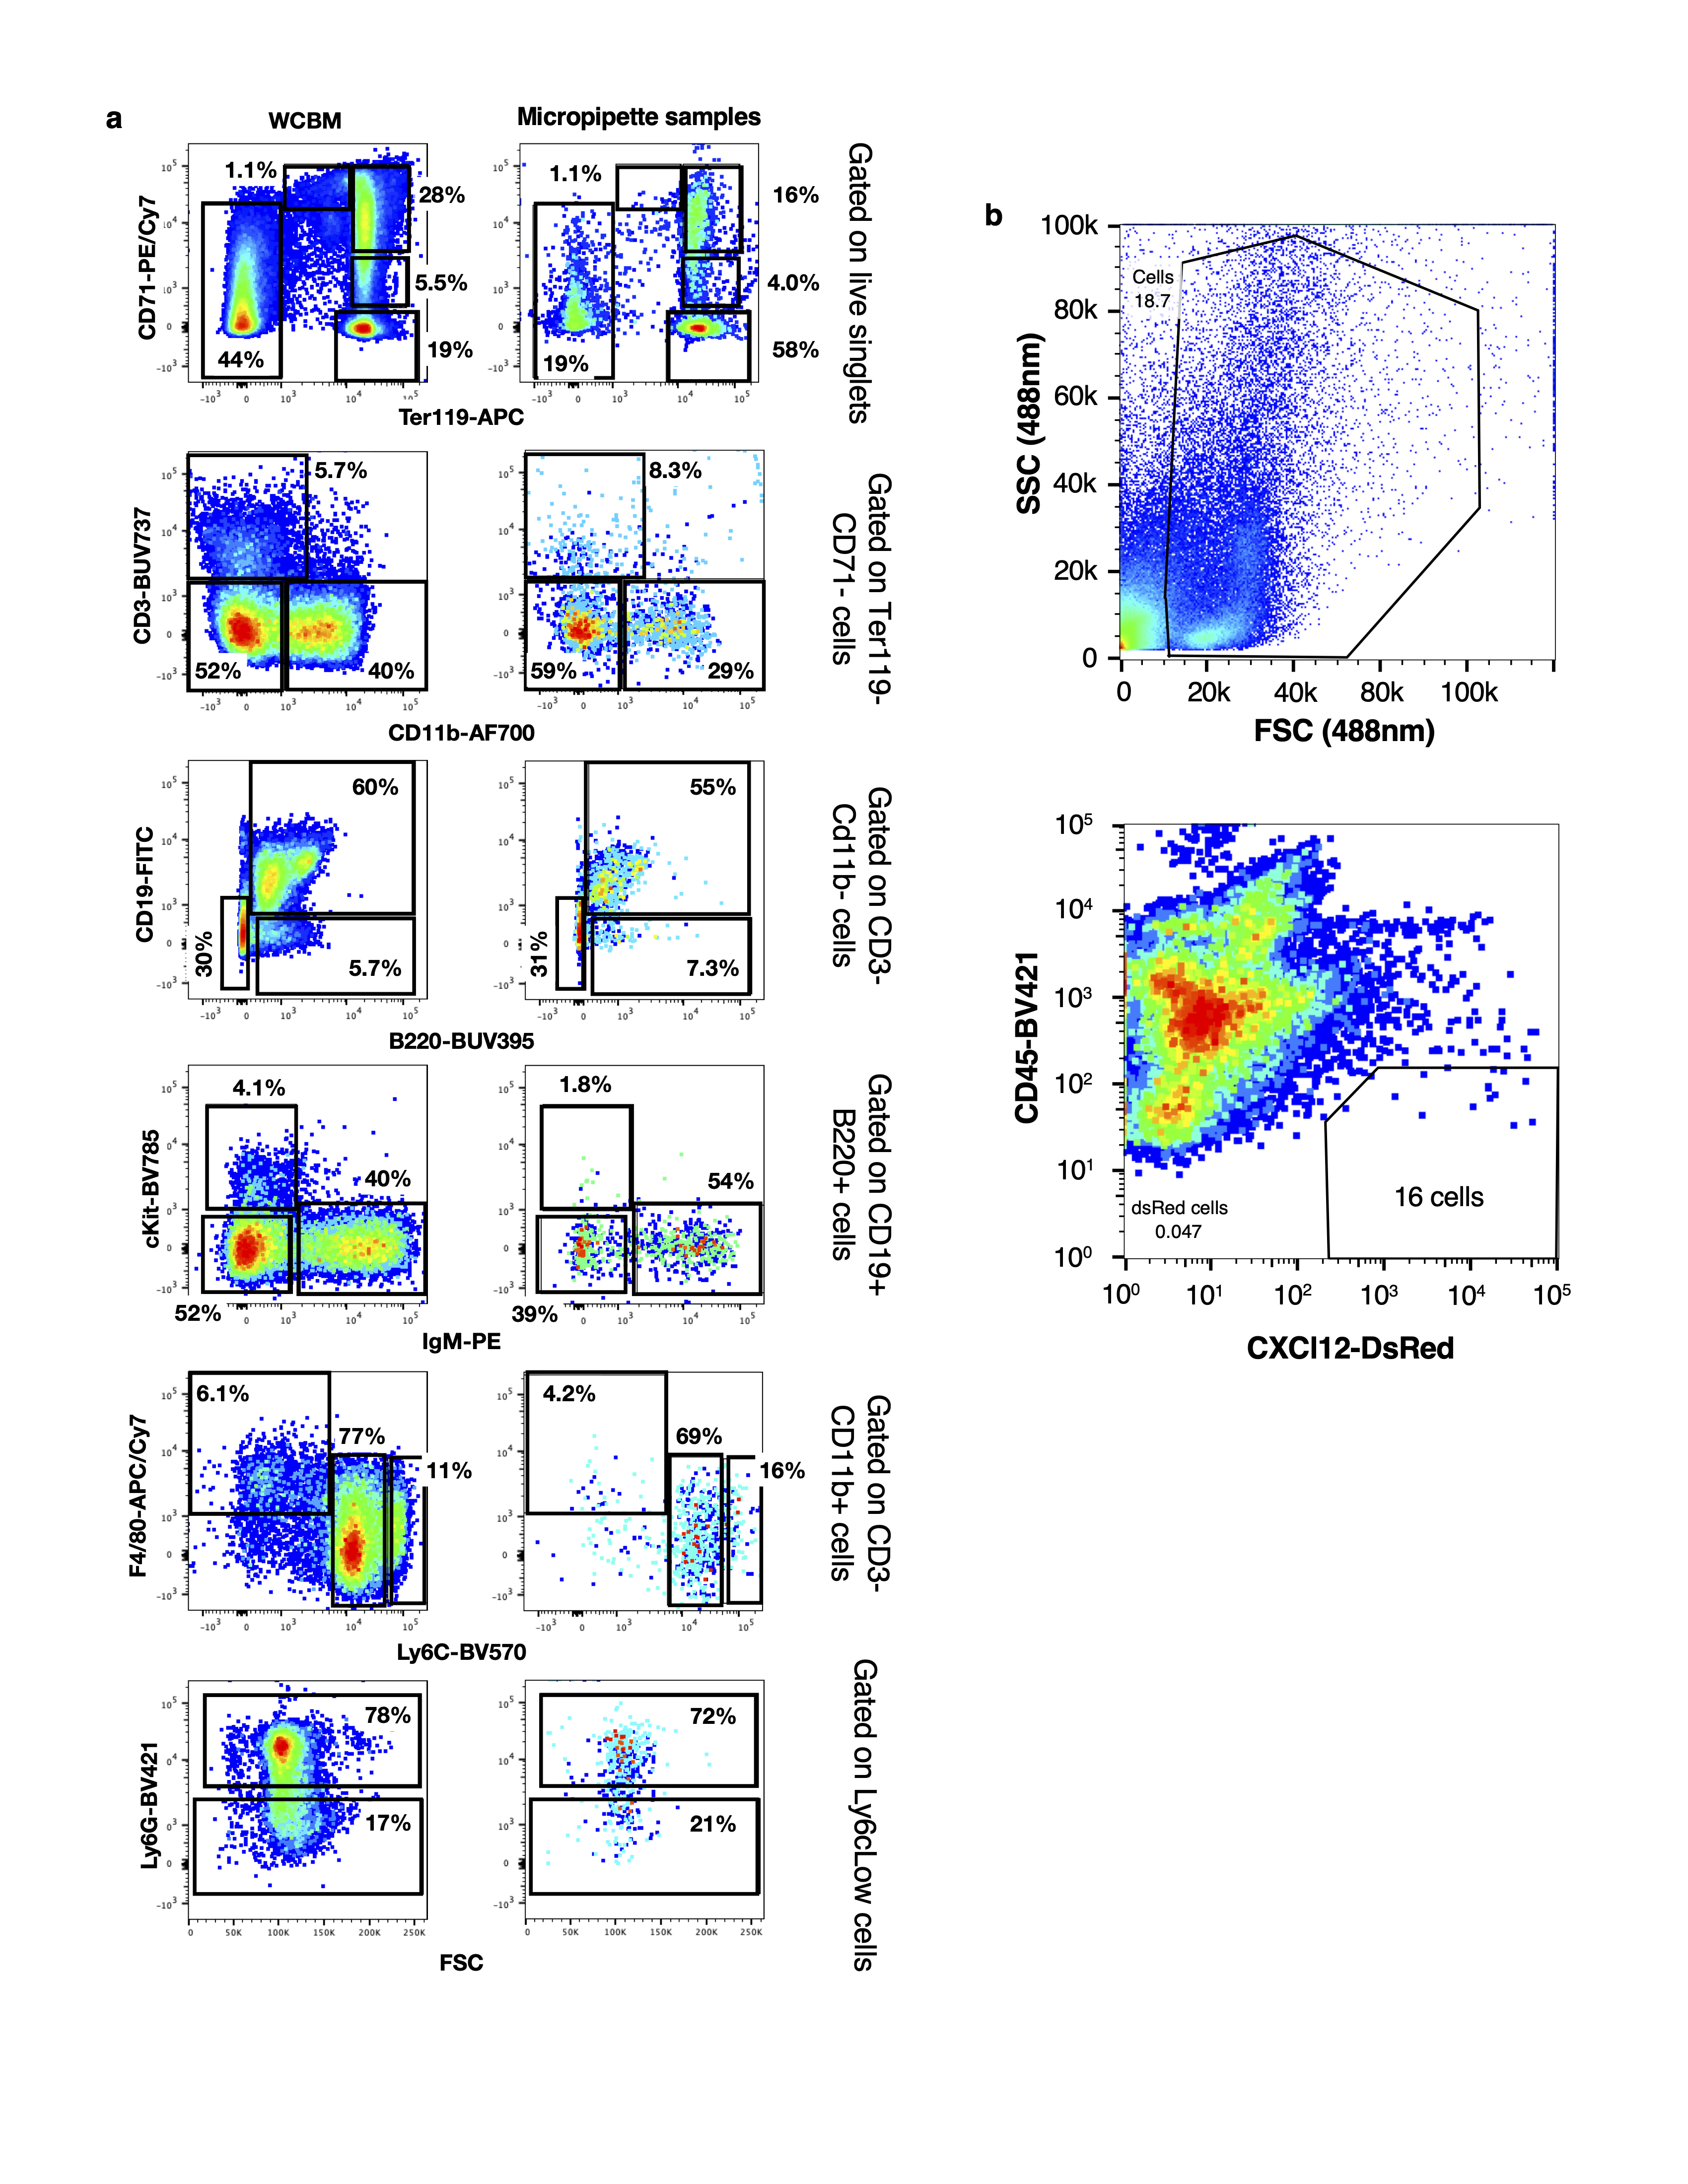
WBM and micropipette samples from calvarium and tibia were blocked with anti-mouse Fc block (BD Biosciences, dilution 1 to 50) for 10 minutes at 4°C. The cells were thereafter stained with Blood cell lineage cocktail (Table S6) for 30 minutes at 4°C. For detection of dead cells 7AAD (BD Biosciences, 0.25µg) was added to the sample prior to analysis. Flow cytometric analysis was performed on a BD FACS Aria III sorter (BD Biosciences) and all data was analyzed using FlowJo software package (Treestar).
Flow sorting of AML cells for SMARTseq-v4
Prior to sorting, 1ml of PBS (ThermoFisher Scientific) was added to each sample tube, along with 0.1µg of DAPI (ThermoFisher Scientific). The sample was incubated for 10 min, gently vortexed and transferred to the flow cytometer (MoFlo Astrios EQ cell sorter). Single, live, GFP+ AML cells (see Figure S1 for examples of gating strategy) were sorted into individual wells of a 96-well PCR plate filled with 2.6µl of Lysis Buffer (Takara Bio USA, Inc.). Plates were sealed, spun down, snap-frozen and stored at -80°C prior to preparation for cDNA synthesis using the SMARTseq-v4 assay.
Flow analysis and sorting of CXCl12+ stromal cells for SMARTseq-v4
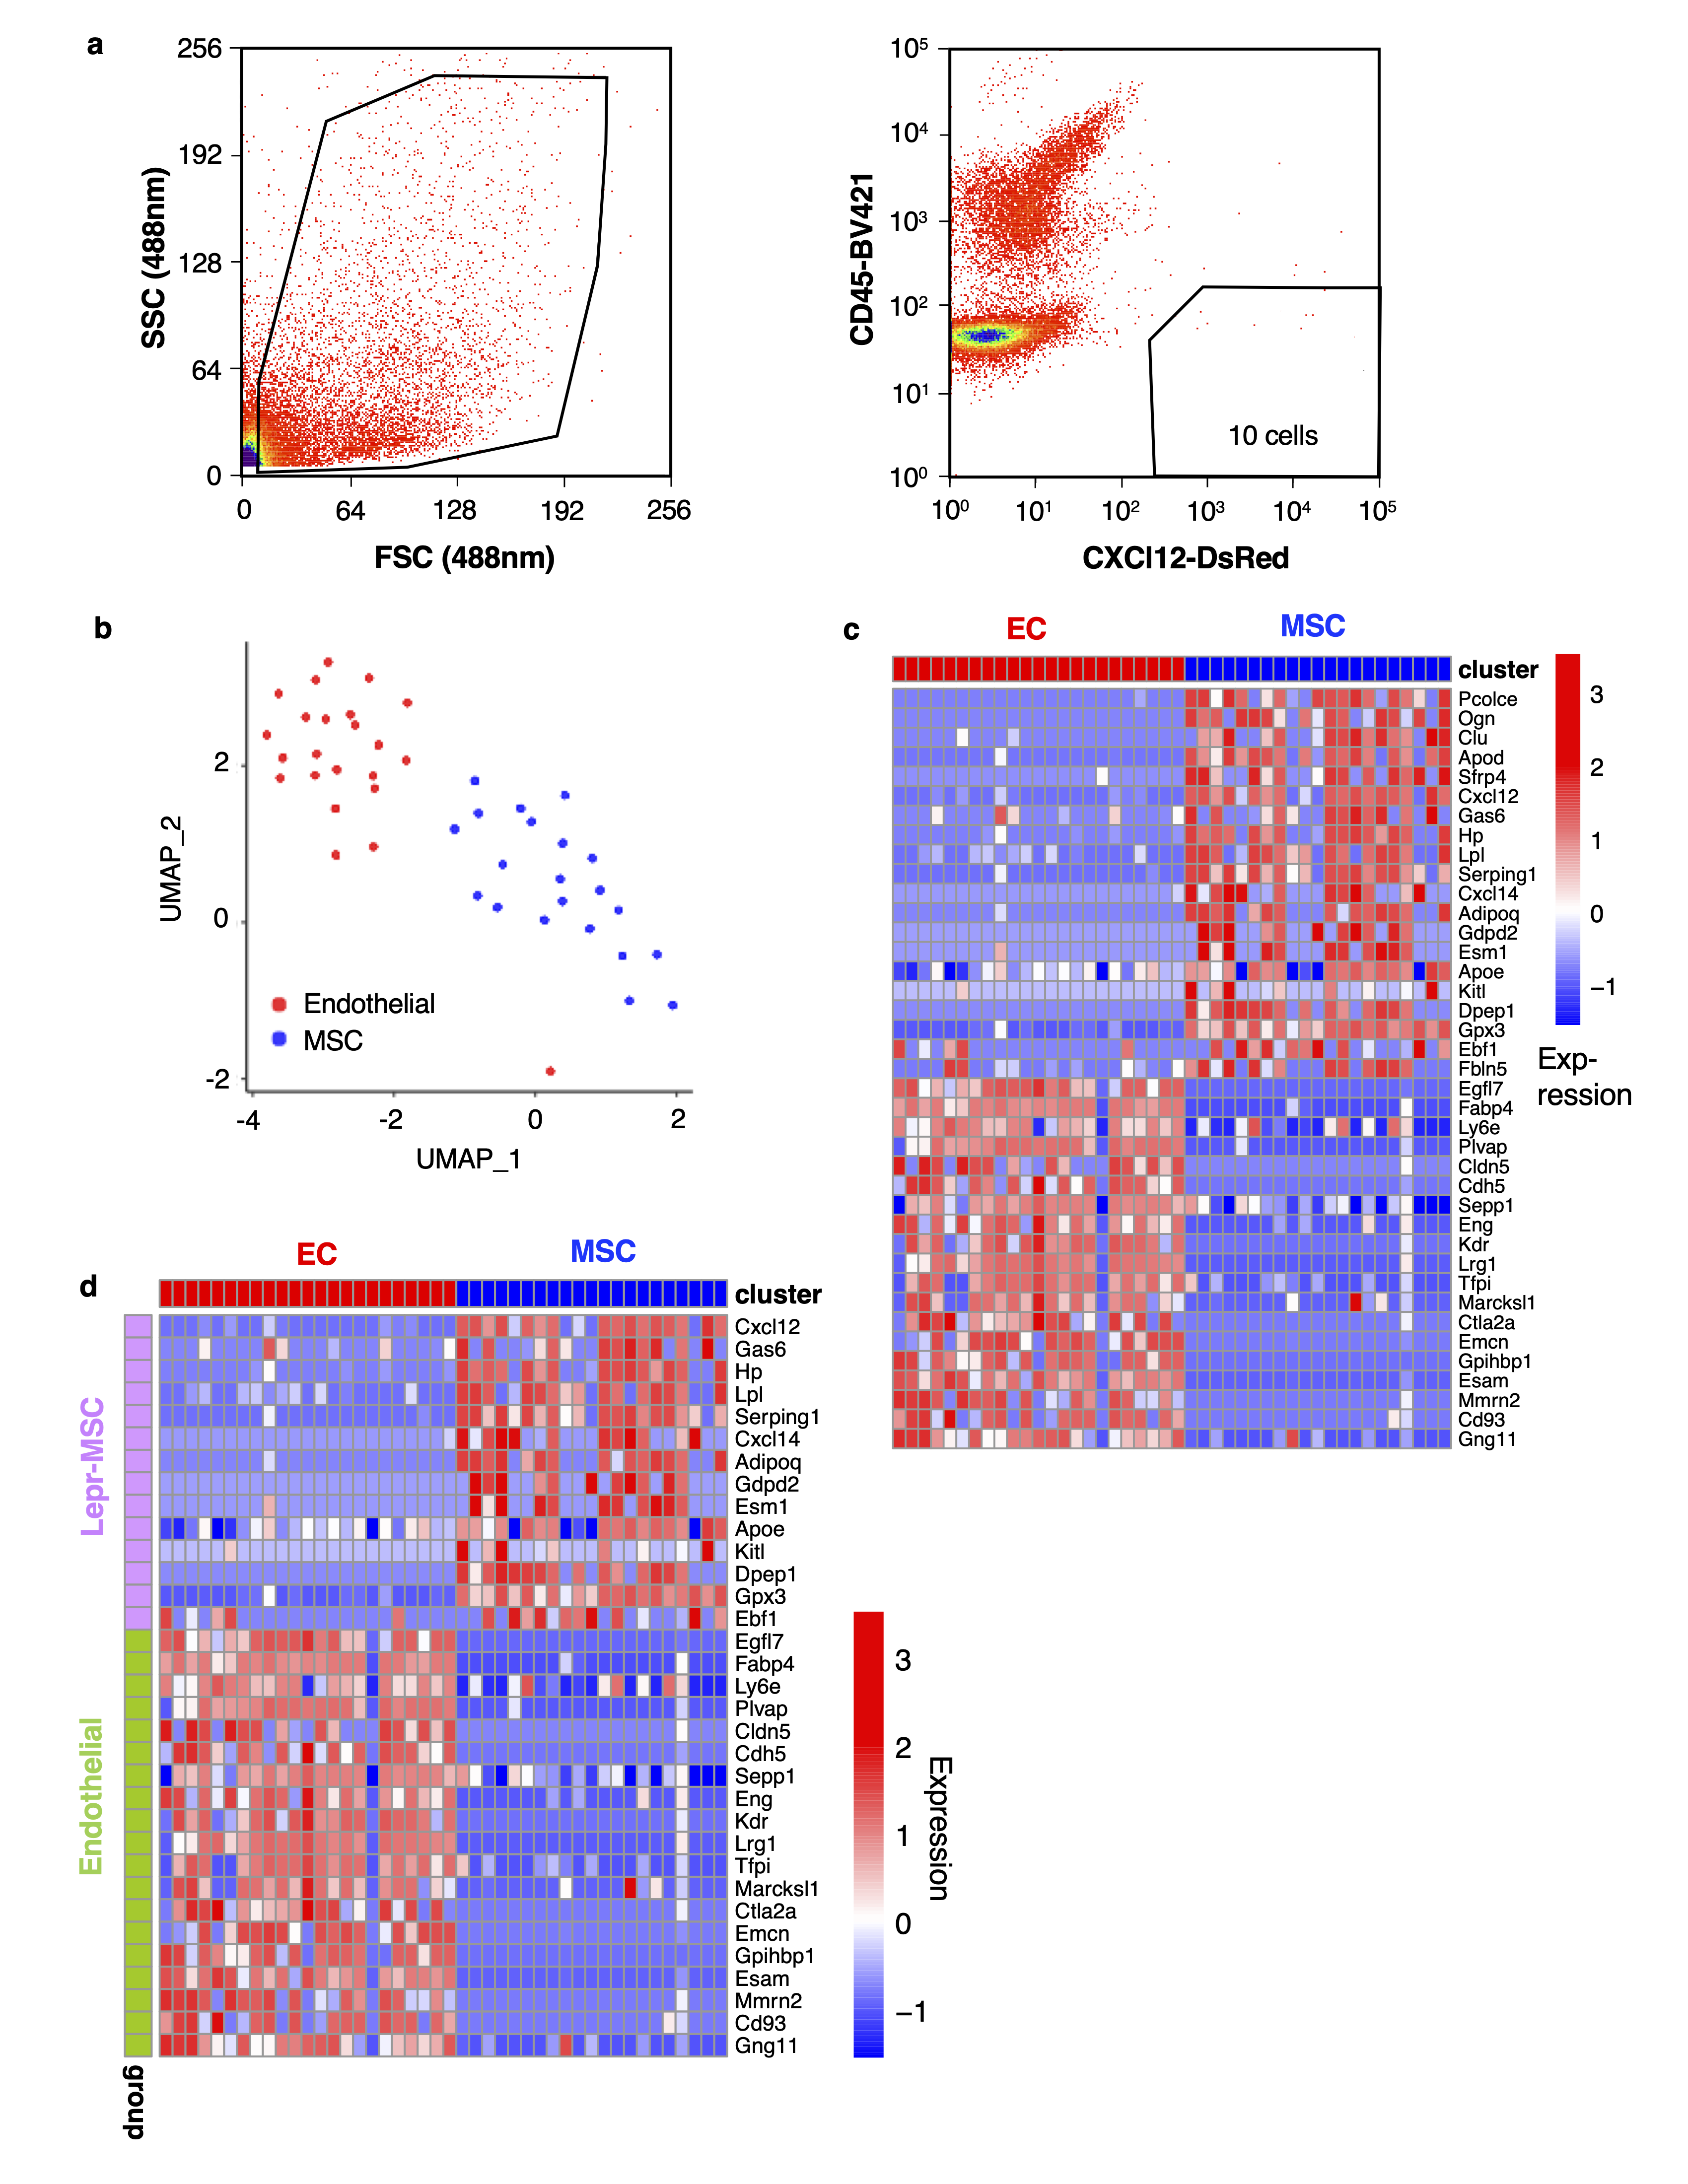
Prior to sorting or analysis, samples were cell-surface stained with anti-CD45-BV421 (BioLegend, dilution 1 to 100) for 30 minutes at 4°C in Medium 199+ (Gibco) supplemented with 2% FBS. Prior to sorting, 1ml of PBS (ThermoFisher Scientific) was added to each sample tube, along with 0.1µg of DAPI (ThermoFisher Scientific). The sample was incubated for 10 min, gently vortexed and transferred to the flow cytometer (MoFlo Astrios EQ cell sorter). Flow cytometric data was analyzed using the FlowJo software package (Treestar). Single, live, CD45-DsRed+ stromal cells (see Extended Data Figure 6a for example of gating strategy) were sorted into individual wells of a 96-well PCR plate filled with 2.6µl of Lysis Buffer (Takara Bio USA, Inc.). Plates were sealed, spun down, snap-frozen and stored at -80°C prior to preparation for cDNA synthesis using the SMARTseq-v4 assay.
Flow cytometry analysis of leukemia burden and DPP4
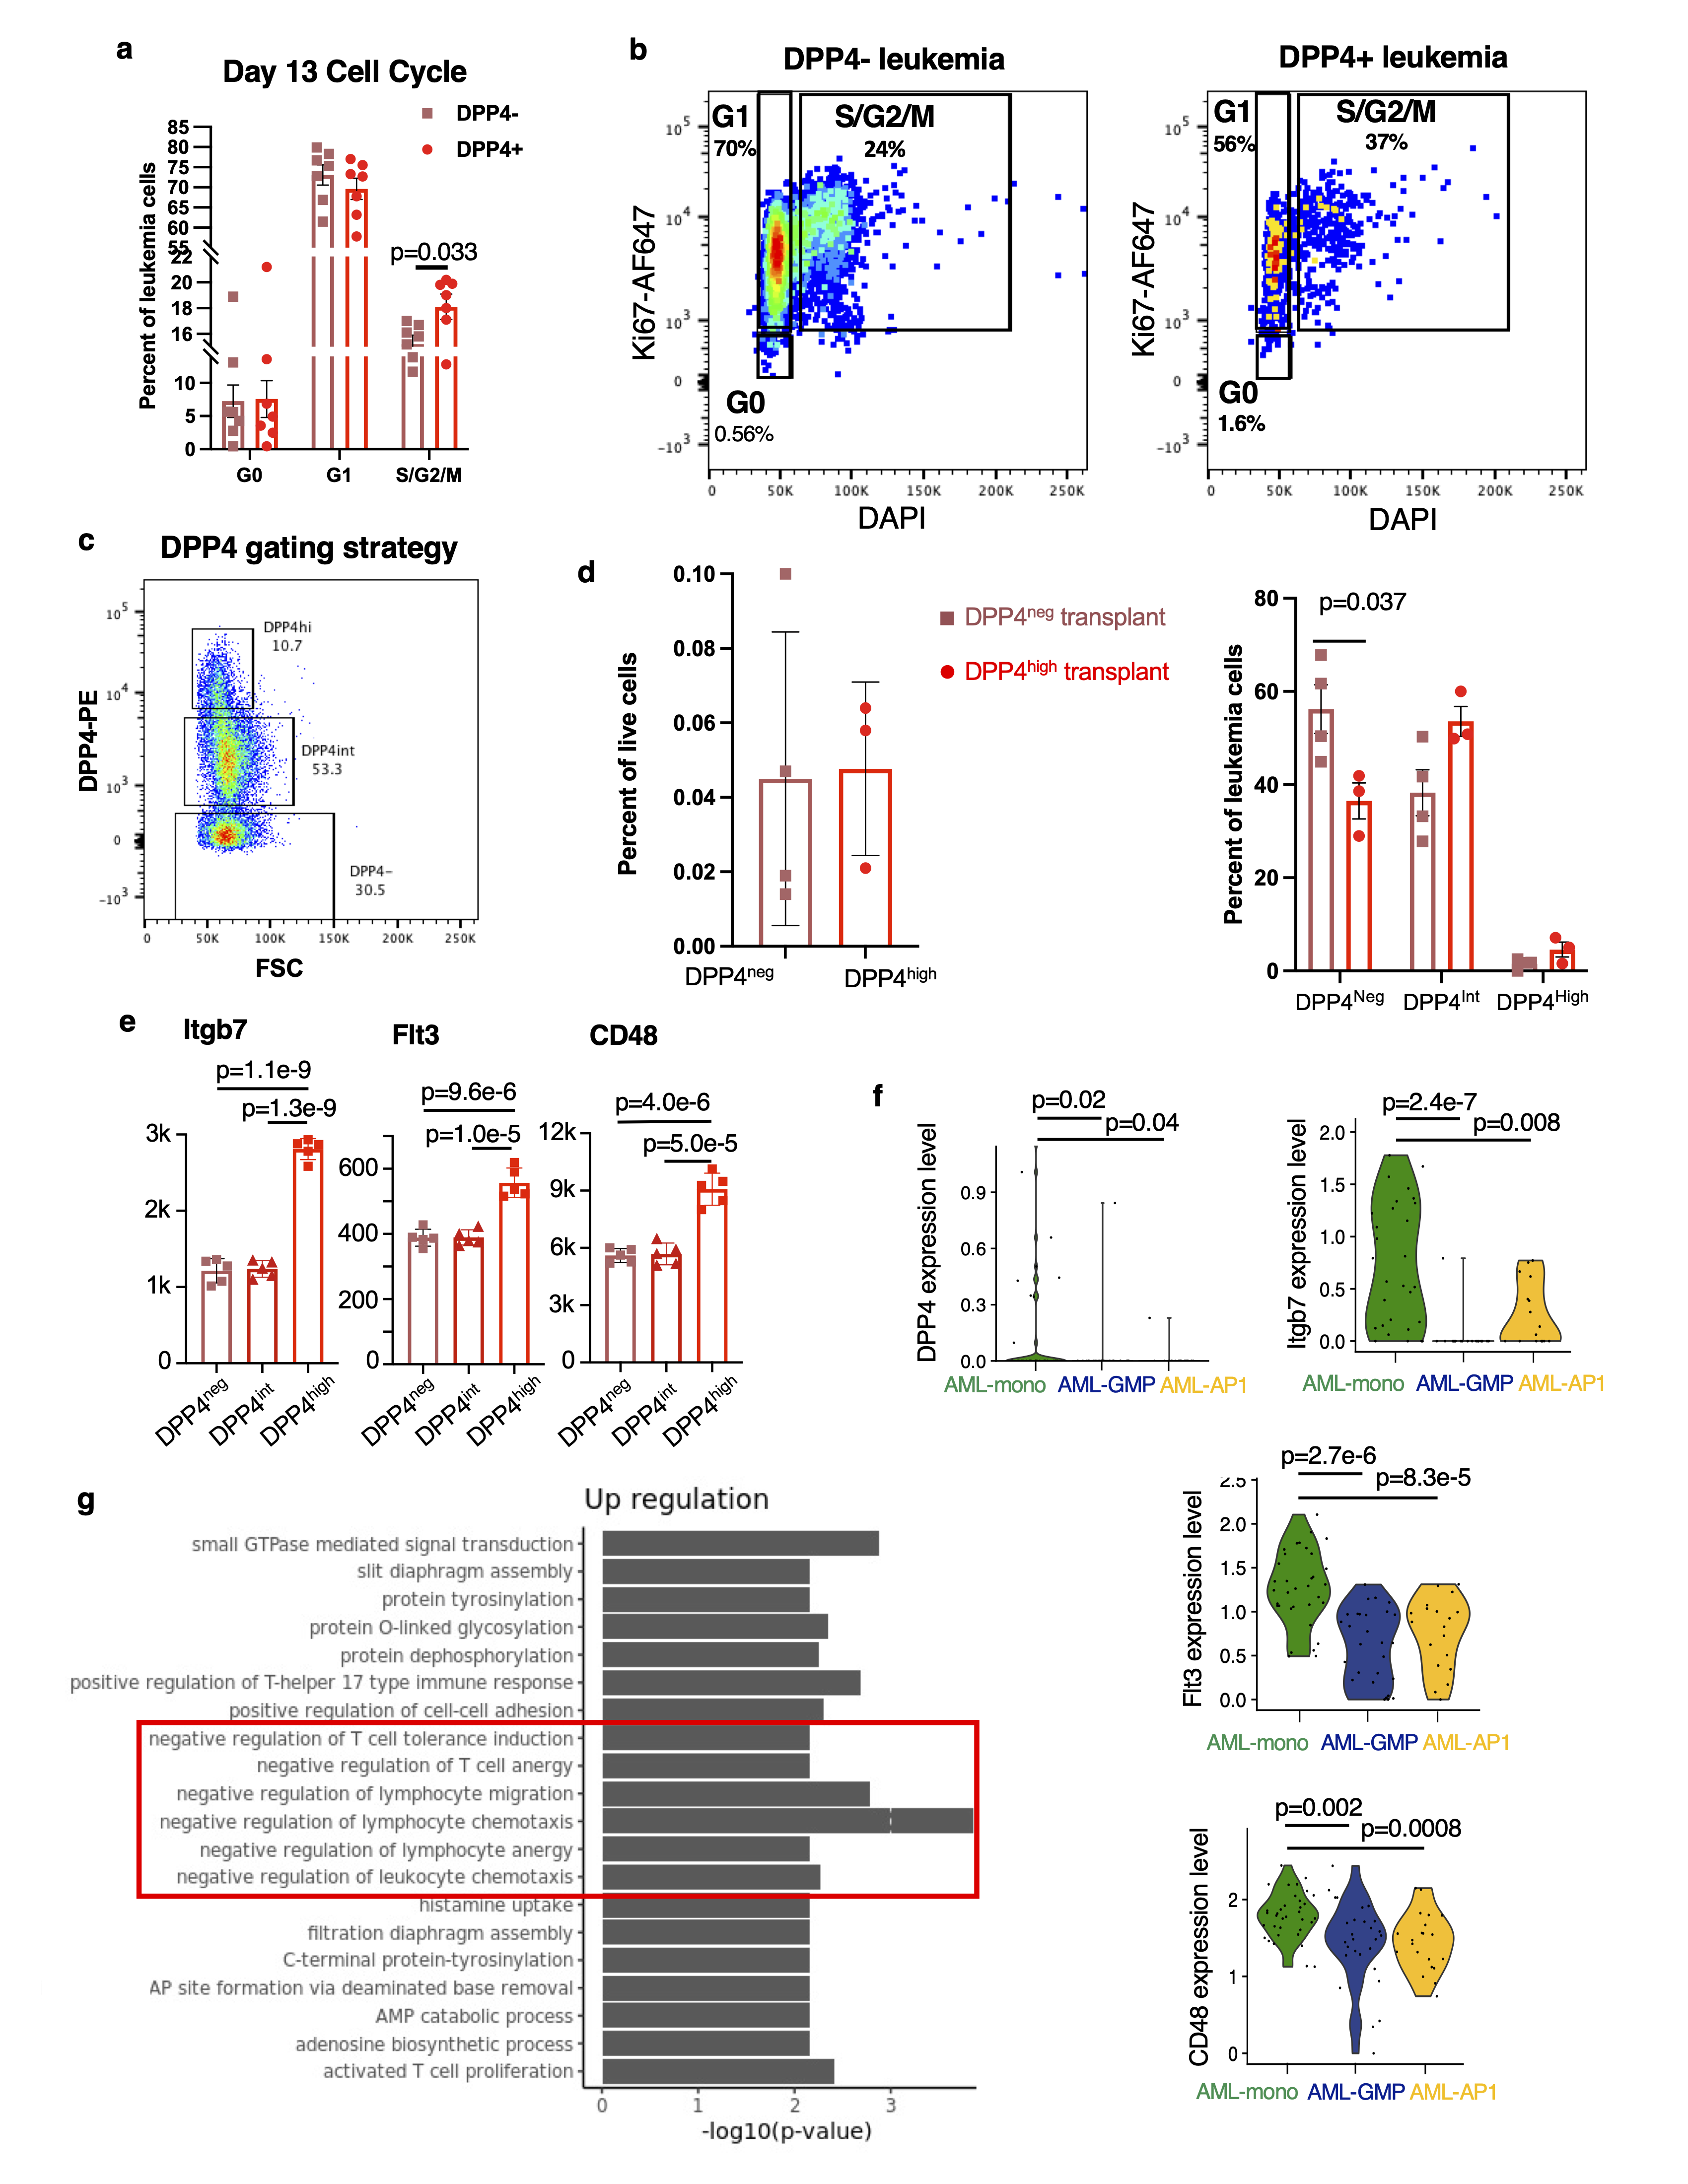
Leukemic bone marrow was blocked using anti-mouse Fc Block (BD Biosciences, dilution 1 to 50) for 10 minutes at 4°C in Medium 199+ 2% FBS. Surface staining was thereafter performed with CD45-APC/Cy7 (BD Biosciences, dilution 1 to 100) and DPP4-PE (BioLegend, dilution 1 to 20) for 30 minutes at 4°C. The cells were then washed and resuspended in Medium 199+ 2% FBS with 0.25µg 7AAD (BD Biosciences). Flow cytometric analysis was performed on a BD FACS Aria III sorter (BD Biosciences) and all data was analyzed using FlowJo software package (Treestar). See Extended Data Figure 8c for gating strategy used to distinguish DPP4high, DPP4int and DPP4neg cells. Note that DPP4+ cells were defined as DPP4high and DPP4int.
Flow cytometry analysis of leukemia cluster cell surface markers
Leukemic bone marrow was blocked using anti-mouse Fc Block (BD Biosciences, dilution 1 to 50) for 10 minutes at 4°C in Medium 199+ 2% FBS. Surface staining was thereafter performed with Leukemia cluster cocktail (Table S6) for 30 minutes at 4°C. The cells were then washed and resuspended in Medium 199+ 2% FBS with 0.25µg 7AAD (BD Biosciences). Flow cytometric analysis was performed on a BD FACS Aria III sorter (BD Biosciences) and all data was analyzed using FlowJo software package (Treestar).
Flow cytometry analysis of intracellular DPP4 staining
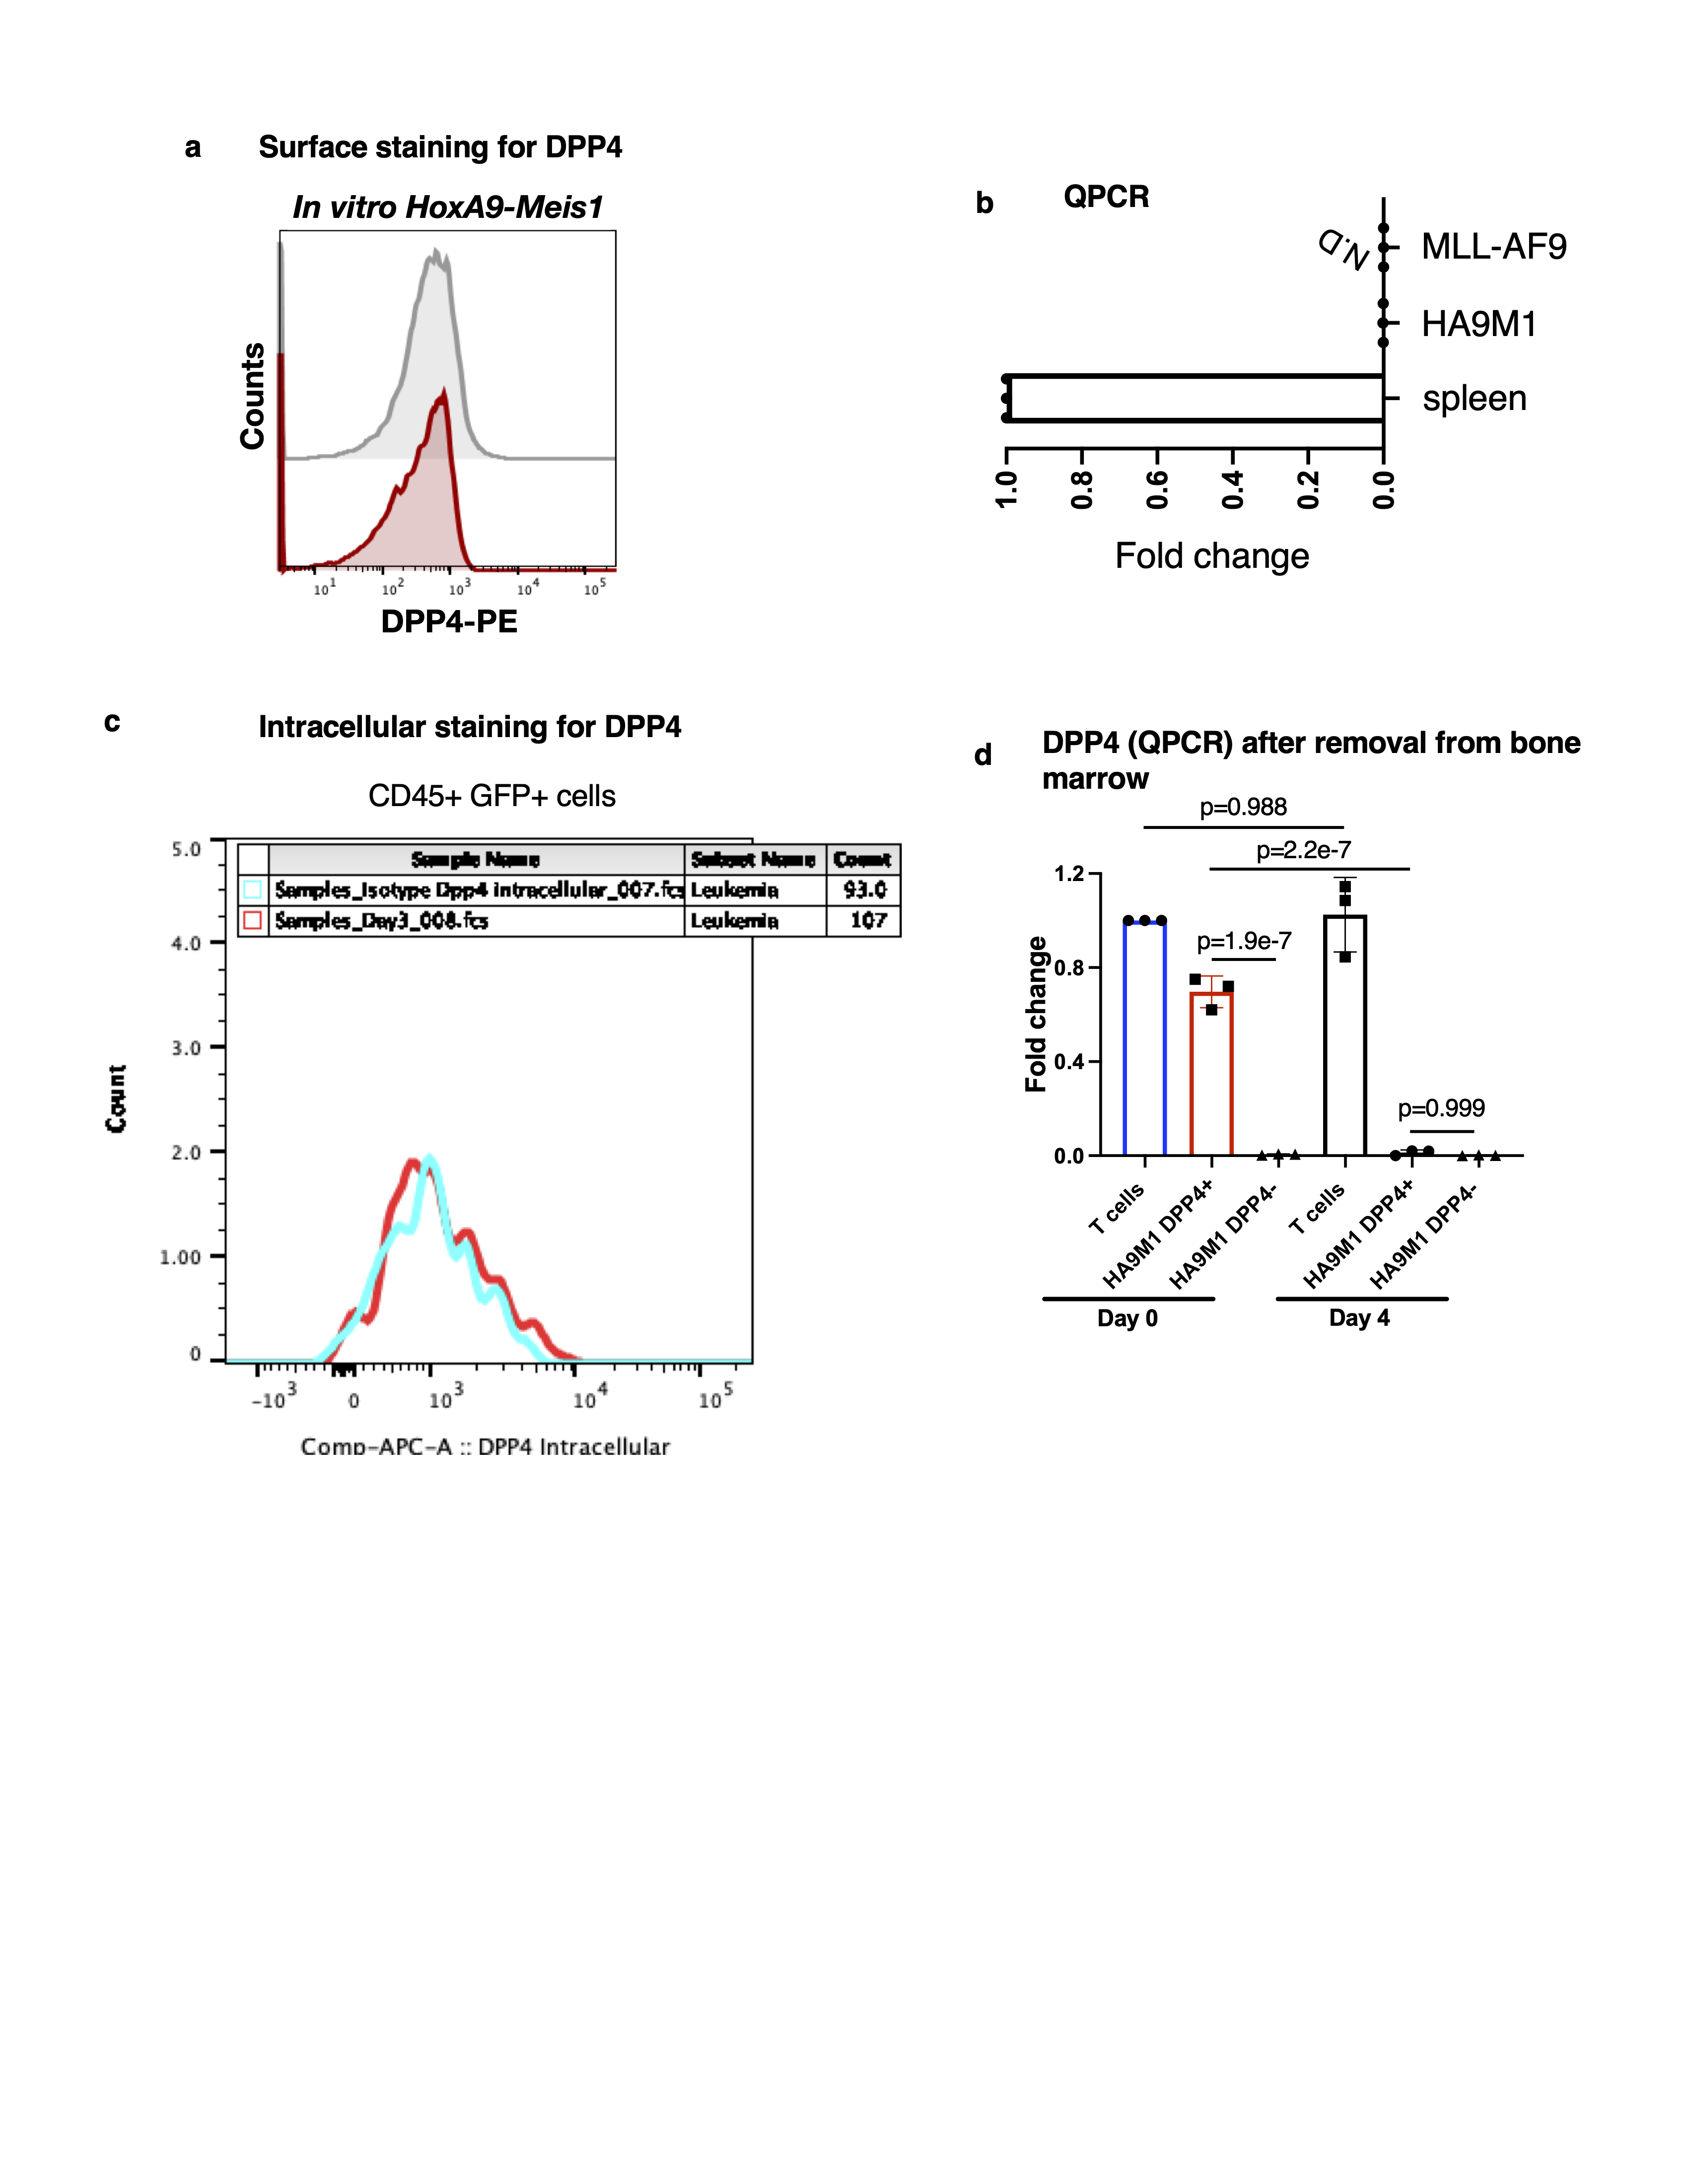
Bone marrow from leukemia bearing mice was incubated with anti-mouse Fc block (BD Biosciences, dilution 1 to 50) for 10 minutes at 4°C followed by surface staining with anti-CD45-APC/Cy7 (BD Biosciences, dilution 1 to 100). Samples were washed and stained with LIVE/DEAD fixable viability dye (ThermoFisher) in accordance with the manufacturer’s instructions. The cells were thereafter fixed with Cytofix/Cytoperm (BD Biosciences) for 20 minutes at 4°C. 1x Perm/Wash buffer (BD Biosciences) was then used to wash the cells and the cells were incubated with either anti-DPP4 or an isotype control antibody (Biolegend, dilution 1 to 20 for both) that were both conjugated to Alexa Fluor 647 in house (Abcam) for 30 minutes at room temperature. The cells were then washed one last time in Perm/Wash buffer (BD Biosciences) and resuspended in Medium 199+ 2% FBS for analysis. Flow cytometric analysis was performed on an LSR II instrument (BD Biosciences) and all data was analyzed using the FlowJo software package (Treestar).
Flow cytometric analysis of cell cycle
Bone marrow isolated from leukemic mice was blocked with anti-mouse Fc block (BD Biosciences, dilution 1 to 50) for 10 minutes at 4°C. Surface staining with anti-CD45-APC/Cy7 (dilution 1 to 100) and DPP4-PE (dilution 1 to 20) was performed at 4°C for 30 minutes. Following this, the samples were washed in Medium 199+ 2% FBS and then fixed with Cytofix/Cytoperm (BD Biosciences) for 20 minutes at 4°C. The fixed cells were thereafter washed with 1x Perm/Wash buffer (BD Biosciences) and resuspended in Perm/Wash buffer containing anti-Ki67-AF647 at a 1:10 dilution for a 30-minute incubation. The samples were washed one more time with 1x Perm/Wash buffer (BD Biosciences) and then incubated in 1x Perm/Wash buffer (BD Biosciences) with 2mg/ml DAPI (Biolegend) for 10 minutes. Finally, the samples were spun down to remove the DAPI-containing buffer and resuspended in Medium 199+ 2% FBS for analysis. Flow cytometric analysis was performed on a BD FACS Aria III sorter (BD Biosciences) and all data was analyzed using FlowJo software package (Treestar).
Analysis of DPP4 expression following co-culture
250,000 MLL-AF9 or HoxA9-Meis1 leukemia cells were plated at a 1:1 ratio with the following stromal cell lines: NIH3T3 (ATCC), MS-5 (RIKEN), MLO-A5 (Kerafast), MC-3T3-E1 (ATCC), and SV40 immortalized bone marrow stroma (see separate methods section). The cells were grown in RPMI-1640 (Gibco) supplemented with 1% Penicillin/Streptomycin (Gibco), and 10% FBS (Gibco). MLL-AF9 cultures were supplemented with 20 ng/ml SCF, 10 ng/ml IL-3 and 10 ng/ml IL-6 (all cytokines from Peprotech). HoxA9-Meis1 cell cultures were instead grown in 100 ng/ml SCF and 5 ng/ml IL-3. The cells were co-cultured for 3 days. For flow cytometric analysis of DPP4, the co-cultures were trypsinized and subsequently blocked with murine Fc block (dilution 1 to 50) for 10 minutes at 4°C. Surface staining with anti-CD45-APC/Cy7 (dilution 1 to 100) and DPP4-PE (dilution 1 to 20) was then carried out for 30 minutes at 4°C. The cells were thereafter washed and resuspended in Medium 199 +2% FBS with 0.25µg 7AAD (BD Biosciences) for analysis. Flow cytometric analysis was performed on a LSR II instrument (BD Biosciences) and all data was analyzed using FlowJo software package (Treestar). For the analysis of DPP4 mean fluorescence intensity (MFI), each sample was normalized to a corresponding isotype control antibody-stained sample.
Flow cytometry analysis of myeloid lineage markers
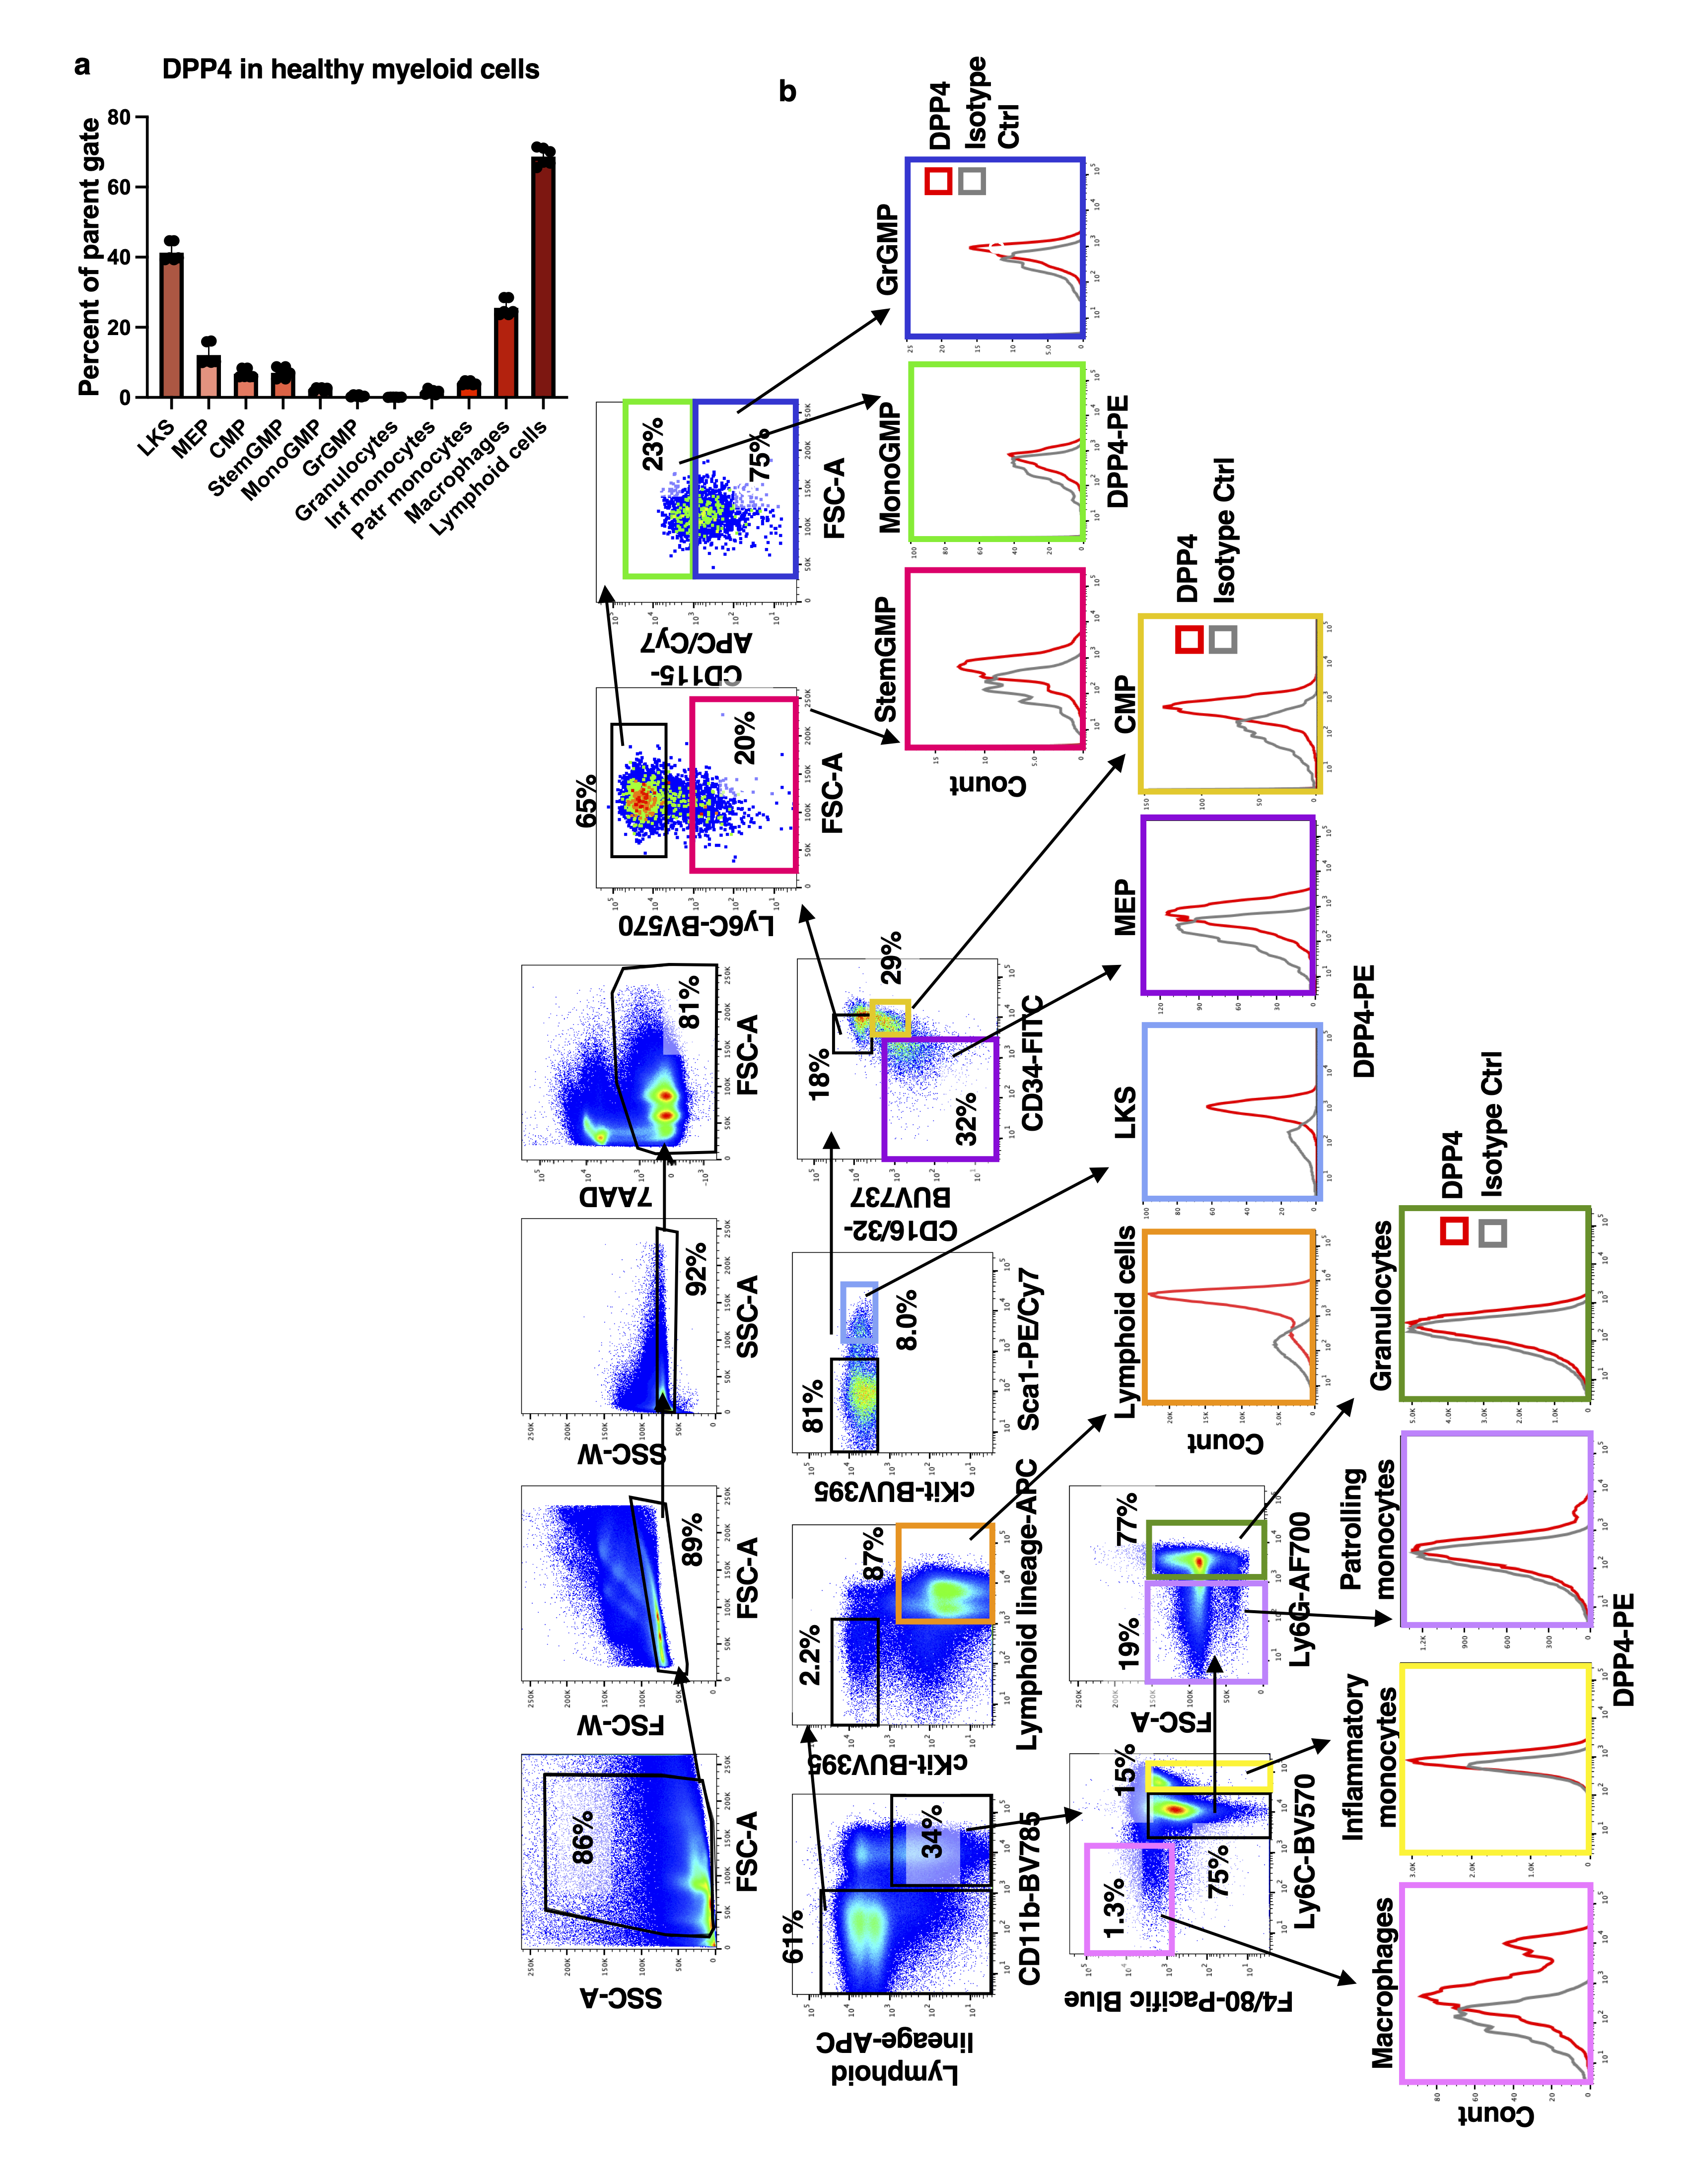
Bone marrow collected from C57Bl/6J mice was stained with HSPC cocktail (Table S6) for 45 minutes at 4°C. The cells were then washed and resuspended in Medium 199+ 2% FBS with 0.25µg 7AAD (BD Biosciences). Flow cytometric analysis was performed on a BD FACS Aria III sorter (BD Biosciences) and all data was analyzed using FlowJo software package (Treestar).
Reverse-transcription quantitative PCR analysis
RT-qPCR analysis was performed to determine levels of Dpp4 mRNA. 1 million leukemia cells or T cells were lysed and the RNA was extracted using the RNaeasy Plus mini kit isolation kit (Qiagen). RNA was subsequently reverse transcribed into cDNA with the SuperScript IV First-Strand Synthesis System (Thermo Fisher). The qPCR analysis was performed using iTaq Universal SYBR Green Supermix (Biorad) with primers specific for Dpp4 (Forward- ACCGTGGAAGGTTCTTCTGG, Reverse- CACAAAGAGTAGGACTTGACCC) and Gapdh (Forward- TGTGTCCGTCGTGGATCTGA, Reverse- TTGCTGTTGAAGTCGCAGGAG). Threshold values (CT) were estimated using CFX Maestro (Biorad) and transcript levels were normalized by subtracting the corresponding Gapdh values. The relative amount of RNA was presented as 2−ΔΔCt.
Droplet-based single-cell RNA sequencing
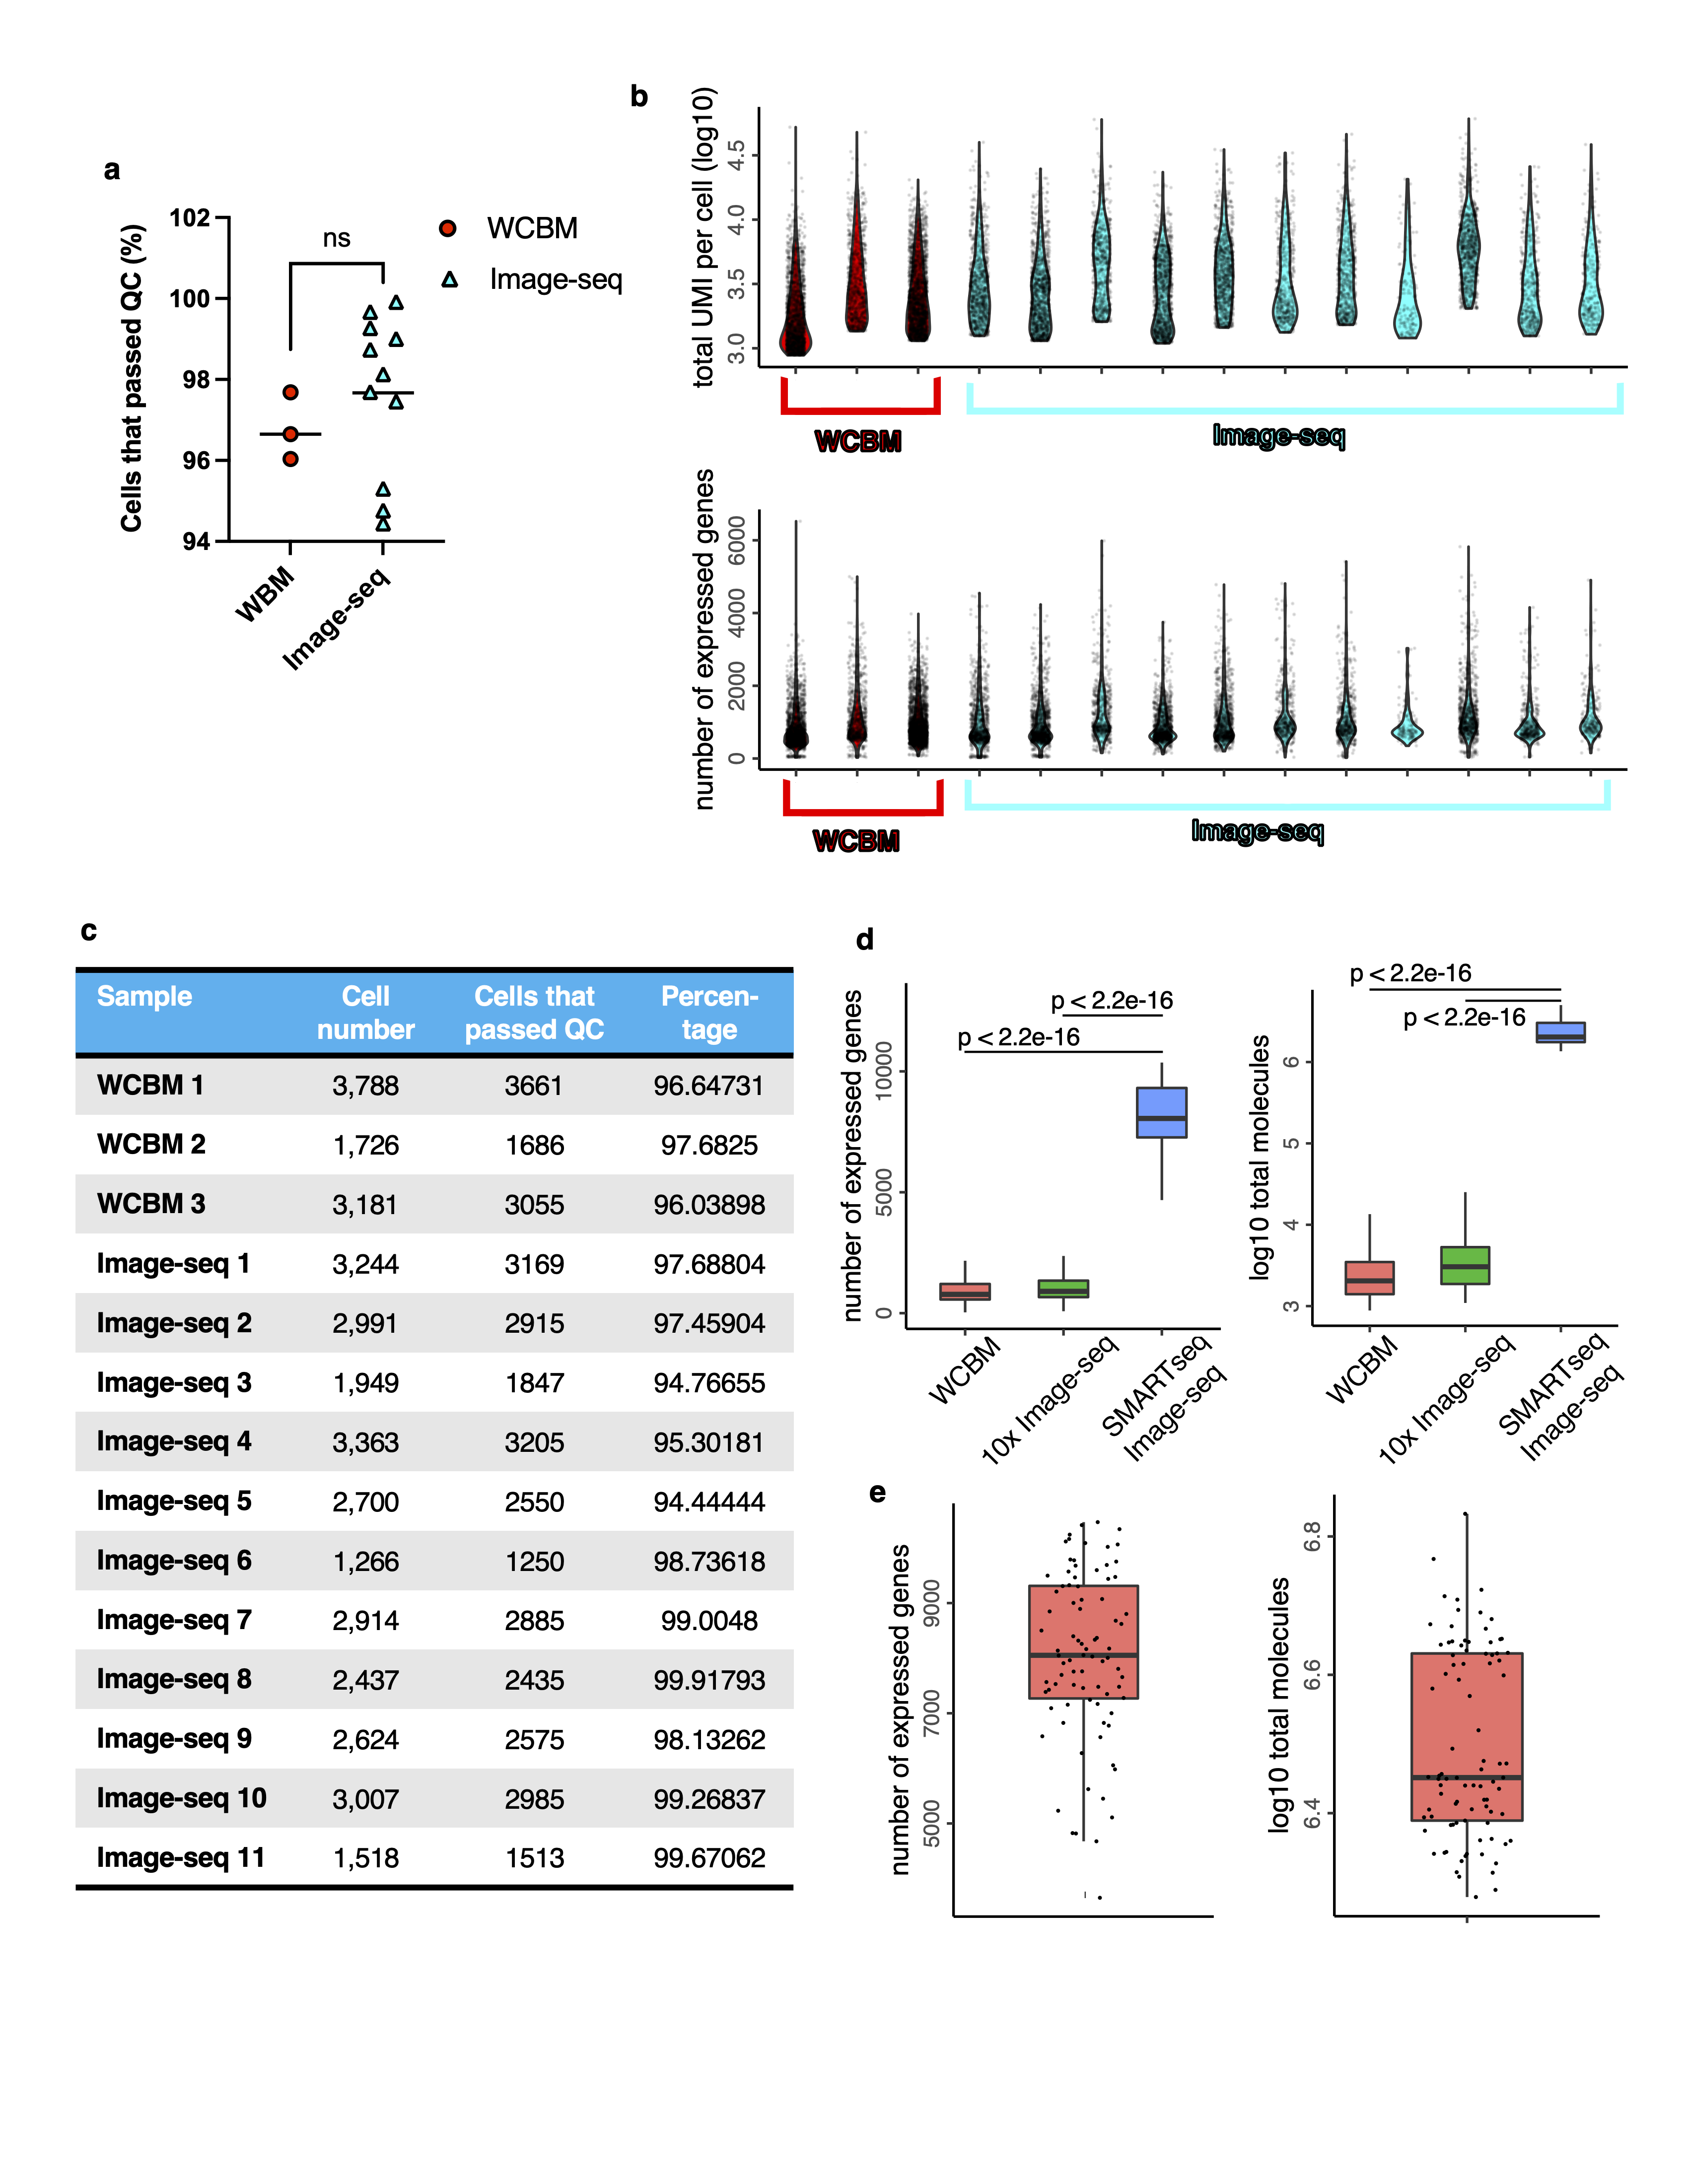
WCBM and Image-seq samples were counted in a hemocytometer and encapsulated for a maximum output of 8,000 cells into emulsion droplets using the Chromium Controller (10X Genomics). scRNA sequencing libraries were subsequently prepared using Chromium Single Cell 3 v2 Reagent kits (10X Genomics). Reverse transcription and library preparations were done on a Biorad T100 Thermo Cycler (Biorad). cDNA libraries and final libraries were quantified on an Agilent BioAnalyzer (Agilent Technologies) using a High Sensitivity DNA kit (Agilent Technologies). Libraries were diluted to 4nM and pooled before sequencing on the NextSeq 500 Sequencing system (Illumina). Pools were sequenced with 75 cycle run kits (26bp Read1, 8bp Index1 and 55bp Read2) to ~70-80% saturation level.
SMARTseq-v4 library preparation and sequencing
Libraries were prepared using the MANTIS Liquid Handler (Formulatrix) and the Biomek FXP Single Arm System with Span-8 Pipettor (Beckman Coulter, A31843). Full-length cDNA was prepared using the SMARTseq-v4 Ultra Low Input RNA Kit for Sequencing (Takara Bio USA, Inc.) and sequencing libraries prepared using the Nextera XT DNA library preparation kit (Illumina).
The SMARTseq-v4 assay utilizes the SMART technology, switching mechanism at 5’ end of RNA template, to generate full-length cDNA from as little as 10 pg of total RNA. The cDNA was assessed for concentration using the Quant-iT Picogreen dsDNA assay kit (Invitrogen, P7589) on the SpectraMax i3 Multi-Mode Detection Platform (Molecular Devices) and normalized to 0.2 ng/µl prior to library prep. Full-length cDNA was fragmented using the Nextera technology in which DNA is simultaneously tagged and fragmented. Tagmented samples were enriched and indexed using 18 cycles of amplification with PCR primers, which included dual 8 bp index sequences to allow for multiplexing (Nextera XT Index Kit). Excess PCR reagents were removed through magnetic bead-based cleanup using PCRClean DX beads (Aline Biosciences) on a Biomek FXP Single Arm System with Span-8 Pipettor (Beckman Coulter, A31843). Resulting libraries were assessed using a 4200 TapeStation (Agilent Technologies) and quantified by qPCR (Roche Sequencing). Libraries were pooled and sequenced on a NextSeq Mid Output flow cell using paired, 75 bp reads (Illumina Inc).
10X scRNA-Seq data processing
For the 10X scRNA-Seq data, fastq files were obtained using bcl2fastq (v1.8.4). Reads were aligned to the mm10 mouse reference genome using the Cellranger pipeline (version 3.0.2, 10x Genomics) with default parameters. The obtained read count matrices were further filtered based on two quality metrics: (1) The number of total UMI counts per cell (> 800); (2) mitochondrial transcript ratio per cell (< 0.2). We used Conos (v1.4.1, https://github.com/kharchenkolab/conos)21 to integrate multiple scRNA-seq datasets together. Each individual dataset was first normalized using basicP2proc function in pagoda2 (v1.0.10) using default parameters (https://github.com/kharchenkolab/pagoda2/releases/tag/v1.0.10). Different samples were then aligned using Conos with default parameter settings (PCA space with 30 components, angular distance, mNN matching, k=15, k.self=5), and UMAP embedding was estimated using default parameter settings. Leiden clustering (conos::findCommunities) was used to determine joint cell clusters across the entire dataset collection. Quality parameters for the 10x scRNA-seq data are listed in Table S7 and Extended Data Figure 5.
Differential expression
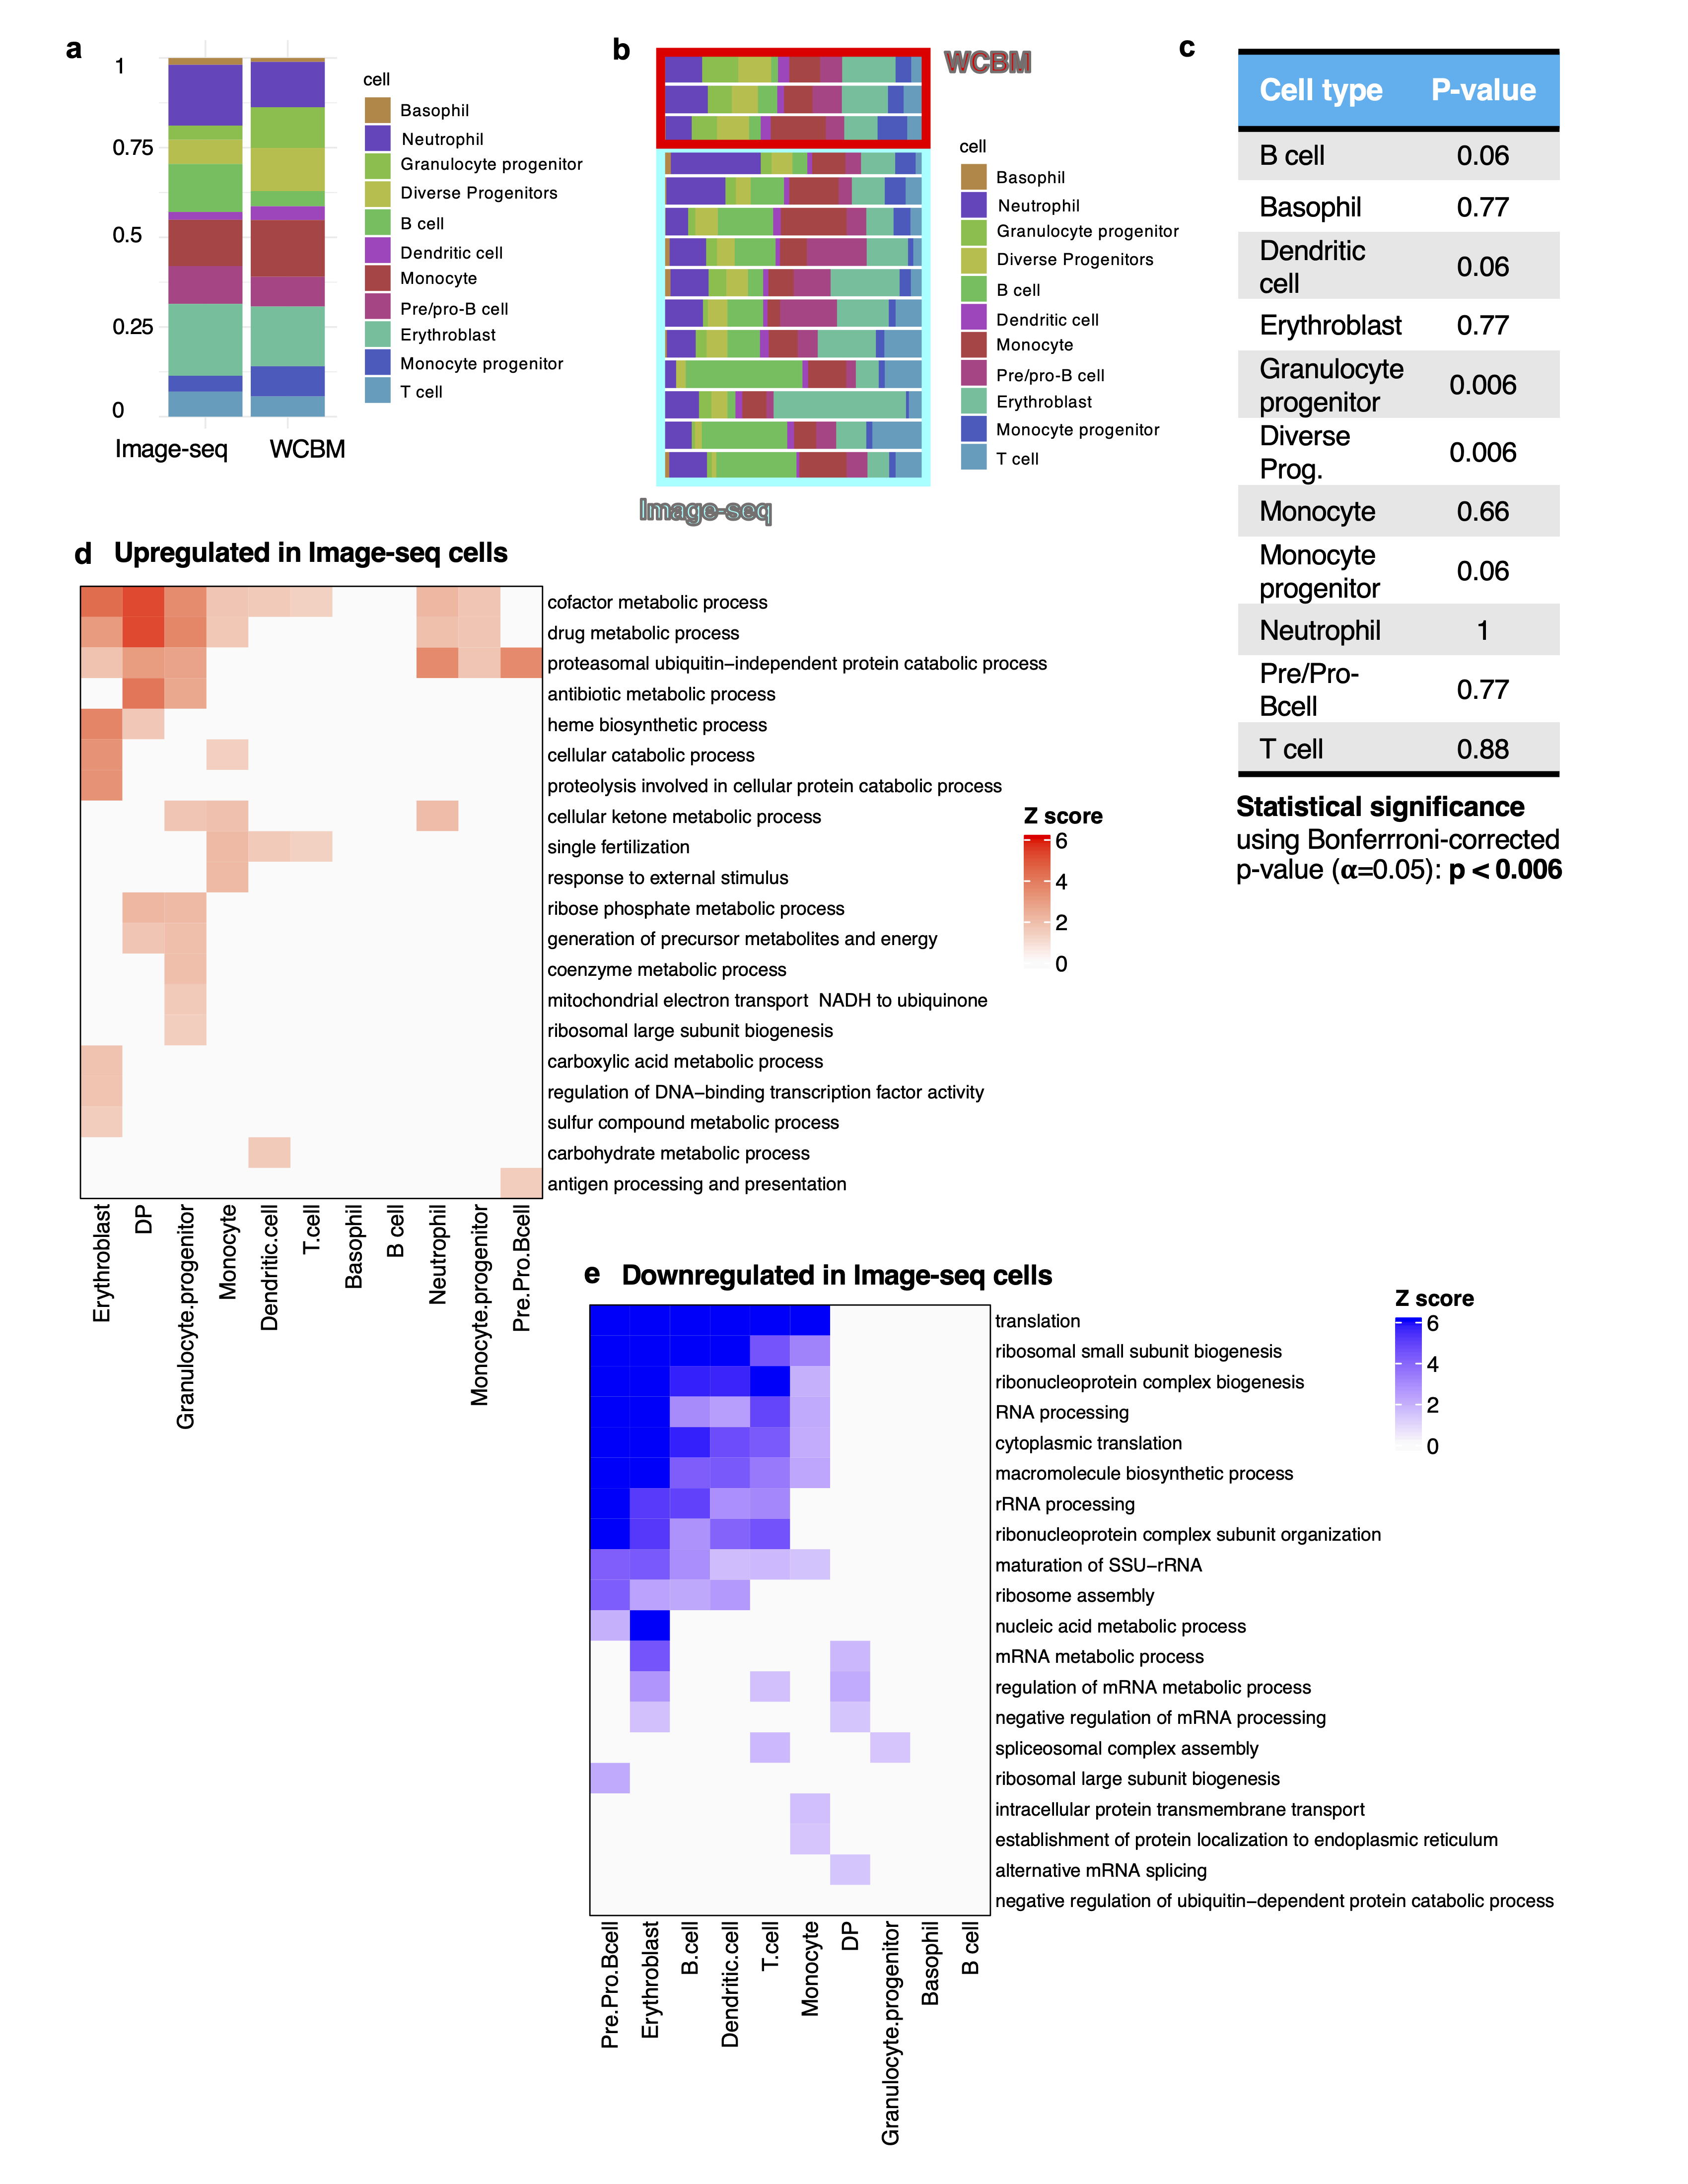
For differential expression analysis between cell types in the 10X scRNA-seq data, a Wilcoxon rank sum test, implemented by the getDifferentialGenes() function from Conos R was used to identify statistically significant marker genes that were expressed in each cell cluster (Table S1). The genes were considered differentially expressed if the p-value determined Z score was greater than 3. For differential expression analysis between Image-seq and WCBM (for example Image-seq monocytes vs. WCBM monocytes), the getPerCellTypeDE() function in Conos was utilized.
Cell Annotation
Annotation of the cluster communities was done using marker gene expression. Initial annotations were obtained by entering the top 100 differentially expressed genes in each cluster (ordered by log-fold change) into the CellKb database65 and further refined by consulting the primary literature referenced therein along with other relevant publications. Specificity of selected markers was additionally confirmed by evaluating expression in Haemopedia66 and CellMarker67 bone marrow datasets. We identified markers to classify 9 major cell types: B cell (Ms4a1,Ly6d,Cd79a), Pre/Pro-Bcell (Vpreb1, Vpreb3, Dntt,), Basophil (Mcpt8, Prss34, Ms4a2), Dendritic cell (Bst2, Irf8, Siglech, Cox6a2), Erythroblast (Car2, Hemgn, Ctse, Cpox, Atpif), Monocyte (IGHG1, IGHG3), Monocyte progenitor (Ly6c2, S100a10), Diverse progenitors (Cd34, Prtn3, Mpo, Elane, Mpl), Granulocyte progenitor (S100a8, S100a9, Cebpe, Fcnb), Neutrophil (Mmp8, Ifitm6, S100a11, S100a8, S100a9).
SMARTseq-v4 sequencing data analysis
SMARTseq-v4 sequencing data were aligned with hisat268 (v4.8.2), using genome reference mm10. We used featureCounts69 (v1.6.4) to calculate read counts. Quality of cells was then assessed based on number of total counts per cell (library size), requiring at least 500,000 reads per cell. A total of 84 AML and 43 stroma cells were retained for down-stream analysis. Seurat was used to analyze the SMARTseq-v4 data, quality parameters are listed in Table S7 and Extended Data Figure 5d,e. Briefly, we first performed data normalization using the NormalizeData function with default settings. The top 30 principal components were used to construct SNN graphs and UMAP embeddings. The FindAllMarkers function from Seurat was used to identify differentially expressed (marker) genes for clusters or subtypes. Mesenchymal stromal and endothelial cells were annotated using well-established marker genes: Mesenchymal Stromal (Cxcl12, Pcolce, Ogn, Adipoq) and Endothelial (Eng, Kdr, Plvap, Egfl7), see also heatmap in Extended Data Figure 6d, as well as Ref. 27.
Cell cycle signature score
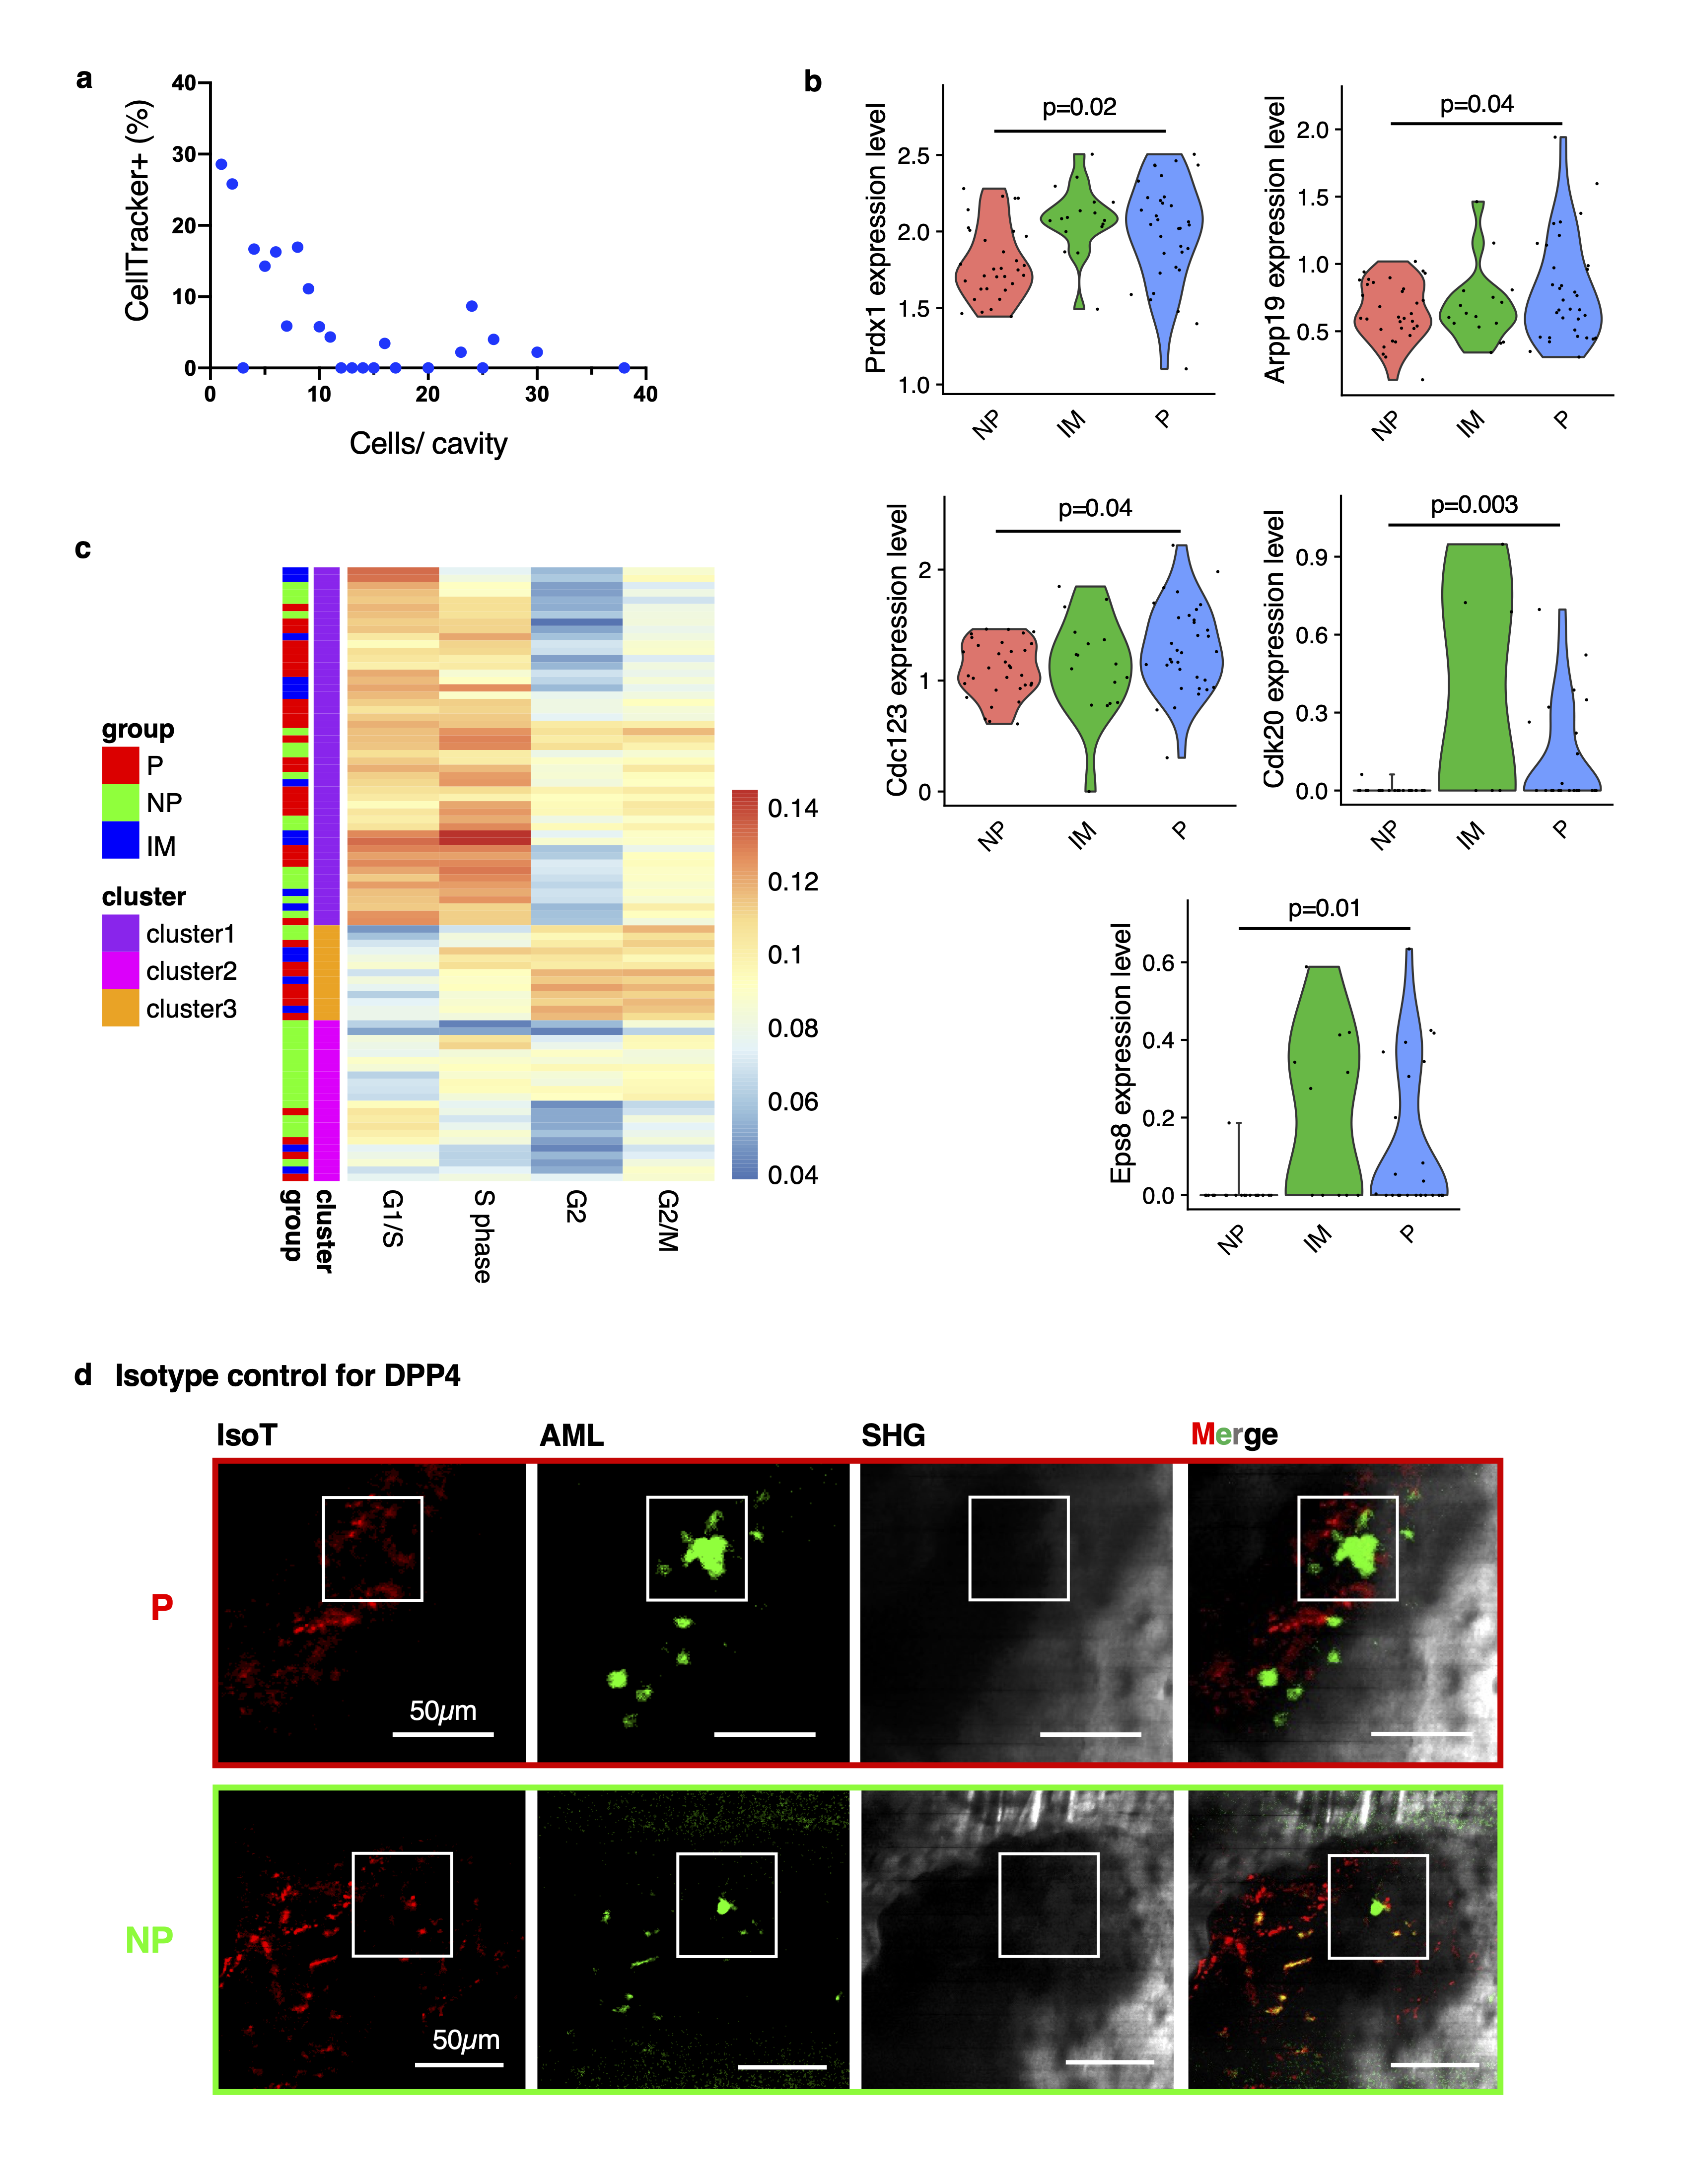
To assess cell states in different cell subsets and conditions, we used a gene set signature score to measure the relative difference of cell cycle states. The signature scores were calculated as average expression values of the genes in a given set. The signature gene list was downloaded from Whitfield et al.70. Hierarchical clustering of cell cycle signature score was used to group AML cells. A two-sided Student’s t-test was used to assess differential expression of selected cell cycle genes between proliferating (P) and non-proliferating (NP) cells (Table S4).
Regressing out cell cycle genes
Seurat71 (v4.0.6) was used to regress out cell cycle genes. First, we assigned each cell a score, based on its expression of G2/M and S phase markers with the CellCycleScoring function. Then we applied the ScaleData function to regress out cell cycle genes. The scaled residuals of this model represent a ‘corrected’ expression matrix, that can be used downstream for dimensionality reduction. UMAP embedding and graph-based shared nearest neighbor clustering were used with 5 principal components and Seurat::FindClusters() was used to identify AML cell sub-clusters. Seurat::FindAllMarkers, which utilizes a two-sided Wilcoxon Rank Sum test to assess statistical significance, was used to find the differentially expressed genes within each sub-cluster (Table S2).
Analysis of differentially expressed genes
DESeq260 was used for analyzing differentially expressed genes between proliferating (P) and non-proliferating (NP) cells (Figure 5a and Table S3), as well as between P+IM (=intermediate) and NP cells (Table S5).
GO Term enrichment
To test for enriched GO Biological Processes in gene sets, the ClusterProfiler72 (v4.0.0) package was used to evaluate enrichment of GO categories in the sets of up- and down-regulated genes, respectively, and rank them by adjusted p value (Figure 5h and Extended Data Figures 5d,e and 8g). The set of all expressed genes was used as a background.
Analysis of human AML data
A regular gene expression correlation analysis was applied to two published, bulk RNA-seq data sets (531 patients for OHSU48, 188 patients for TCGA49) collected from (https://www.cbioportal.org/). Spearman correlation coefficients for each gene with DPP4 were calculated. The top 300 positively correlated genes (based on strength of the correlation coefficient) were determined for each of the two datasets (TCGA and OHSU). Interestingly, we observed a high degree of overlap between the top 300 positively correlated genes from the two data sets. The overlapping gene set was then used for GO analysis.
Multiphoton Imaging Experiments
Image acquisition
For imaging the AML cell distribution in different cavities, as well as CellTracker CMTPX retention, two-photon excitation at 900 nm was used, and the emission was collected at 340-460 nm to detect second-harmonic generation (SHG) signal of collagen (bone) and 500-550 nm to detect the AML-GFP signal. The bone front staining and CMTPX was excited by 775 nm and resulting fluorescence collected by 525/50 nm (tetracycline) and 617/73 nm (Alizarin Red, CMTPX) filters. All image stacks were acquired using a previously described microscope51,61, with a 2-μm step size from the calvaria surface, and 20 frames from the live scanning microscope (30 fps) were averaged to acquire a single image.
For imaging the stroma, b-actin GFP mice, DPP4 expression in vivo, as well as for quantifying AML proliferation, the home-built microscope described above was used, with an imaging wavelength of 980nm. Emission signals were collected with filter 439/154 for SHG signal, filter 525/50 for GFP and filter 607/70 for AF-568 signal with a combination of FF705 LP, FF495 LP and FF552LP dichroic mirrors. For imaging CXCl12-DsRed stroma, two-photon excitation at 980 nm was used, and emission signals were collected with filter 439/154 for SHG signal (blue channel, shown as grey in manuscript figures) and 585/40 for DsRed (red channel) with the same dichroic mirrors as listed above. Image stacks were acquired with a step size of 2µm, as well as a 15-frame average.
For displaying the data, some images were background-subtracted with the mode of the stack histogram (corresponding to the noise pixel intensity) and subsequently filtered using the 3D Fast Filters (median) function in FIJI with an x, y, and z radius unit of 1. The brightness and contrast of images presented in the figures were adjusted, but in all cases image analysis was performed using the raw data.
Image stitching and maximum intensity projections
Large area images were obtained by stitching together images from individual microscope fields of view sequentially for each z plane using the Grid/Collection stitching plugin in Fiji and using an overlap of 30%. Maximum intensity projection images were obtained using the Z Project function (Fiji).
Characterization of P, NP and IM cells
The same bone marrow cavities in the same animals were imaged both on day 1 and 3 after transplantation of AML cells. Identical cavities on day 3 were found by using the recorded coordinates with respect to Bregma and Lambda, and comparison of the signal distribution and specific landmarks in the SHG channel. The number of AML cells were quantified at both time-points, and the fold-change difference in AML cells between day 1 and 3 calculated for each cavity:
fold-change = (#cells day3- #cells day1) / (#cells day1)
Cells were then grouped based on their fold-change as either proliferating (P, fold-change>2), intermediate (IM, 0<fold-change£2), or non-proliferating (NP, fold-change£0), which corresponded to average cell numbers of 29.6 (with a 99.9% confidence interval of 21.7 – 37.4 cells), 13.2 (with a 99.9% confidence interval of 5.5 – 20.8 cells), and 2.1 (with a 99.9% confidence interval of -1.2 – 5.4 cells), respectively, on day 3.
Analysis of cell tracker labeling
AML cells were labeled with CellTrackerTM Red (CMTPX, 10 mM, ThermoFisher Scientific C34552) before transplantation. In brief, the cell suspension (in Ca2+/Mg2+ free PBS containing 10 mM CMTPX) was incubated at 37°C for 45 minutes. Cells were then pelleted to remove the staining solution and re-suspended in 300 mL PBS for retro-orbital injection. The mean cell tracker intensity was measured on day 3 after transplantation and measured at the brightest plane of the cell. The cells were considered positive for CMTPX when the measured signal was greater than 12.5 (the background noise in the marrow cavity). The number of CMTPX+ cells was then divided by the total cell number sampled from the BM cavities harboring the same cell counts (N= 7 mice).
Analysis of DPP4 expression in vivo
DPP4 antibody (BioLegend) and Isotype control antibody (BioLegend) were conjugated to AF568 using the Lightning Link kit (Abcam). Antibody and isotype were injected retro-orbitally 1h prior to the imaging session at a dosage of 1 mg/kg. Images were collected with an excitation wavelength of 980 nm (1.6 nJ pulse energy, filter set detailed above), using a z-step of 2µm with 15-frame average on the custom-built microscope described above.
AML cells were segmented based on the GFP signal in the obtained images. For this, seeds were generated using the interactive watershed tool (Fiji) and used as input for the 3D-Watershed segmentation plugin (Fiji). The images were thresholded to generate a mask. This was used to calculate the total AF 568 signal, as well as the total GFP signal, within each cell by using the red and green channels of the images, respectively, as input for the 3D Object counter plugin (Fiji). The ratio of red/green fluorescence (multiplied by 10) for each cell was plotted in Figure 5c both for the DPP4 and isotype control cells.
Distribution of AML cells in D/M/R cavities
The protocols to determine the bone remodeling status were detailed previously51. The first calcium-chelating reagent dye 1 (Tetracycline, Sigma, 35 mg/kg) was administered intraperitoneally 48 h prior to imaging to label the bone fronts and track the bone resorption activities over the course of 2 days. The second calcium-chelating reagent dye 2 (Alizarin Red, 40 mg/kg) was injected on the day of imaging to label all the bone fronts. The bone remodeling status was then defined based on the dye 1 to dye 2 ratio in a single bone marrow cavity (the concave endosteum), and therefore the bone marrow cavities were classified as: (i) deposition type (D-type; dye 1: dye 2 > 75%); (ii) resorption type (R-type; dye 1: dye 2 < 25%), or (iii) mixed type (M-type; dye 1: dye 2 between 25–75%. The distributions of seeding and expansion of AML cells were then mapped with respect to the D-, M-, R- type cavities on day 0 (3 h after transplantation), day 1, and day 3 after transplantation. The same mouse was followed up longitudinally on day 0 and day 1 where the cavity type was defined on day 0. A separate cohort of animals was used for day 3 to avoid unwanted inflammatory responses from the survival surgical procedures.
References
61. Spencer, J. A. et al. Direct measurement of local oxygen concentration in the bone marrow of live animals. Nature 508, 269–273 (2014).
62. van Gastel, N. et al. Induction of a Timed Metabolic Collapse to Overcome Cancer Chemoresistance. Cell Metab 32, 391-403 (2020).
63. Sykes, D. B. et al. Inhibition of Dihydroorotate Dehydrogenase Overcomes Differentiation Blockade in Acute Myeloid Leukemia. Cell 167, 171-186 (2016).
64. Corral, J. et al. An Mll–AF9 Fusion Gene Made by Homologous Recombination Causes Acute Leukemia in Chimeric Mice: A Method to Create Fusion Oncogenes. Cell 85, 853–861 (1996).
65. Patil, A. & Patil, A. CellKb Immune: a manually curated database of mammalian immune marker gene sets optimized for rapid cell type identification. bioRxiv 2020.12.01.389890 (2020).
66. de Graaf, C. A. et al. Haemopedia: An Expression Atlas of Murine Hematopoietic Cells. Stem Cell Reports 7, 571–582 (2016).
67. Zhang, X. et al. CellMarker: a manually curated resource of cell markers in human and mouse. Nucleic Acids Res 47, D721–D728 (2019).
68. Kim, D., Paggi, J. M., Park, C., Bennett, C. & Salzberg, S. L. Graph-based genome alignment and genotyping with HISAT2 and HISAT-genotype. Nature Biotechnology 37, 907–915 (2019).
69. Liao, Y., Smyth, G. K. & Shi, W. featureCounts: an efficient general purpose program for assigning sequence reads to genomic features. Bioinformatics 30, 923–930 (2014).
70. Whitfield, M. L. et al. Identification of Genes Periodically Expressed in the Human Cell Cycle and Their Expression in Tumors. Mol Biol Cell 13, 1977–2000 (2002).
71. Butler, A., Hoffman, P., Smibert, P., Papalexi, E. & Satija, R. Integrating single-cell transcriptomic data across different conditions, technologies, and species. Nature Biotechnology 36, 411–420 (2018).
72. Yu, G., Wang, L. G., Han, Y. & He, Q. Y. ClusterProfiler: An R package for comparing biological themes among gene clusters. OMICS 16, 284–287 (2012).
Animal handling
Male and female 8wk-old C57Bl6/J mice (#000664) or male and female CXCL12-DsRed mice (#022458) were ordered from the Jackson Laboratory, housed in our animal facility for at least 2 weeks and used for experiments between 10-14 weeks of age. 8-week old female Fezh/J mice (B6J.129(Cg)-Gt(ROSA)26Sortm1.1(CAG-cas9*,-EGFP), were ordered from the Jackson laboratory (#026179) and used for experiments. Male and female b-actin-GFP mice (Jackson #006567) were bred in house and used between 10-16 weeks of age. Male and female b-actin-DsRed mice (Jackson #006051) were bred in house and used between 10-16 weeks of age. β-actin luciferase (βact) mice from Taconic (#11977) were bred with ubiquitin-c-GFP (UcGFP) mice from the Jackson laboratory (#004353) to generate βact-UcGFP transgenic mice. An 8-week old female βact-UcGFP mouse was then used for generating the HA9M1 cell line. All mice were housed in the pathogen-free MGH Animal Facilities, which were equipped with ventilated micro-isolator cages. Sentinel programs and veterinary oversight were in place. Mice were provided with standard chow and drinking water ad libitum. An automated 12h dark - 12h light cycle was observed and mice were housed at a fixed temperature (70 Fahrenheit) and humidity (66%). The MGH Animal Facility is under supervision of the MGH Center for Comparative Medicine. All facilities are fully accredited by AAALAC (#000809) and meet NIH standards as set forth in the “Guide for Care and Use of Laboratory Animals” (DHHS). All procedures involving animals were carried out in agreement with protocols 2012N000190, 2007N000148 or 2016N000085 that were approved by the Institutional Animal Care and Use Committee of Massachusetts General Hospital.
Data availability
The 10X-seq and SMARTseq-v4 data generated in this work have been deposited into the Gene Expression Omnibus (GEO) database GSE188902 (https://www.ncbi.nlm.nih.gov/geo/query/acc.cgi?acc=GSE188902) which is publicly available. The mouse mm10 reference genome was downloaded from 10X genomics (https://support.10xgenomics.com/single-cell-gene-expression/software/downloads/latest?). Public, bulk RNA-seq AML datasets from TCGA (https://cbioportal-datahub.s3.amazonaws.com/aml_ohsu_2018.tar.gz) and OHSU (https://cbioportal-datahub.s3.amazonaws.com/laml_tcga_pan_can_atlas_2018.tar.gz) were download from cbioportal. Due to the extremely large file sizes accompanying the extensive imaging data, raw image data is available from the corresponding authors upon request. Cell lines are available from the authors upon request and mouse lines are commercially available at the Jackson Laboratory. Source data files for all graphs presented in the Figures and Extended Data Figures are linked to the online version of the manuscript.
Code availability
The codes generated during this study are available at GitHub repository (https://github.com/shenglinmei/Image-seq) and Zenodo (https://zenodo.org/record/7067661).
Statistics and Reproducibility
P values < 0.05 were considered significant unless specified otherwise. The number of biological replicates and independent experiments for each graph, along with the test statistic, are listed in each Figure and Extended Data Figure and legend. A list of statistical parameters for these, including confidence intervals, degrees of freedom, mean, standard deviation and effect sizes can be found in the Supplementary Information file. Below we list the number of biological replicates (BR) and independent mice (IndM) for all images shown in the Figures and Extended Data Figures.
Figure 1: c) 21 BR of in vivo cell aspiration from 10 IndM.
Figure 2: a) Tiled calvarium BM images obtained from 3 IndM. e) 50 BR of stromal cell extraction from 14 IndM.
Figure 3: g) Tilescans were obtained from N=5 IndM. N=4 BR of cell extraction from HB and N=4 BR of cell extraction from LB regions were performed in 6 IndM. A total of 4 HB/LB cell extractions were performed in the same mice from which we also obtained tilescans. Sequencing was performed on one LB and HB sample, respectively.
Figure 4: d) Imaging of the entire calvarium BM at day 3 was performed in 17 IndM, including 122 BR with P, 35 BR with IM, and 79 BR with NP cells. e) 107 BR with P, 10 BR with NP and 32 BR with IM cells (N=3 IndM, respectively) were identified by longitudinal imaging (definition of P, NP, IM based on fold-change difference between Day1-Day3).
Figure 5: d) Imaging of DPP4 antibody staining: 25 BR with NP cells and 5 BR with P cells (2 IndM). b), d): Definition of P/NP/IM based on cell number at day 3.
Extended Data Figure 7: d) Imaging of DPP4 isotype control labeling was performed in 14 BR with NP cells and 6 BR with P cells (1 IndM). Definition of P/ NP/IM based on cell number at day 3.
Reagents
A list of antibodies is included in Table S6, a list of reagents is included in Table S8.